


 Arguments


CO2 is the main driver of climate change
What the science says...
| Select a level... |
 Basic
Basic
|
 Intermediate
| |||
|
Theory, models and direct measurement confirm CO2 is currently the main driver of climate change. |
|||||
Climate Myth...
CO2 is not the only driver of climate
I don’t “deny” climate change or global warming, it is clear to me that the Earth has warmed slightly in the last century, this is indisputable. I also believe that increasing amounts of CO2 in Earths atmosphere are a component of that warming, but that CO2 is not the only driver of climate as some would have us believe. However, what is in dispute (and being addressed by mainstream climate science) is climate sensitivity to CO2 as well as the hiatus in global warming, also known as “the pause”. Since I embrace the idea of warming and that CO2 is a factor, along with other drivers including natural variability, the label “denier” is being applied purely for the denigration value, and does not accurately reflect my position on climate. (Anthony Watts, May 2015)
At a glance
It may come as a surprise to some people unfamiliar with climate science, but tracking down anyone who actually said, "CO2 is the only driver of climate change", has proved most elusive. Thus, the idea that, "CO2 is not the only driver of climate as some would have us believe.", is lacking something rather important. Who actually said it?
In climate science, nobody ever said it. That's because climate science covers everything that affects the climate. If you don't include everything, it would be like trying to find out how an internal combustion engine-powered car works, using as an example one without a crankshaft. The talking-point looks more like an example of a straw man fallacy, in which an argument, claim, or opponent is invented, and then shot down in flames, point-scoring being the idea. One sees this a lot in politics, but not in science.
Through science, we know that Earth's climate is affected by a myriad of drivers that operate on timescales varying from seasons to tens of thousands to tens of millions of years. We've investigated them in depth and we continue to do so. We understand which ones act as 'radiative forcings' - the external, independent primary drivers that determine whether energy is being added to or removed from the system. We likewise understand which ones act as 'feedbacks' - secondary drivers that determine how energy is moved around within the system.
The very nature of science is that it is an ongoing self-correcting process in each and every discipline. So we do understand the key forcings and feedbacks that operate within our climate and on what time-scale they occur. CO2, along with the other greenhouse gases, is but one of these factors.
Before you get too relaxed, however, of all the variables out there, CO2 is the one that has seen a huge change. Since pre-industrial times its concentration has gone up by a whopping 50%. Just imagine if a change of that amount occurred with another part of the climate system. How about the strength of sunlight going up by 50%?
Ironically, at the time of writing (early 2024), there is a lot of discussion as to why 2023 was so warm. The heat came on particularly in the second half of the year, coinciding with the onset of strong El Nino conditions in the Pacific Ocean. But normally there's a lag between El Nino starting up and peak temperatures. Did the injection of unusual amounts of water vapour into the upper atmosphere by the Hunga Tonga-Hunga Ha'apai volcano have a hand? Possibly. Did the cleaning-up of sulphate aerosol-generating shipping fuels partially remove a well-known negative or cooling feedback, and if so by how much?
The trouble is that scientific investigations involve a lot of careful hard work and that takes a lot of time. For people more used to the instant answers of politicians, that might be disappointing, but there's a difference. Science requires evidence, politics less so.
Please use this form to provide feedback about this new "At a glance" section. Read a more technical version below or dig deeper via the tabs above!
Further details
If you have read the at-a-glance section, you will have already realised that the myth that some climate scientist said, "CO2 is the only driver of climate change", is a good example of a straw man fallacy in which an argument, claim, or opponent is invented, and then shot down in flames. But for completeness, let's take a quick look at some other drivers of Earth's climate system.
Natural processes have determined Earth’s climatic history for its 4.56 billion year long existence. However, right at the very end of that time-line, humans have come along and deliberately brought significant change to one mechanism that is driving Earth’s climate into the future.
At any given time, the Earth’s climate is subjected to a myriad of natural climate forcing and feedback processes. The impact of each varies with the magnitude of the natural change. It varies with the duration over which the change occurs and whether or not that change is part of an overall repeated cycle. Cyclic variations tend to cancel themselves out over time. However, remember that time may be orders of magnitude greater than a human lifespan.
Processes that have historically altered the face of the planet include things like cycles in the Earth’s orbit around the Sun or shifts in the planet's tectonic plates. Orbital cycles are potent enough to trigger periods of glaciation in the current Icehouse climate state on Earth. They can also bring us back out of ice-ages, with the help of amplifying climate feedbacks. These large changes take place over tens of thousands of years.
Plate tectonics rearranges continents. It brings them to collision, throwing up mountain ranges. Or it rifts them apart, creating new oceans in the process. But these changes are very slow. Tectonic plates, at their fastest, only move at the same rate at which human fingernails grow, Such geographical rearrangements typically occur over millions of years.
While not nearly as dramatic, the influence of solar, ocean and wind patterns is much more immediate. The El Nino Southern Oscillation (ENSO) is a good example. But the warm phase - El Nino - has a cool counterpart - La Nina. These phenomena swing between warming and cooling respectively, over the course of months to years. So they roughly cancel one another's effects out. Having said that, there are decades during which La Nina or El Nino has been predominant, such as the period from 2000-2012, once popularly referred to by climate science deniers as 'the pause'. All consigned to the dustbin of history now, of course. ENSO involves heat being moved around within the climate system. In a La Nina-dominated decade, that heat is mostly going into the oceans. That's what actually happened in 2000-2012.
Volcanic eruptions and impacts from celestial bodies such as asteroids have a near-instant effect. Luckily though, very few of these one-off events are of sufficient size to impact the global climate for more than a few years. That was not always the case in the deep past, which is why we invest in monitoring such things carefully.
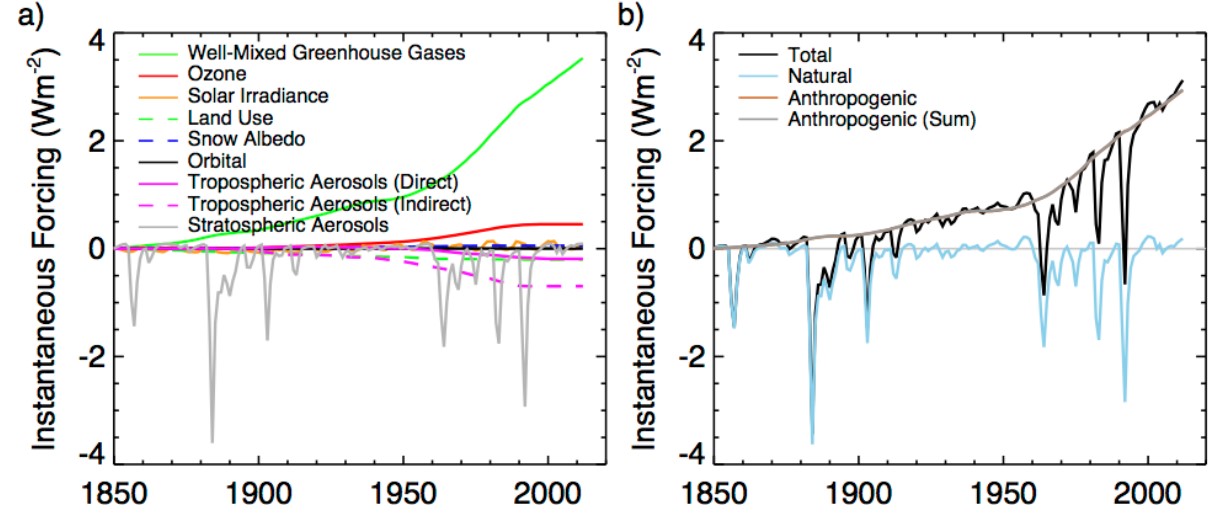
Fig. 1: Instantaneous radiative forcing at the tropopause (W/m2) in the E2-R NINT ensemble. (a) Individual forcings and (b) Total forcing, along with the separate sums of natural (solar, volcanic and orbital) and anthropogenic forcings. Source: GISS.
The industrially-driven increase in CO2 and other greenhouse gases to the atmosphere profoundly differs from such natural processes. This human influence is happening very rapidly (fig. 1). It is not cyclical and it pushes the climate continually and relentlessly in the single direction of warming. And we know we are doing it.
No other species has done this intentionally. The cyanobacteria that oxygenated Earth's atmosphere, starting around 2,450 million years ago, did cause major climatic change as a side-effect. However, nobody can seriously accuse them of having done it on purpose.
Other human-related factors need to be considered too. They include changes in land use, emissions of carbon soot and aerosols. These are all likewise studied individually. However, their net impact is cumulative. Likewise, over the last 50 years of satellite observations of the Earth’s climate, all natural influences have been studied in detail. These include orbital variations, solar output, volcanic activity and changes in both surface and cloud-top albedo. Oceanic fluctuations such as ENSO and the Pacific Decadal Oscillation (PDO) have likewise been tracked as they vary back-and-forth through time.
Natural processes will continue to introduce short term variability in our climate. However, the relentless rise of CO2, now 50% up on pre-industrial levels, has become the dominant factor in determining our planet’s climate now and in the years to come. Other factors like those mentioned above will manifest from time to time over the short term: warmer and cooler years, sometimes singly, sometimes in clusters. These form the irregular noise on temperature graphs (fig. 2) and Realclimate has an interesting recent discussion on the record-breaking 2023 and the factors responsible here. But the bottom line is that all of the graphs show that same long term trend. Upward.
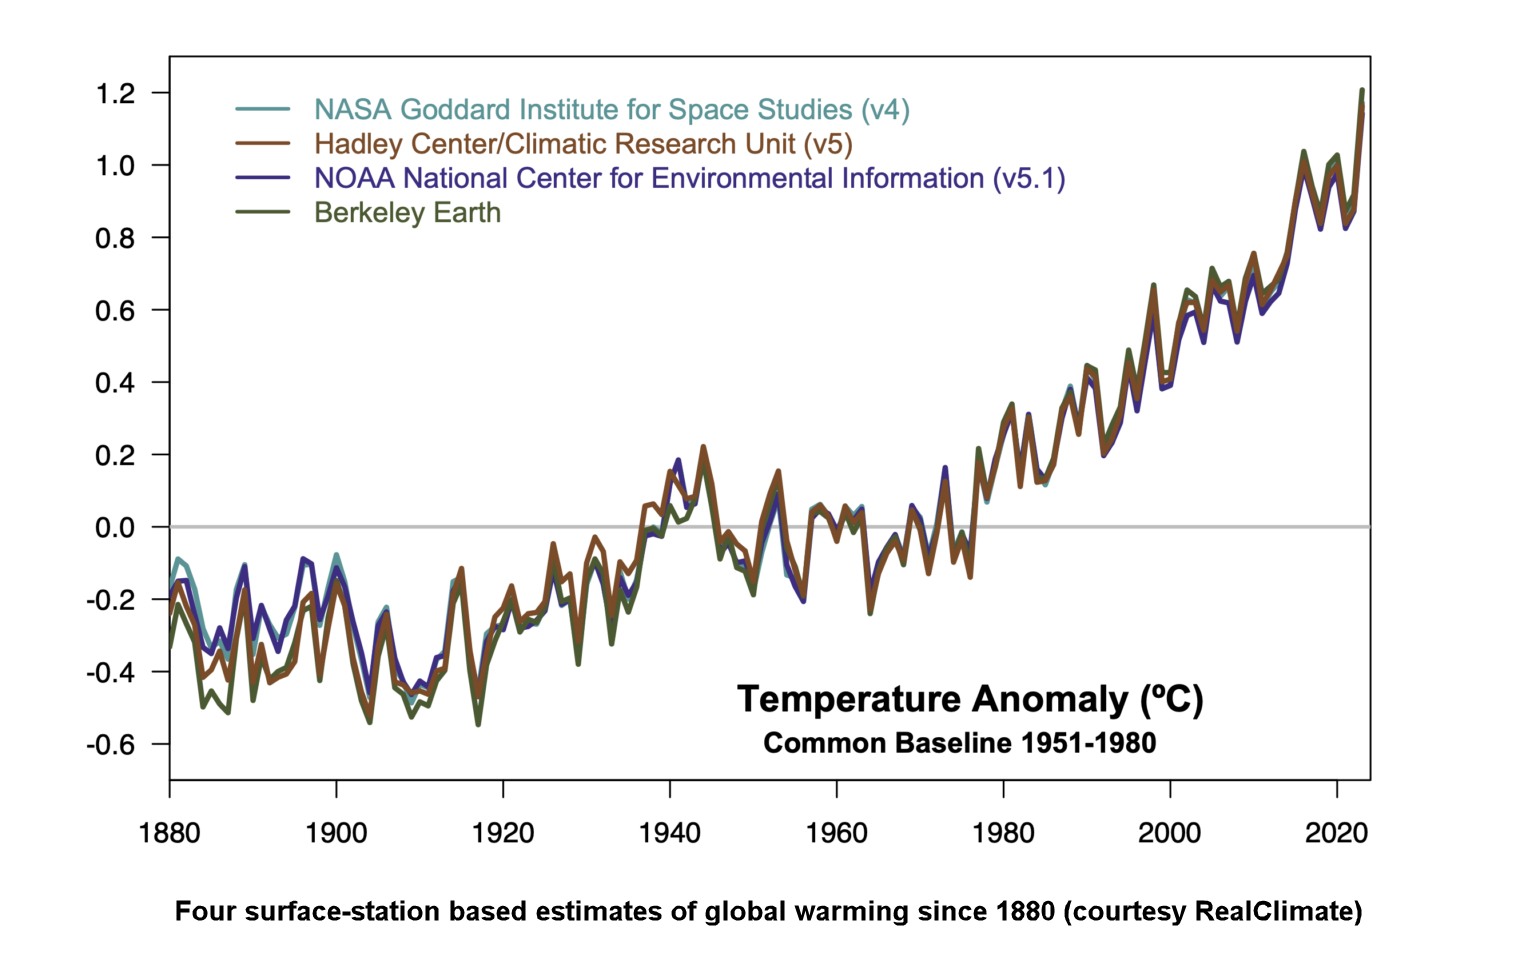
Fig. 2: up and up. Graphic: RealClimate.
Last updated on 26 May 2024 by John Mason. View Archives


Another source of temperature reconstructions is the IPCC sixth assessment report. The following figure is from the Summary For Policy Makers. Full scale image is available at this link. The grey shading represents the uncertainty. Nothing even comes close to piotr's claim of a "decrease up to 1.5°C".
Piotr @73 ,
another puzzle is your comment about "thousand parameters" [unquote] which you mention in your third paragraph. I would very much care to learn what these parameters are. (Personally, I would struggle to nominate more than a dozen relevant parameters.)
Are you repeating the words of some non-scientist . . . or are you being very loose with your language ? It is desirable to be accurate & precise - not loose & hyperbolical - when discussing climate. Otherwise, you are wasting your time and are confusing yourself.
Let me just say thanks a lot at first for your effort to explain. Give me some time to respond. Its very pleasend not to get downed with dumb comments and instead get lot of effort.
Hm my post has not been placed but in short: thanks a lot to your effort to explain as precise as possible. very pleased to not getting dumb comments.
piotr @78,
Going back to your up-thread enquiry, the responses were not entirely nailing you initial question.
piotr @70
I think you confuse the dips in the 11-year solar cycle with the Maunder Minimum. And I would add that associating the Maunder Minimum with a frozen River Thames rather defies the evidence. Frozen Thames events were very rare and only happened in winters when a long cold period of weather engulfed the region. And they stopped happening when they demolished the old London Bridge and embanked the river through London. Without such work, we would have witnessed a frozen Thames in 1963.
piotr @72
You asked what Martin Mlynczak was talking about when he talked of something that "will not cause noticeable cooling at the surface."
The source of that quote is here and I don't think it directly quotes Mlynczak although Mlyncsak was being quoted directly upthread @69 when he says "There is no relationship between the natural cycle of cooling and warming in the thermosphere and the weather/climate at Earth’s surface," the source here dating to 2018.
And what Martin Mlyncsak was talking about is the newly established Thermosphere Climate Index which back in 2018 was dropping due to the ending of sunspot cycle 24 and with the arrival of sunspot cycle 25 has since risen from 'cold' and approaching 'warm'. This is the "natural cycle" Mlyncsak referred to when he says it has no imact on surface temperatures and given this Thermosphere is a hundred+ kilometres up in the atmosphere, this should not be any great surprise. A graphic of the Thermosphere Climate Index.
Please note: the basic version of this rebuttal was updated on May 25, 2024 and now includes an "at a glance“ section at the top. To learn more about these updates and how you can help with evaluating their effectiveness, please check out the accompanying blog post @ https://sks.to/at-a-glance