


 Arguments


Do growing glaciers disprove global warming?
Posted on 6 September 2007 by John Cook
A common skeptic tactic is citing studies out of context to misrepresent their significance. While globally, glaciers are shrinking, there are isolated cases where glaciers are growing. These anomalies are seized upon as proof against global warming. For example, a growing glacier in the Himalayas (Fowler 2006) is frequently mentioned, "confounding global warming alarmists" despite the fact that satellite measurements observe "an overall deglaciation of 21%" from 1962 to 2007 across the Himalayas.
Another region gaining recent attention is the Californian Whitney glacier on Mount Shasta which has grown 30% over the last 50 years. The reason Mount Shasta is bucking the trend is explained by scientist Erik White: "Mount Shasta is right at the very northern end of areas influenced by El Nino and were at the southern end of areas affected by La Nina. So between the two we get to see the benefits of that which means more snow and rain in this area."
This is confirmed by another study A precipitation-dominated, mid-latitude glacier system: Mount Shasta, California (Howat 2007). Howat concludes that while temperature is often a dominant factor on glacier volume changes, in the case of Mount Shasta, precipitation dominates. However, they predict the warming temperature trend will eventually dominate resulting in near total loss of Mount Shasta’s glaciers by the end of the century.
Are many glaciers growing?
The World Glacier Monitoring Service tracks mass balance measurements for a sample of glaciers from around the world. The following table shows the glacier mass balance over 2002 and 2003 (negative values indicate shrinkage):
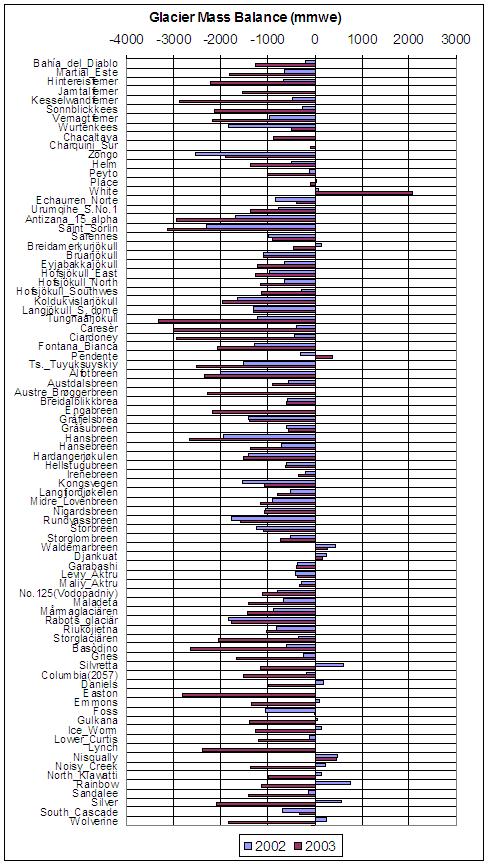
While a small percentage of glaciers are increasing in mass, the overwhelming majority are shrinking and the shrinking trend is increasing (eg - 77% in 2002, 94% in 2003). However, a statistically significant trend is better calculated over a longer time period.
Long term global trends in glacier shrinkage
Globally, glaciers are shrinking in area and thickness and the melt rate has accelerated dramatically since the mid-1990s. The National Snow and Ice Data Center have calculated global change in glacier volume - their results show glaciers are shrinking at an alarming rate.
")


 0
0  0
0 This data goes back a lot longer than the data in John's article above and tends to refute his conclusions.
Any comments?
This data goes back a lot longer than the data in John's article above and tends to refute his conclusions.
Any comments?


Comments