Climate Science Glossary

Term Lookup

Enter a term in the search box to find its definition.

Settings

Use the controls in the far right panel to increase or decrease the number of terms automatically displayed (or to completely turn that feature off).

Term Lookup

Settings


All IPCC definitions taken from Climate Change 2007: The Physical Science Basis. Working Group I Contribution to the Fourth Assessment Report of the Intergovernmental Panel on Climate Change, Annex I, Glossary, pp. 941-954. Cambridge University Press.

Home Arguments Software Resources Comments The Consensus Project Translations About Support

Bluesky Facebook LinkedIn Mastodon MeWe

Twitter YouTube RSS Posts RSS Comments Email Subscribe


Climate's changed before
It's the sun
It's not bad
There is no consensus
It's cooling
Models are unreliable
Temp record is unreliable
Animals and plants can adapt
It hasn't warmed since 1998
Antarctica is gaining ice
View All Arguments...


Username
Password
New? Register here
Forgot your password?

Latest Posts

Archives

Irregular Climate podcast 11

Posted on 2 October 2010 by John Cook

After a long hiatus, the Irregular Climate podcast is back again with Episode 11. Dan Moutal talks about the many developments that occured over the hiatus, including the Pakistan floods and Russian fires. He reviews the Inter Academy report on how the IPCC process can be improved (including an examination of Mark Morano's reaction). He examines Bjorn Lomborg's supposed U-turn (from not doing anything to not doing very much). There's some interesting discussion (well, a monologue) about why we need a price on carbon. He updates the latest developments of Cuccinelli's attempt to prosecute Michael Mann. He mentions John Mashey's meticulous expose on the Wegman Report. And of course, an Irregular Climate podcast is never complete without a dash of Monckton madness. Check it all out here...

For my skeptic debunk of the week (month? quarter?), as we'd just gone past the Arctic September minimum, I talked about Arctic sea ice (crimping from my Intermediate rebuttal and Graham's Basic rebuttal).

Skeptic Debunk of the week: Arctic sea ice has recovered

There seems to be an obsession on climate blogs about Arctic sea ice, with every twist and turn breathlessly monitored, especially in September as we approach the summer minimum. Mostly, the focus is on sea ice extent. This is the amount of ocean where ice covers at least 15% of the surface. So sea ice extent just looks at the thin shell of ice on the ocean surface. This doesn’t tell us how thick the ice is or how much ice there is in total.

Sea ice consists of thin first-year ice and thicker, older ice, called multi-year ice. Every year, as the North Pole heads into winter, first-year ice forms only to melt again in summer. So sea ice extent bounces up and down each year, driven by temperature. But it's also affected by wind, cloud cover and ocean currents. Consequently, we see a lot of variability from year to year, depending on weather conditions.

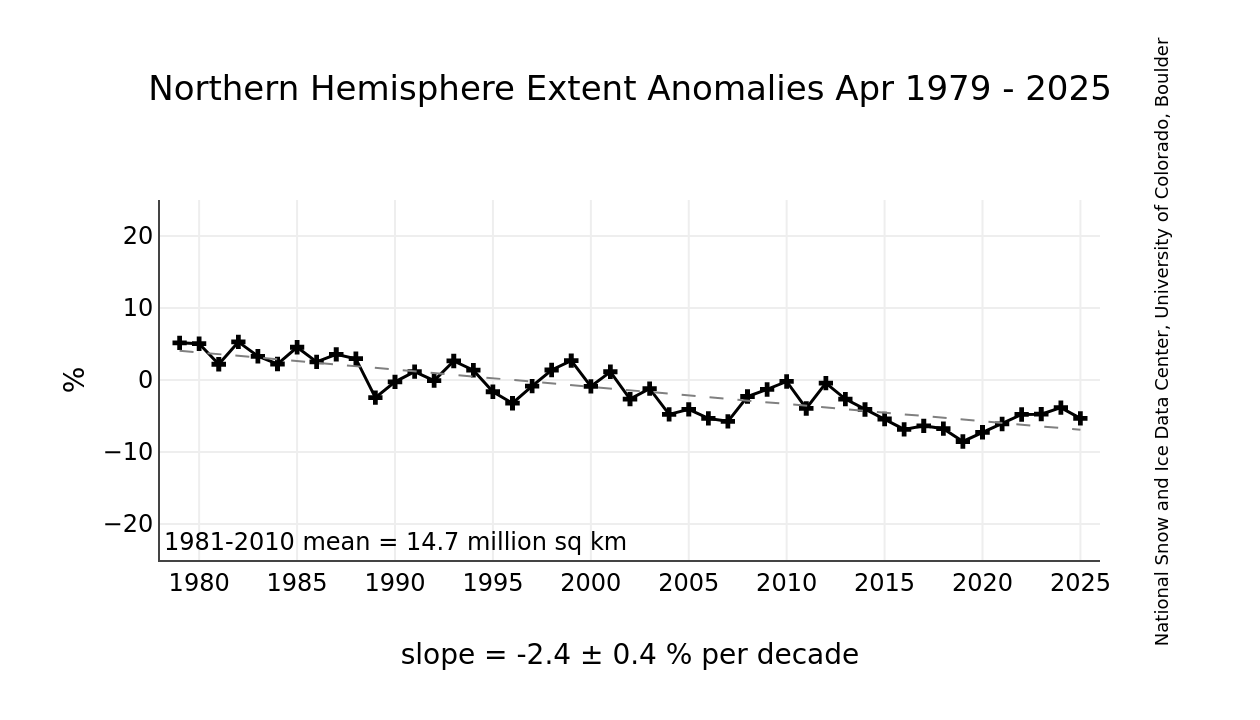
In the summer of 2007, sea ice extent fell to a record low. The dramatic drop was due to several factors - warming temperatures, wind conditions and unusually sunny weather in 2007. Over the next few years, sea ice extent bounced back a little. Unsurprisingly, this had some people saying Arctic sea ice was all recovered and back to normal. But it's not appropriate to draw conclusions about the health of Arctic sea ice based on a few years data - particularly with sea ice extent which shows so much variability from year to year. You need to look at the long-term trend which shows a decrease of about 5% of sea ice cover per decade.

But even while sea ice extent went up slightly from 2007 to 2009, what was happening underneath was more important. Overall, Arctic sea ice is getting thinner. Multi-year ice is melting which is important because it makes up most of the sea ice. Even over those few years when extent was going up, the ice was thinning underneath. In 2010, the total amount of Arctic sea ice dropped dramatically hitting a record low.

So if someone tells you Arctic sea ice is recovering, remind them that sea ice exists in three dimensions, not two. When you look at the full picture, the total amount of sea ice is still falling and hit record lows in 2010.

0 0

Printable Version  |  Link to this page

Comments

Comments 1 to 28:

  1. Cryptic? No. Clearly JohnT is saying that the claims about the Antarctic in the article are not true. Of course... the article doesn't mention the Antarctic at all, but that doesn't make JohnT's post 'cryptic'.
    0 0
  2. "The Arctic ice result isn't what you claim. The Antarctic is not either." JohnT, The post's claim is that "Overall, Arctic sea ice is getting thinner." Presumably, you believe it is not. Evidence? Here is sea ice concentration (30% or more) and extent for two dates 20 years apart. Spot the difference?
    0 0
  3. John T Here's a side by side picture of Arctic sea ice for 20 August 1980 & 2010. Notice anything different over the 30 years on say the east of Greenland or in the Canadian archipelago? Or perhaps the amount of ice cover itself?
    0 0
  4. Lets not cherry pick particular dates please unless you're using the summer minimums...
    0 0
  5. I'm not sure that presenting data from the same calendrical date separated by 30 years is "cherry picking," Robert. That's easily enough time to capture a trend. All the same, looking at the same delta from a graphical perspective and being more inclusive is arguably better in terms of eliminating ambiguity. A classic example of "cherry picking" would be to take data from 1987 to 1989 and claim that was a "recovery," or 2007-2009 for that matter.
    0 0
  6. Robert Way, Why focus on the summer minimums? If you look at the two illustrations, the one on the left (as well as a higher extent) has clearly more high concentration ice (up to 100% shown by the grey colour) than the one on the right, which has more ice of lower concentrations (as shown by the brighter greens & reds). There are even areas of low concentration close to the North Pole. The dates were chosen more or less at random. In 2010 the ice is thinner and more spread out. It is a rough corroboration of the PIOMAS model, which shows the fall in volume.
    0 0
  7. @doug_bostrom, #4: you might not be sure, but I am sure it is indeed "cherry picking" just as Robert said. Even if you had chosen the summer minimum as he suggests, that would still be too unreliable: the signal is too noisy, careful averaging is essential.
    0 0
  8. It would be easy to compare minimums, Robert and the difference would be just as obvious. It would also be interesting to note that the date at which the minimum happens has been getting later in September. Although MattJ does have a point, the difference is so large that it does not matter that much; a visit to Crysosphere Today will put things in perspective pretty quick. What's happening is blatantly obvious.
    0 0
  9. You believe short term variability exceeds the cumulative anomaly of 30 years, Matt? Does the graph suggest that? Wait a minute, since when did "I" choose anything, anyway?
    0 0
  10. Careful averaging you want, careful averaging you get. 30+ years of averaging Note the grey area showing the limits of 2 standard deviations on the 30 year average graph line.
    0 0
  11. Another worthy treatment: For is it not written, "Who can adequately peer review the validity of his latest work without considering that the conventional view of cause and effect is wrong?"
    0 0
  12. doug_bostrom at 16:16 PM, doug, is that what caused you to misplace your false teeth, you lost your glasses? :-(
    0 0
  13. @doug_bostrom: that link is *hilarious*. Some of the comments are quite funny, too.
    0 0
  14. #9 Whoops, typo alert. That should be the __20__ year average graph line,
    0 0
  15. Well, Wikipedia for all its limitations does strive for balance: Yearly freeze and melt cycle 'Sea ice freezes and melts due to a combination of factors, including the age of the ice, air temperatures, and solar insolation. During the winter, the area of the Arctic ocean covered by sea ice increases, usually reaching a maximum extent during the month of March. As the seasons progress, the area covered in sea ice decreases, reaching its minimum extent in September most years. First-year ice melts more easily than older ice for two reasons: 1) First year ice is thinner than older ice, since the process of congelation growth has had less time to operate, and 2) first-year ice is less permeable than older ice, so summer meltwater tends to form deeper ponds on the first-year ice surface than on older ice, and deeper ponds mean lower albedo and thus greater solar energy capture.' From the same page, a less dramatic looking graphic: The issue is the stubborn refusal of new ice to melt into oblivion. Of course, this by no means guarantees a recovery and could be attributed to a range of causes. Even so, consistent increases in ice extent minima albeit over a short period raises the question of whether or when some of this ice might in fact turn into old ice. I note the most recent JAXA AMSR-E/ NSIDC/ NANSEN Arctic ROOS- Sea ice extent again suggest a jump in extent. Only time will tell whether any of this turns into a robust recovery whether partial or complete. It would be nice for the world if it did but of course my wishing it won't make it so.
    0 0
  16. Oh well, the graphic didn't work but never mind - you can see it when you click on the link to the page. I was feeling chuffed for overcoming technophobia and managing to post a link successfully. I thought I'd try to do the same with an image but no luck this time.
    0 0
  17. Chris #14/15, ironically that graph shows exactly the same data as the one posted by Doug in comment #4 above. The Y-axis is given as area rather than percentage and it shows the full year rather than just the September results, but it's the same data... and thus every bit as 'dramatic', regardless of subjective impressions of how things 'look'. Statistically there is no evidence of a 'recovery' in sea ice extent. Rather the data is consistent with continuation of the ongoing trend and minor random variations. Further, the accelerating collapse of ice volume clearly makes it impossible for extent to recover. In 2007 an extent below 5 million km^2 was only possible with a rare combination of weather events. This year it happened starting from an abnormally high extent, late start to the melt season, and mixed weather. What once required a 'perfect storm' of complimentary factors is now merely ordinary... because the volume of ice has decreased dramatically since 2007. Unless volume somehow recovers, which is unlikely as ocean temperatures continue to climb, there cannot be a recovery of extent.
    0 0
  18. If this attempt fails, I give up for today - I'm not sure what I'm doing wrong. The graph is meant to show PIOMASS - the point is no change in the September minima for three years (though maxima are less encouraging).
    0 0
  19. This is surely relevant. The blue at the top represents the oldest ice, falling to the red (the youngest). it was provided to Joe Romm by Julianne Strove of the NSIDC, from a forthcoming paper by Maslanik & Fowler. Sharp drop in oldest, thickest Arctic Ice
    0 0
  20. chriscanaris, it's really easy to take the lowest year on record and predict a recovery. Strictly speaking it is undeniable that the last three years showed a larger minimum extent than 2007, but does this tell us somenthing? Not much. What is the meaning as far as the climate is concerned? That the three years are below the long term trend for four years in a row. Adding that it happend only at the begining of the satellite dataset and that for nine years in a row the data point in the middle of the range lie above the trend line, it indicates a parabolic trend, i.e. the downward trend is accelerating. But I can understand that people may find the recent "recovery" reassuring, bad news are never welcome afterall. As for multiyear ice, i find a bit trivial that ice which didn't melt again in 2008 after 2007 is now two years ice. I do not find it that much comforting, expecially when older ice keeps decreasing.
    0 0
  21. CBDunkerson @ 16, tobyjoyce @ 18, & Riccardo @19: I guess we've had three years in a row of unusual conditions. However, let's assume sea ice is not recovering but is fast disappearing. Let's also assume a Greenland ice cap melt. I came across a fascinating paper co-authored by Phil Jones (I gather it’s his first foray into publication after what has been an undoubtedly very tough time for him) entitled 'An abrupt drop in Northern Hemisphere sea surface temperature around 1970' in Nature Volume: 467, Pages: 444–447 (23 September 2010) (doi:10.1038/nature09394) states: 'The prevailing view of twentieth-century SST variability is that Northern Hemisphere SST decreased smoothly in the decades following the Second World War, and/or oscillated continuously on multidecadal timescales throughout the twentieth century... This view is derived from analyses based on either spectrally filtered...or low-pass filtered5... versions of the data, which are incapable of revealing sudden changes in SSTs owing to the method of their construction. The monthly-resolution residual time series... give a different picture of observed mid-century SST variability. Northern Hemisphere SSTs did not oscillate continuously on multi-decadal timescales, but rose steadily throughout the twentieth century apart from two discrete events: the drops in 1945 and around 1970. The suddenness of the drop around 1970 becomes apparent when we adjust the Northern Hemisphere data to suppress the effects of ENSO and volcanic eruptions without reducing the time resolution of the data... or when we subtract the monthly-resolution Northern Hemisphere SST and Southern Hemisphere SST from one another... The suddenness of the drop in Northern Hemisphere SSTs is reminiscent of ‘abrupt climate change’, such as has been inferred from the palaeoclimate record... but is inevitably obscured in analyses of twentieth century decadal variability based on low-pass filtered versions of the SST data. A similar drop is evident in the fourth empirical orthogonal function of the global SST field.... Unlike the discontinuity in global-mean SSTs at 1945... the drop in NH − SH SST around 1970 is not linked to any known biases in the SST data... the drop is evident in the uncorrected gridded summaries calculated from the International Comprehensive Ocean-Atmosphere Data Set version 2.4... It is present in all historical SST products derived primarily from ICOADS measurements, including the Met Office Hadley Centre's SST data set (HadSST2), the Extended Reconstruction SST (ERSSTv3b) product developed at the US National Oceanic and Atmospheric Administration’s National Climatic Data Center, the Kaplan Extended SST data set developed at the Lamont–Doherty Earth Observatory, and the Centennial in situ Observation-Based Estimates (COBE) SST product developed at the Japanese Meteorological Agency... The drop is not tied to any apparent changes in the volume of available observations... or any known changes in SST measurement techniques recorded in the metadata (Supplementary Information), and it is not unique to observations made by ships from a single country of origin ... A drop around the same time is also evident in measurements of night-time marine air temperature data, which are processed very differently from the SST data... And a concurrent drop is evident in the fully independent Northern Hemisphere land temperature data, particularly when those data have been adjusted to suppress the effects of variations in the high-latitude atmospheric circulation, ENSO, and volcanic eruptions... The rapid drop in NH − SH SSTs around 1970 seems to be a real and robust aspect of twentieth-century climate variability.... The timing of the drop corresponds closely to a rapid freshening of the northern North Atlantic in the late 1960s/early 1970s (the ‘great salinity anomaly’...). The spatial and temporal structures of the drop in NH − SH sea-surface temperatures suggest that the hemispheric differences in surface temperature trends during the mid-twentieth century derive not from hemispheric asymmetries in tropospheric aerosol loadings... or oscillatory decadal variability in the ocean... Rather, the hemispheric differences seem to derive in large part from a discrete cooling event in the Northern Hemisphere oceans that was not geographically localized, but had its largest amplitude over the northern North Atlantic.’ Significantly, just such a great salinity anomaly may have triggered the transition between the MWP and the LIA. Of course, there are other hypotheses relating to that particular switch which don't involve the thermohaline circulation. Even so, the possibility that such mechanisms might be operating even in a world with substantially higher CO2 levels is cause for some caution when prognosticating future trends. In short, the Arctic may have some surprises for us yet - the system may not be without feedbacks sometimes overlooked in the context of very understandable concerns about the future of Arctic ice.
    0 0
  22. chriscanaris, you talked about recovery, not me. And, on this line of reasoning almost everything may have some surprise for us. It is not of any help, we won't anywhere in this way.
    0 0
  23. @chriscanaris: when posting images from wikipedia (or wikicommons, which in this case has an updated graph), you have to click on the file name again at the "File" page (the page you linked to) to get the actual file path. As you can see from this more recent graph, the September minima was actually lower this year. The earlier graph probably used the early September figures, which included a lull in the decrease that was mistakenly interpreted as the minima.
    0 0
  24. chriscanaris #20 "three years in a row of unusual conditions." is a fairly bland and anaemic misrepresentation of the factual situation, given the actual figures on ice volume. What conditions are you talking about, exactly? I have no doubt the Arctic holds some surprises for us. They may not be the ones anyone expects. If you have been keeping a weather eye on political developments, you will find that all the Arctic nations (Russia, Canada, Norway and Denmark) are making medium term preparations for a growing regional population and a resource-rich ice-free ocean. The USA is also making preparations of sorts, but we have to wonder what a Tea Party Secretary of Defence will make of it all. Arctic ice is recovering, after all, so let's not waste the taxpayers' $dollars, right? Russia Claims Arctic Natural Resources "Russia has a "natural claim" to vast supplies of natural resources in the polar region a Kremlin aide told an international forum on the Arctic on Wednesday."
    0 0
  25. tobyjoyce @ 23: Fair point about the Piomass calculation. But, as you say: 'I have no doubt the Arctic holds some surprises for us. They may not be the ones anyone expects.' Well, yes, my point exactly. No doubt, the Arctic population is increasing. Russia (or to be more precise the Soviet Union as it was then) has a long and hallowed tradition of settlement in the Arctic (not all of it entirely voluntary). The push into the Arctric long predates the Soviet Dystopia and includes a number of non Russian ventures as you'll find in the Brittanica online artice.
    0 0
  26. tobyjoyce @ 23: Fair point about the Piomass calculation. But, as you say: 'I have no doubt the Arctic holds some surprises for us. They may not be the ones anyone expects.' Well, yes, my point exactly. You and I might have different or similar expectations - I'm certainly open to the possibility/ probability that Arctic ice cover may be decreasing. However, as the Nature article suggests, all sorts of unusual things can happen. No doubt, the Arctic population is increasing. Russia (or to be more precise the Soviet Union as it was then) has a long and hallowed tradition of settlement in the Arctic (not all of it entirely voluntary - hence the capacity to send large numbers of people into highly inhospitable regions). The push into the Arctic long predates the Soviet dystopia and includes a number of non Russian ventures as you'll find in the Brittanica online artice. Moreover, the article highlights the sheer wealth of natural resources in the area. Whatever we might think of it for ecological reasons, governments in an age of advancing technology will seek to exploit what are some of the world's largest resources of fossil fuel and other mineral wealth. I'm not sure that an ice-free Arctic is the major driver.
    0 0
  27. @chriscanaris: "I'm not sure that an ice-free Arctic is the major driver." It's one of the main ones, for sure. Accessing these resources with thick multi-year ice above would be prohibitively expensive. The lowering ice is clearly one of the reasons behind the Russians' increasing presence in the Arctic (*much* higher north than the gulags you seem to refer to). This includes their provocative assertions about the underwater ridges earlier this year, a diplomatic show of force with Canada. Russians have figured out that AGW is real, and that an ice free Arctic ocean is an opportunity for them. The US, bogged down by the delaying tactics of the Climate Denial Machine, risks losing influence in this important region if it keeps burying its head in the sand.
    0 0
  28. chriscanaris #25, without an ice free Arctic, oil drilling in the region would be impossible... and I'm not talking about just part of the year. If the water around an oil rig were to freeze into ice several meters thick that rig would be badly damaged and immediately begin leaking oil. Note that all of the exploratory wells being dug are in areas that have been ice free year round for decades now. And even there they've got tug boats on call to divert icebergs away. In short, the only way any of these countries are going to be drilling for oil in the Arctic basin is if the ice melts out year round... something which won't happen for decades yet under the worst case estimates. Based on IPCC 4 it'd be at least a couple hundred years. Yet there is a race on now to lay claim to these future mineral resources. Which ought to indicate pretty clearly that they know IPCC 4 was hugely conservative and the Arctic sea ice is not 'recovering'... as claimed by some of the very same politicians pushing for Arctic oil exploration.
    0 0

You need to be logged in to post a comment. Login via the left margin or if you're new, register here.


The Consensus Project Website

THE ESCALATOR

(free to republish)


© Copyright 2024 John Cook
Home | Translations | About Us | Privacy | Contact Us