


 Arguments


DeConto et al: Thawing permafrost drove the PETM extreme heat event
Posted on 11 April 2012 by Andy Skuce
Sudden spikes in global temperatures that occurred 50-55 million years ago were caused by thawing of permafrost in Antarctica and northern high latitudes, according to recent research. The trigger for this sudden destabilization was a variation in orbital configurations that resulted in warmer polar summers. This model also provides an analogue for the releases of carbon from modern permafrost caused by current man-made global warming. Modern permafrost volumes are smaller than the estimates for those of 55 million years ago, but will nevertheless amplify the climatic effect of fossil fuel consumption and will provide continuing warming feedbacks for centuries after human emissions cease.
The Paleocene-Eocene hyperthermal events
The Paleocene-Eocene Thermal Maximum (PETM) is an extreme global warming event or hyperthermal that occurred 55.5 million years ago when a sudden “burp” of a huge quantity of carbon was emitted into the atmosphere, causing global temperatures to rise by five degrees Celsius and the oceans to become more acid. Because of the rapidity of the carbon burp, the event has often been considered an analogue of what might happen as humans release a comparable slug of CO2 into the atmosphere. The PETM was discovered in 1991 by Kennett and Stott and since then over 400 scientific papers have been written on the subject. There is a good review of the PETM by McInerney and Wing (2011). See also Rob Painting's post CO2 Currently Rising Faster Than The PETM Extinction Event and the comments in the discussion that follows it.
There are uncertainties about where the carbon in the PETM came from and what triggered its sudden release. One of the leading hypotheses (e.g. Dickens, 2003) has been that the carbon was released from methane hydrates, ice-like accumulations of methane and water that were present in sediments below the deep ocean floor. According to this hypothesis, the hydrates became destabilized as sea water temperatures gradually rose. The release of the hydrates into the atmosphere increased the greenhouse effect, which led to more hydrate destabilization. See also Lunt et al (2011).
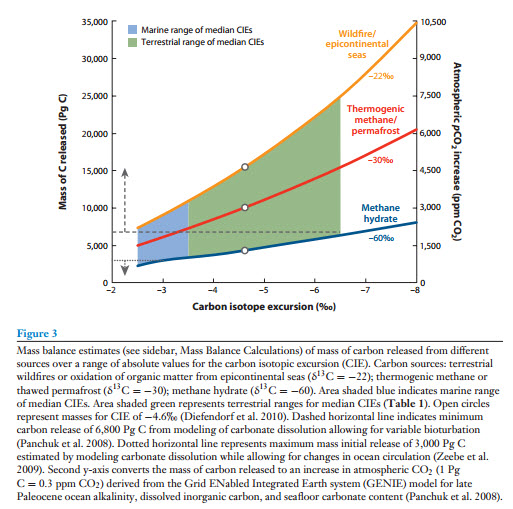
One problem with the hydrate release model is that carbon from hydrates is particularly low in the heavier C13 isotope (the hydrate δ13C value—the amount in thousandths that methane hydrate is depleted in the heavier isotope than marine carbon—is about -60‰). To achieve the level of carbon isotopes observed at the height of the PETM (the so-called Carbon Isotope Excursion or CIE) requires the release of ~2000 Pg (2000 billion metric tons) of carbon from hydrates, which may be insufficient to account for the extra greenhouse warming observed at the PETM. It is worth noting that the size of the PETM CIE has not been determined exactly, with estimates varying by more than a factor or two; with marine carbonates yielding lower estimates and estimates from terrestrial carbon samples pointing to a bigger CIE.
The PETM was the biggest, and is certainly the best-known event of its kind, but it was followed by smaller, lesser-known but similar events over the subsequent 3 million years These are known as ETM2 and ETM3; PETM is also sometimes called ETM1.
Other carbon release models for the PETM include invoking a comet impact, or massive peat and coal fires (δ13C value is about -22‰), or thermogenic methane releases in the North Atlantic (from volcanic intrusions into mudstones rich in organic matter) with a δ13C value of about -30‰. (The more negative the δ13C value, the less emitted carbon is needed to lighten the atmosphere to the range of CIE's observed at PETM times.) The problem with all these hypotheses is that they rely upon one-off mechanisms that, even if they work for the PETM, it is improbable that they could be invoked again to account for the ETM2 and ETM3 events.
A paper just published in Nature (subscription only) by Robert DeConto (DC12) and seven co-authors proposes a model that, the authors claim, can account for the CIE, the extreme warming, the repetitive nature of these hyperthermal events, and the fact that the events become progressively less prominent with time.
The permafrost feedback model
There is a rock outcrop near the town of Gubbio, in central Italy, that has played a key role in three major geological controversies: continental drift/paleomagnetism; the Cretaceous-Tertiary (K-T) boundary layer, related to the comet impact and extinction of the dinosaurs; and, more recently, paleoclimate studies of the Paleocene and Eocene. If there was a prize for the “most informative rock outcrop”, the Gubbio section would have been a multiple winner.
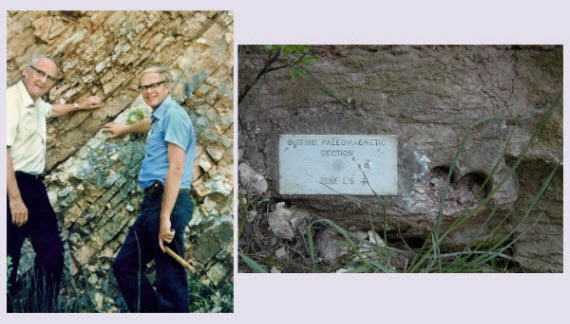 Left, Luis and Walter Alvarez at the K-T boundary in Gubbio, in 1981 (Wikipedia); right, a plaque marking a zone on the Gubbio paleomagnetic section (source).
The Gubbio rocks are a continuous sequence, some tens of metres thick, of pelagic limestones and marls formed by the shells of foraminifera that were deposited on the deep ocean floor. Galeotti et al (2010) studied this sequence in great detail using microfossils, carbon isotopes, calcium carbonate concentrations and magnetostratigraphy. They were able to correlate the hyperthermal events (PETM, ETM2 and ETM3) with orbital cycles.
DeConto et al (DC12) used these results to develop a model for the hyperthermal events that involves orbital configurations acting as a trigger. A combination of high obliquity (the tilt of the Earth’s axis of rotation responsible for the seasons) and high eccentricity (non-circular Earth orbits around the Sun), results in periods of greater insolation (more sunlight) at high latitudes. This provoked the thawing of Antarctic and Arctic permafrost, releasing carbon into the atmosphere, causing increased greenhouse warming, which, in turn, triggered more permafrost carbon release until the permafrost carbon was used up. Once the peak of the hyperthermal was reached, rock weathering drew down the CO2, cooling the Earth until permafrost started to form again near the poles, sequestering carbon in frozen soils.
This orbitally triggered cycle is similar in some ways to the better-known and more recent ice-age cycles. For example, see Dana Nuccitelli's post on the recent Shakun et al paper. However, the ice-age cycles were partly a result of albedo feedbacks from advancing or retreating icesheets—there were no continental icesheets in the Paleogene (the term for the Paleocene, Eocene and Oligocene combined)—and the ice-age CO2 feedbacks primarily involved inorganic carbon dissolved in the oceans. The timing of the cycles is also very different, all of the eight ice-age cycles occurred over a span of 800,000 years, whereas the gaps between the three Paleogene hyperthermals were 1.8 and 1.2 million years long.
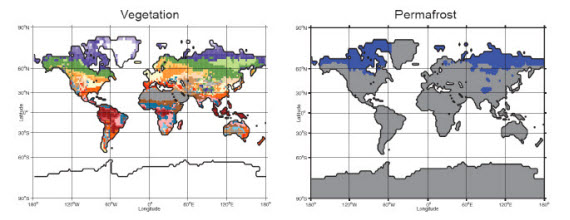
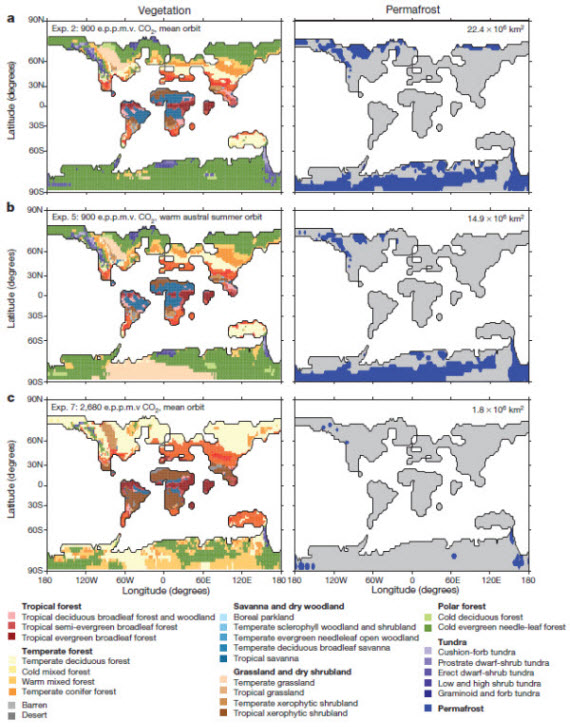 Simulations of biomes (left) and permafrost (right) for three different forcing models: 900ppm CO2 equivalent, mean orbit (top); 900 ppm of CO2 eq., warm southern summer orbit (middle); 2680ppm CO2 eq., mean orbit (bottom). A comparison with a model run on the modern Earth can be seen here. From DC12 and DC12 supplementary material. [Note: 900 ppm of CO2 eq. includes 760ppm CO2, plus CH4 and N2O; 2680ppm CO2 eq, comprises 2000ppm CO2 plus the other GHGs.]
DeConto and his co-workers tested a variety of atmospheric and orbital parameters using a Global Climate Model with coupled biosphere and soil components. Three of the model runs (#2, #5 and #7) are shown above. In model #2, global average temperatures are 6°C warmer than today, yet the area of permafrost is 22.4 million km2, which is roughly equivalent to today’s area of 19 million km2. At first sight, it may appear odd that the area of permafrost in the Paleogene hothouse climate was similar to the area in today’s icehouse climate. The problem is resolved by considering that the continent of Antarctica was unglaciated 55 million years ago and its land area was bigger than today’s due to relative isostatic uplift, providing room for large permafrost areas that compensate for the much smaller permafrost areas, compared to the modern situation, in the Paleogene north.
In model #5, the higher obliquity and eccentricity configurations increase summer insolation at both poles, reducing the permafrost area by 33%.The emissions associated with this thaw produce a positive greenhouse feedback, leading, eventually, to a situation like model #7, where atmospheric greenhouse gasses are at a level of 2680ppm CO2 equivalent, in which global mean temperatures have risen by 6°C above the late Paleocene norm and permafrost has all but disappeared from the planet.
A schematic of the permafrost-hyperthermal mechanism
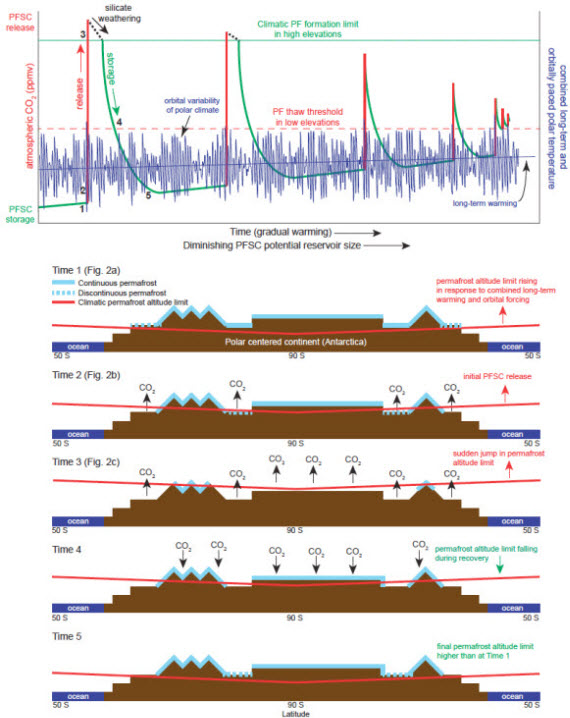 The red and green peaks on the upper panel show a series of hyperthermal spikes built upon a rising base trend of increasing CO2. The lower schematics illustrate how the permafrost-hyperthermal feedback cycles work. From the supplemental material of DC12.
In the graphic above, the initial release of carbon (between times 1 and 3) takes 10,000 years. Following this release, the very high ensuing global temperatures increase the rate of the chemical reactions involved in the weathering of silicate rocks. These reactions reduce the CO2 in the air over periods of hundreds of thousands of years, gradually cooling the climate. Eventually, it gets cool enough at higher elevations near the poles for permafrost to reform, which further draws down the CO2. Because of the longer-term background trend of increasing CO2 concentrations and a warming climate, less permafrost was re-formed to be available for driving the future, and smaller, hyperthermals ETM2 and ETM3.
The new model of DeConto et al will not, of course, be the final word on the subject of the Paleogene hyperthermals. Climate models are unable yet to fully account for all the features of the Paleogene climate. Current proxy measurements of CO2 concentrations and regional temperatures are highly uncertain and some important factors, such as methane concentrations, cannot yet be measured at all.
As noted earlier, there is also uncertainty over the size of the PETM carbon isotope excursion, also. Figure 3 from the review article of McInerny and Wing (2011) shows that a release of 3434 +/- 951 PgC (billion tonnes) of permafrost carbon, as proposed in DC12, would barely account for only the lowest estimates of the PETM CIE. It is perhaps likely that releases of C13-depleted methane hydrates played at least a supporting role, maybe as a feedback, in these extreme warming events.
Volumes and emission rates, then and now
The required mass of carbon to be added to the atmosphere between stages #5 and #7 is estimated to be 3434 (+/- 951) billion tonnes, with the total pre-PETM permafrost carbon pool being 3728+/- 1033 billion tonnes. This figure is more than double the 1700 billion tonnes estimated to be in place in modern permafrost. Yet, as remarked previously, the areas of permafrost then and now are roughly equivalent. This apparent discrepancy is accounted for in DC12 by the authors assuming that:
a) The depth of permafrost in the Paleocene was thicker than today’s, because a much longer preceding cool period, perhaps a million years before the PETM, allowed ample time for the large volumes of carbon to be deposited; whereas modern permafrost carbon deposition (in most areas) occurred only during brief (~10,000 year) interglacial periods.
b) DC12 argues that the interior of Antarctica was a flat plain, prone to hosting wetlands with associated carbon-rich peat deposition; a situation that would have allowed for the accumulation of much more carbon per unit area than the modern average.
The rate of carbon release in the DC12 model is estimated at up to 1.5 billion tonnes per year, comparable to calculations of the rate of release calculated by modelling modern permafrost under the IPCC A1B scenario (Schaeffer et al, 2011), but spread over thousands of years for the PETM case; whereas the Schaefer model has carbon emissions lasting for just 200 years. Our current global emissions, for comparison, are over 9 billion tonnes of carbon per year, some six times the maximum rate modelled for the PETM or permafrost later this century.
The not-so-permafrosting on the fossil fuel cake
Schuur and Abbott (2011) polled 41 permafrost experts for their estimates on the future release of permafrost carbon. Below, is the range of estimates for cumulative emissions by certain dates:
Date Estimate (billion tonnes C CO2)
2040 30-63
2100 232-380
2300 549-865
The great majority of this release of permafrost carbon will be in the form of CO2, but Schuur and Abbott estimate that 2.7% will be as methane (CH4). Because methane has a much higher global-warming potential, about half of the climate forcing induced by permafrost emissions will come from that gas alone.
Within the next 90 years, therefore, we can expect permafrost carbon emissions of a little less than one-tenthfortieth of the total amount estimated by DC12 for the PETM. After 2100, cumulative emissions are expected to more than double over the following two centuries. Over a longer timeframe of many centuries, we can expect a further contribution of carbon to the atmosphere from the destabilization of gas hydrates. Some researchers argue that hydrate releases may already have started.
The potential for a major permafrost carbon release in this century is quite real and the hypothesis outlined in DC12, for the first time, provides an ancient analogue of a permafrost release causing a major global warming event. Nevertheless, we are not likely to get a PETM-sized carbon release because the amount of carbon in current permafrost stores is relatively small compared to the Paleogene. An ETM2 or ETM3-sized hyperthermal may be more plausible, however.
The estimates of permafrost emissions can be compared with the carbon in proven remaining reserves of oil, gas, coal and the Alberta bitumen sands (amounts are from reserves figures from BP and Alberta’s ERCB, as converted to carbon emissions by Swart and Weaver, 2012 (subs. only)). These reserve estimates sum to about 900 billion tonnes of carbon in proven fossil fuel reserves. At current levels of consumption, these stores of carbon will be released into the atmosphere over a period of just a few decades. (BP's proven reserves/production ratio for oil is 46 years; for gas, 59 ; and for coal, 118). As the conventional reserves are consumed, they will be partly replenished by new discoveries and reserves growth. Technological improvements and rising prices will enable the exploitation of the huge resource base of coal and unconventional gas and oil. The 900 billion tonne figure is thus best regarded as a minimum case on a business-as-usual path. Our cumulative emissions from continuing fossil-fuel use over this century are therefore likely to be much bigger even than the worst-case permafrost release three centuries from now.
Positive net carbon-cycle feedbacks from thawing permafrost may start as early as 2020, which will make emissions mitigation efforts more difficult. By 2100, net emission rates from permafrost could reach 1.6 billion tons of carbon per year (Schaeffer et al al, 2011), which exceeds the current annual emissions from the United States. Once started, permafrost emissions would be impossible to reverse and would endure for centuries, making climate change steadily worse even if we had already stopped all emissions from fossil fuels. The only way to prevent permafrost feedbacks is to limit climate change enough not to incite them in the first place. The Eemian interglacial may have been slightly warmer than today and did not provoke a runaway permafrost feedback, so it may not be too late.
In conclusion, disquieting though the threat of future permafrost feedbacks undoubtedly is, we should perhaps worry more about the far greater stores of fossil carbon that we are now quite deliberately exhuming and putting into the atmosphere over a much shorter time period than any projected releases from thawing frozen ground. Indeed, as I argued in a previous article, our business-as-usual emissions are on track to change our atmosphere to the baseline levels in the Eocene and Paleocene. That is plenty to be worried about. By the time we get to the stage of having doubled or tripled pre-industrial levels of greenhouse gasses, any additional carbon releases from thawing long-frozen ground will just be the icing on an over-baked cake.
[Note: the Schurr and Abbott permafrost emission estimates were originally labeled "billion tones C", whereas it should read "billion tones CO2". In a subsequent paragraph the realtive size of expected permafrost emissions in this century was misstated and corrected. Changes made May 26, 2012]
Thanks to Rob Painting, Alex C and Dana Nuccitelli for helpful comments.


As far as I know, there was no permafrost in the Arctic or Antarctic during the Eocene. The Antarctic did not freeze over until around 34-35 mya and the Artctic until about 3 mya.
[PS] Please read the article (and paper). Lack of ice in Antarctica is key. You dont need ice-covered poles to have permafrost.