Climate Science Glossary

Term Lookup

Enter a term in the search box to find its definition.

Settings

Use the controls in the far right panel to increase or decrease the number of terms automatically displayed (or to completely turn that feature off).

Term Lookup

Settings


All IPCC definitions taken from Climate Change 2007: The Physical Science Basis. Working Group I Contribution to the Fourth Assessment Report of the Intergovernmental Panel on Climate Change, Annex I, Glossary, pp. 941-954. Cambridge University Press.

Home Arguments Software Resources Comments The Consensus Project Translations About Support

Bluesky Facebook LinkedIn Mastodon MeWe

Twitter YouTube RSS Posts RSS Comments Email Subscribe


Climate's changed before
It's the sun
It's not bad
There is no consensus
It's cooling
Models are unreliable
Temp record is unreliable
Animals and plants can adapt
It hasn't warmed since 1998
Antarctica is gaining ice
View All Arguments...


Username
Password
New? Register here
Forgot your password?

Latest Posts

Archives

What's happening to glaciers globally?

Posted on 16 September 2010 by robert way

Although Glaciologists measure year-to-year changes in glacier activity, it is the long term changes which provide the basis for statements such as "Global Glacier Recession Continues". Some Skeptics confuse these issues by cherry picking individual glaciers or by ignoring long term trends. Diversions such as these do not address the most important question of what is the real state of glaciers globally?

The answer is not only clear but it is definitive and based on the scientific literature. Globally glaciers are losing ice at an extensive rate (Figure 1). There are still situations in which glaciers gain or lose ice more than typical for one region or another but the long term trends are all the same.


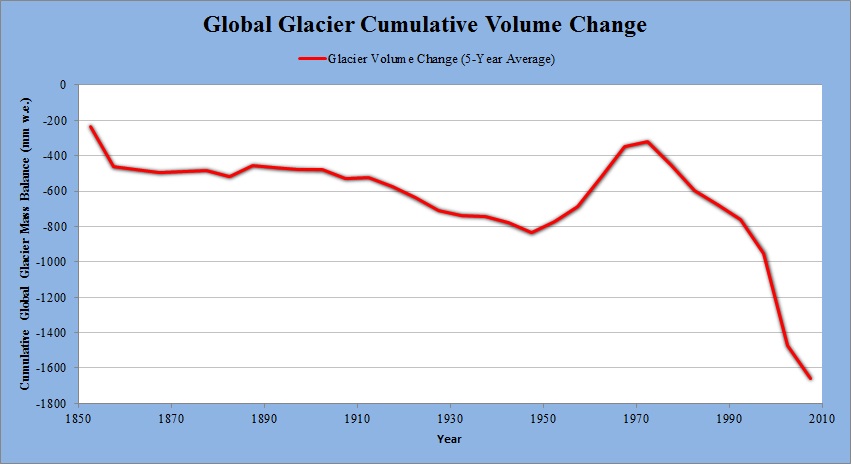
Figure 1: Long term changes in glacier volume adapted from Cogley 2009.

It is also very important to understand that glacier changes are not only dictated by air temperature changes but also by precipitation. Therefore, there are scenarios in which warming can lead to increases in precipitation (and thus glacier ice accumulation) such as displayed in part of southwestern Norway during the 1990s (Nesje et al 2008).

The bottom line is that glacier variations are largely dependent on localized conditions but that these variations are superimposed on a clear and evident long term reduction in glacier volume which has accelerated rapidly since the 1970s.

This post is the Basic version (written by Robert Way) of the skeptic argument "glaciers are growing".

0 0

Printable Version  |  Link to this page

Comments

Comments 1 to 29:

  1. Excellent post! Very clear and understandable to anyone. Maybe this is obvious to everyone, but I hadn't realized until seeing this post that the glacier mass balance is so closely linked to global temperature. For example, if you invert the graph of Cogley, 2009 from 1880-2010 and overlay it on the GISS Land-Ocean temperature relationship, the similarity is striking. (I just did that but am unable to post a graph).
    0 0
  2. I would have just loved that it was only now (2006) for example, glaciers in the Alps 'release' houses from the eighteenth century, crushed by the glaciers. Probably around 171? -177? A.D. these glaciers have a similar or even less coverage, than they do now.
    0 0
  3. If this works then the inverted glacier mass balance (Cogley, 2009) overlain on the GISS temperature record, both since 1880, will appear below:
    0 0
    Moderator Response: It almost worked ... you had an excess "/" at the end of your file name. I've edited it.
  4. The mass balance of glaciers which in turn controls long term terminus behavior is not primarily the result of localized conditions. This is borne out by the consistency of mass balance response regionally and terminus behavior regionally. Localized conditions generate some differences from glacier to glacier, but withing a mountain range the responses tend to be dominantly similar. Note the graph that I used in the BAMS 2008 report on North American glacier mass balance or at Realclimate. Thus, we have found that in terms of year to year climate change it is regional, local, global in terms of order of importance. The high correlation North Cascades glacier mass balance-Table 3 exceeding 0.8 on all of the glaciers.
    0 0
  5. Agreed, I have to be careful how things are interpreted. Changed accordingly.
    0 0
  6. An interesting experience that Boba's graph reminded me of. I was completing multiple regression analysis of the mass balance record of the Lemon Creek Glacier, Alaska. This is a 50 year long record. I compared mass balance to 10 different circulation indices from PDO to ENSO and AO. However, I failed to remove the year column before running the data. Year came out with the best correlation of all. Simply put in the last 40 years anyway year has been a decent proxy for temperature.
    0 0
  7. Great graphic @3 Boba. Nicely done.
    0 0
  8. The article state that “there are scenarios in which warming can lead to increases in precipitation and thus glacier ice accumulation”. I thought that precipitation in the form of rain assisted glacier ice to recede not increase. Am I wrong?
    0 0
  9. Re: Agnostic (11) Were the precipitation to come down in the form of rain that would be a reasonable assumption. However, the vast majority of the precipitation still comes down as snow, just more of it. Glacier ice accumulation is a balance between the accumulation and ablation zones of a glacier. Increases in precip in the accumulation zone typically result in glacier advance. However if, due to warming air, the line of equilibrium advances higher up the mountain, the glacier could still have a net mass loss as the percentage of the glacier in the accumulation zone dwindles (even if it is thickening due to increased precip). If the accumulation zone contains less than 60% of the area of the glacier at the end of the melt season, it is in decline (mass loss). Go to Maury Pelto's site for a very clear explanation. The Yooper
    0 0
  10. Agnostic, Like Daniel Bailey said it depends on the form of the precipitation. Where glaciers gain most of their ice is usually higher up (the accumulation zone) and in these areas it is a lot more likely that precipitation falls as snow. You should also note that increases in wintertime precipitation are the important thing to consider as for most glaciers that is all snow... What it essentially means is warming can increase precipitation during winter at some glaciers, making more snow accumulated during the winter than was melted during the summer... BUT once the winter precipitation subsides or summer temperatures pass a threshold, then more melting occurs than gains.
    0 0
  11. Figure 1 (Global glacier volume) looked great to me at first. Then I started wondering how they managed to calculate the volume all the way back to 1850. From what I can tell, more than half that graph is extrapolated from just 30 glaciers, all of which are based in Switzerland. Can you really do this and come up with a reliable result?
    0 0
  12. Grim_Reaper, have a look at another graph which includes the above but also data from all glaciers since 1980, and you will see the same downward trend : NOAA Glacier Mass Balance
    0 0
  13. Oh, and the graph is determined by using over 300 glaciers (as far as I can make out), if Table 1 in the original paper itself is anything to go by - but I have only skimmed over it.
    0 0
  14. I found this document (http://www.ibcperu.org/doc/isis/7076.pdf) which confirms there's data for 300 glaciers starting with 1850, but they're all Swiss. Can you really get a global picture from just 1 small country?
    0 0
  15. Yes and glaciers in Europe are only now exposing ancient ruins of Romans (book reference 'the Chilling Stars'), the Ice Man (Ozste) etc, which means glaciers have just now got back to where they were several times in the last several thousand years, with no nasty human c02 emissions.
    0 0
  16. thingadonta, glaciers respond, among other things, to temperature. Recently it has been warming and glaciers are responding to it, whatever its cause might be. Little doubt about this, i guess, and it's what this post is showing. By the way, who said that there was no ice where and when Otzi died? Could it be so well preserved if not kept at very low temperatures from right after his death?
    0 0
  17. Grim_Reaper, the document you link to also mentions the records of 143 glaciers in Italy from a date of 1820. thingadonta, are you suggesting that glaciers don't move, and that Otzi has been in the same location for the last 5000 years ?
    0 0
  18. Since 1965 we have a strong series of mass balance from around the globe that Switzerland provides less than 10% of the data for. The WGMS collects this data each year, for 2008 there were about 100 glaciers that have been reported so far, three from Switzerland. I report 12 each year from the United States for example. Robert makes a good point about the type of precipitation. On temperate glaciers even if you get some rain events in the winter the water is stored in the deep snowpack, and almost everything falls as snow. However, we have observed one issue, and that is as the snowpack warms earlier in the winter season, fewer ice lenses are formed on the Juneau Icefield. The result is less meltwater in April and May is retained as refrozen ice lenses.
    0 0
  19. JMurphy, that'll teach me for skim reading. My point still stands though: Is this geographically limited sample sufficient to work out the global picture? I'd feel far more comfortable if those 400+ glaciers were spread around the world (as with the more recent data). For me, this undermines the authority of an otherwise excellent graph, and make it a target for sceptics.
    0 0
  20. The bottom line is that glacier variations are largely dependent on localized conditions but that these variations are superimposed on a clear and evident long term reduction in glacier volume which has accelerated rapidly since the 1970s Yet glaciers are still larger today than in 12 other several hundred years long periods during the Holocene, initiated and ended by abrupt changes each time. Ten thousand years could reasonably be called "long term", if not on a true geological time scale, at least compared to the 160 or 40 year flashes you are talking about. We should always pursue the big picture, don't we? The Holocene, July 2006 vol. 16 no. 5 pp. 697-704 doi: 10.1191/0959683606hl964rp Multicentury glacier fluctuations in the Swiss Alps during the Holocene Ulrich E. Joerin, Thomas F. Stocker and Christian Schlüchter "The radiocarbon ages of tree fragments and peat discs found on proglacial forefields indicate 12 phases of glacier recessions during the Holocene. Locations and type of occurrence of the dated samples show that trees and mires grew where glaciers exist at present and, therefore, glaciers were smaller at that time."
    0 0
  21. mspelto is right to note that WGMS provides a good source for global data on glaciers over the past few decades. I agree with Grim_Reaper's point that the data plotted in figure 1 of this post are probably not representative of the global trend in glacier mass balance. I give Berényi Péter a hard time about this constantly, in other contexts -- you can't draw reliable conclusions about a global mean from a sample with an ad-hoc spatial distribution like this. That's not to say that glaciers aren't retreating in most places; they obviously are. But quantifying the global mean trend for that is a difficult undertaking.
    0 0
  22. BP, obviously the Holocene Thermal Maximum was a warm period particularly in the mid- to high-latitude Northern Hemisphere, thanks to Milankovich geometry. That obviously doesn't apply to current conditions. Of course, if we haven't already done so we'll certainly be exceeding HTM temperatures soon enough, then exceeding MIS-5e (Eemian) temperatures as well. That doesn't bode well for glaciers. It seems unlikely that the present rapid retreat will be reversing itself any time soon.
    0 0
  23. It does appear that Fig1 is a bit of a dud if you're looking for an accurate representation of global glacier records. UNEP/WGMS put out a joint report (http://www.grid.unep.ch/glaciers/) that has a global graph (Chap 5, Fig 5.9). You could use that. The problem is you have to acknowledge that mass balance loss was as fast in 1945-1955 as it was in the past decade. The final sentance needs to be amended if you want to represent the true picture. I suggest it ends ".....which has returned to the 1940's rate". Looking at Fig 5.1 suggests to me that any data going back beyond 1940 is really only a European (and to a lesser extent US) record.
    0 0
  24. HumanityRules I doubt anyone will find difficult "to aknowledge that mass balance loss was as fast in 1945-1955 as it was in the past decade". Indeed, is a good confirmation that the planet is warming, as it has in the first part of the last century and as anyone should aknowledge. Your skeptic mates, at least the followers of the mantra "it's not warming" or "surface temperature datasets are bogus", would be in trouble instead.
    0 0
  25. HR Fig. 1 is the best representation of global glacier records we have and it correctly shows that mass losses are much greater recently than during the 1945-1955 period you mentioned. Before 1945 we have no mass balance records. The first mass balance programs began in 1946, and these records are much more negative now for the specific glaciers examined then before. Cogley has done a better job than the IPCC graph. Further as a glacier retreats which many have, it is getting rid of it worst performing sections, which is supposed to increase its balance and return it to equilibrium. This has not happened even with retreat, mass balances are getting more not less negative. In some cases this is a sign of disequilibrium where the glacier will melt away. And two that I have measured mass balance on have.
    0 0
  26. Everyone on this thread should know that mspelto is a researcher on glaciers. I appreciate his comments as they are more informed than what the rest of us can come up with. Thanks mspelto for your help. I was amazed at your web site on ice worms, I had thought they were fictional.
    0 0
  27. mspelto, although it may sound ovious, I wish to thank you for you invaluable contributions. There's a sentence in the conclusions of you paper that I, not being a glaciologist, could not fully understand: "The correlation coefficient in annual balance between each glacier exceeds 0.80, regardless of the extent of accumulation zone thinning, indicating annual balance alone cannot be use." My trivial picture would say that accumulation zone thinnig alone could be enough to point not just to disequilibrium but to the non-survival of a glacier. What I think I'm missing is some physical mechanism of glacier dynamics that justify the use of more sophisticated parameters. I would be gratefull if you could elaborate a bit on this.
    0 0
  28. 24.Riccardo But if we take glacier melting as a signal of global warming then we have to say that temperature in 1945-1955 were similar to 1995-2005. I think some people struggle with accepting that. 25.mspelto The UNEP/WGMS report does show the mass balance changes were similar in 1945-1955 as 1995-2005 (Fig 5.1). This is with regard to "30 reference glaciers" which I imagine represent good spatial coverage and records. Their "all glacier" record appears to show tha same result although it doesn't extend quite as far back. Fig5.9 tells me that records began Europe - late 19th century. North America - ~1900 but major ramp up ~1945. Arctic - ~1935 Asia/South America - ~1960's New Zealand - 1980's Antarctica/Africa - erm, take your pick Actually looking at this then maybe the idea that the WGMS data as a true global record has to be qualified. mspelto if you have time could you comment on the WGMS data? And maybe let us know which data Cogley has access to that the WGMS doesn't have? 26.michael sweet Expertise is a good thing. Mselto seems to rate Cogley The United Nations Environment Programme seem to rate The World Glacier Monitoring Service Both seem to have importantly different stories to tell about glacier mass balance in the mid 20th century. Which should I go with?
    0 0
  29. Riccardo you are correct that just substantial accumulation zone thinning is enough to forecast glacier survival. You want a more sophisticated measure. However, the goal is a simple measure that can be easily applied to all glaciers simply with decent repeat satellite images, or a map and a satellite image. If we make it to sophisticated such as a ratio of thinning to changes in velocity in the accumulation zone we make it difficult to apply. HR good question about the UNEP graph. The WGMS 30 reference glaciers goes back to 1980. Reference network. If they move the start date to 1985 they will be able to expand to up to 45. If they move the start date for the group back to 1946 they will only have 2 to choose from. Only one Storglaciaren in Sweden is in the reference group. In 1949 Sarennes Glacier, France and Storbreen, Norway are added. Thus, the WGMS record for the 1945-1955 period relies on only a couple of glacier and is not useful for a global summary. The graph UNEP has reports only the Storglaciaren data at first, look at Mass Balance Bulletin 10 page 13 for that glaciers graph and compare. Look at page 1-4 for the list of glaciers and years examined, some of the records are not complete from the first to the last year. This is our best mass balance data. There are other glaciers like the Taku Glacier in Alaska where mass balance work began in 1946 that is not part of the WGMS reference glacier system. This is because before this record publishing this record in 1990 I waited for satellite verification of its accuracy. In the section of BAMS state of the Climate 2009-for glacier mass balance-which I authored-we were asked to provide the mass balance data records for previous data periods. Note the WGMS actual reported record, which is absolutely the best, but it only goes back to 1980. WGMS. Before that Cogley who first contacted me about the global glacier mass balance record more than a decade ago, has the best. He has used Geodetic data not just directly measured data. This is data based on volume change determined from repeat mapping, usually via photographs. This work typically does not provide an annual measurement, as annual photographs tend to be rare. It does provide an accurate record for longer time intervals. If you look at Cogley's 2009 Figure 2 you will note that until 1930 and the advent of aerial photography the record is scant. The mass balance record from 1850-1950 will be improved, but Cogley for now has provided the best analysis. There are many more glaciers that we can and will add to a longer term glacier mass balance record since 1950 using geodetic assessment. Think of comparing a glacier today in a satellite image with excellent mapping details to its original mapped state such as for Bear Glacier or Grasshopper Glacier. Is does match the results of Oerlemans (1999) also. That record based on terminus changes is also useful.
    0 0

You need to be logged in to post a comment. Login via the left margin or if you're new, register here.


The Consensus Project Website

THE ESCALATOR

(free to republish)


© Copyright 2024 John Cook
Home | Translations | About Us | Privacy | Contact Us