Climate Science Glossary

Term Lookup

Enter a term in the search box to find its definition.

Settings

Use the controls in the far right panel to increase or decrease the number of terms automatically displayed (or to completely turn that feature off).

Term Lookup

Settings


All IPCC definitions taken from Climate Change 2007: The Physical Science Basis. Working Group I Contribution to the Fourth Assessment Report of the Intergovernmental Panel on Climate Change, Annex I, Glossary, pp. 941-954. Cambridge University Press.

Home Arguments Software Resources Comments The Consensus Project Translations About Support

Twitter Facebook YouTube Mastodon MeWe

RSS Posts RSS Comments Email Subscribe


Climate's changed before
It's the sun
It's not bad
There is no consensus
It's cooling
Models are unreliable
Temp record is unreliable
Animals and plants can adapt
It hasn't warmed since 1998
Antarctica is gaining ice
View All Arguments...


Username
Password
New? Register here
Forgot your password?

Latest Posts

Archives

What does past climate change tell us about global warming?

What the science says...

Select a level... Basic Intermediate

Greenhouse gasses, principally CO2, have controlled most ancient climate changes. This time around humans are the cause, mainly by our CO2 emissions.

Climate Myth...

Climate's changed before

Climate is always changing. We have had ice ages and warmer periods when alligators were found in Spitzbergen. Ice ages have occurred in a hundred thousand year cycle for the last 700 thousand years, and there have been previous periods that appear to have been warmer than the present despite CO2 levels being lower than they are now. More recently, we have had the medieval warm period and the little ice age. (Richard Lindzen)

At a glance

Just imagine for a moment. You fancy having a picnic tomorrow, or you're a farmer needing a dry day to harvest a ripe crop. So naturally, you tune in for a weather-forecast. But what you get is:

“Here is the weather forecast. There will be weather today and tomorrow. Good morning.”

That's a fat lot of use, isn't it? The same applies to, “the climate's changed before”. It's a useless statement. Why? Because it omits details. It doesn't tell you what happened.

Climate has indeed changed in the past with various impacts depending on the speed and type of that change. Such results have included everything from slow changes to ecosystems over millions of years - through to sudden mass-extinctions. Rapid climate change, of the type we're causing through our enormous carbon dioxide emissions, falls into the very dangerous camp. That's because the faster the change, the harder it is for nature to cope. We are part of nature so if it goes down, it takes us with it.

So anyone who dismissively tells you, “the climate has always changed”, either does not know what they are talking about or they are deliberately trying to mislead you.

Please use this form to provide feedback about this new "At a glance" section. Read a more technical version below or dig deeper via the tabs above!


Further Details

Past changes in climate, for which hard evidence is preserved throughout the geological record, have had a number of drivers usually acting in combination. Plate tectonics and volcanism, perturbations in Earth's slow carbon cycle and cyclic changes in Earth's orbit have all played their part. The orbital changes, described by the Milankovitch Cycles, are sufficient to initiate the flips from glacials (when ice-sheets spread over much of Northern Europe and the North American continent) to interglacials (conditions like the past few thousand years) and back  – but only with assistance from other climate feedbacks.

The key driver that forces the climate from Hothouse to Icehouse and back is instead the slow carbon cycle. The slow carbon cycle can be regarded as Earth's thermostat. It involves the movement of carbon between vast geological reservoirs and Earth's atmosphere. Reservoirs include the fossil fuels (coal/oil/gas) and limestone (made up of calcium carbonate). They can store the carbon safely over tens of millions of years or more. But such storage systems can be disturbed.

Carbon can be released from such geological reservoirs by a variety of processes. If rocks are uplifted to form mountain ranges, erosion occurs and the rocks are broken down. Metamorphism – changes inflicted on rocks due to high temperatures and pressures – causes some minerals to chemically break down. New minerals are formed but the carbon may be released. Plate tectonic movements are also associated with volcanism that releases carbon from deep inside Earth's mantle. Today it is estimated by the U.S. Geological Survey that the world's volcanoes release between 180 and 440 million tonnes of carbon dioxide per year - as opposed to the ~35 billion tonnes we release.

Epic carbon releases in the geological past

An extreme carbon-releasing mechanism can occur when magma invades a sedimentary basin containing extensive deposits of fossil fuels. Fortunately, this is an infrequent phenomenon. But it has nevertheless happened at times, including an episode 250 million years ago at the end of the Permian Period. In what is now known as Siberia, a vast volcanic plumbing-system became established, within a large sedimentary basin. Strata spanning hundreds of millions of years filled that basin, including many large coal, oil, gas and salt deposits. The copious rising magma encountered these deposits and quite literally cooked them (fig. 1).

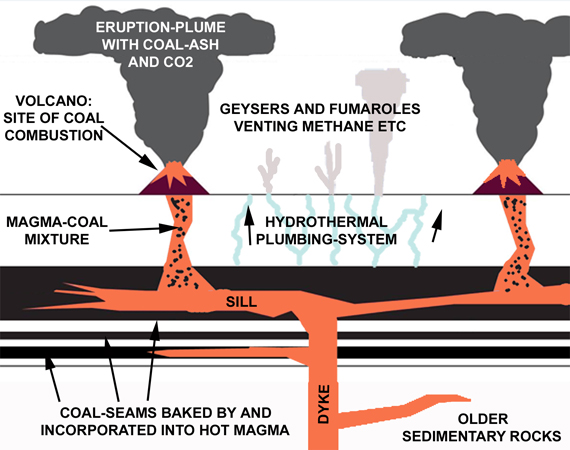
Fig. 1: schematic cross section though just a part of the Siberian Traps Large Igneous Province, showing what science has determined was going on back then, at the end of the Permian Period.

Now laden with a heavy payload of gases, boiled out of the fossil fuel deposits, some of the magma carried on up to the surface to be erupted on a massive scale. The eruptions – volcanism on a scale Mankind has never witnessed - produced lavas that cover an area hundreds of kilometres across. Known as the Siberian Traps, because of the distinctive stepped landforms produced by the multiple flows, it has been calculated that the eruptions produced at least three million cubic kilometres of volcanic products. Just for a moment think of Mount St Helens and its cataclysmic May 1980 eruption, captured on film. How many cubic kilometres with that one? Less than ten.

Recently, geologists working in this part of Siberia have found and documented numerous masses of part-combusted coal entrapped in the lavas (Elkins-Tanton et al. 2020; fig. 2). In the same district are abundant mineral deposits formed in large pipes of shattered rock as the boiling waters and gases were driven upwards by the heat from the magma.

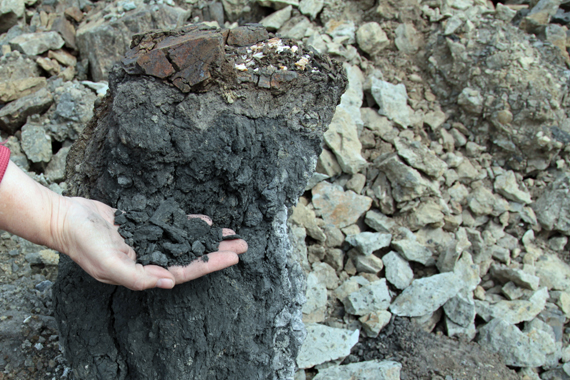
Fig. 2: an end-Permian smoking gun? One of countless masses of part-combusted coal enclosed by basalt of the Siberian Traps. Photo: Scott Simper, courtesy of Lindy Elkins-Tanton.

It has been calculated that as a consequence of the Siberian Traps eruptions, between ten trillion and one hundred trillion tons of carbon dioxide were released to the atmosphere over just a few tens of thousands of years. The estimated CO2 emission-rate ranges between 500 and 5000 billion tonnes per century. Pollution from the Siberian Traps eruptions caused rapid global warming and the greatest mass-extinction in the fossil record (Burgess et al, 2017). There are multiple lines of hard geological evidence to support that statement.

We simply break into those ancient carbon reservoirs via opencast or underground mines and oil/gas wells. Through such infrastructure, the ancient carbon is extracted and burned. At what rate? Our current carbon dioxide emissions are not dissimilar to the estimated range for the Siberian Traps eruptions, at more than 3,000 billion tons per century. The warning could not be more clear. Those telling you the climate's changed before are omitting the critical bit – the details. And when you look at the details, it's not always a pretty sight.

Last updated on 14 February 2023 by John Mason. View Archives

Printable Version  |  Offline PDF Version  |  Link to this page

Argument Feedback

Please use this form to let us know about suggested updates to this rebuttal.

Related Arguments

Myth Deconstruction

Related resource: Myth Deconstruction as animated GIF

MD Past

Please check the related blog post for background information about this graphics resource.

Further reading

RealClimate article published by Prof. Stefan Rahmstorf on July 20, 2017:

The climate has always changed. What do you conclude?

Comments

Prev  1  2  3  4  5  6  7  8  9  10  11  12  13  14  15  16  17  Next

Comments 126 to 150 out of 415:

  1. Svettypoo @119, I'll try again - Atmospheric CO2 concentrations during ancient greenhouse climates were similar to those predicted for A.D. 2100
  2. Svettypoo at 10:04 AM on 29 August, 2010 I’m not sure where your chart originates, but the temperature schematic is from Scotese, from around ten years ago. It is disheartening to see this schematic repeatedly being wheeled out on skeptical websites and venerated like the bones of some long dead saint, despite more than a decade of painstaking research since which makes it quite obsolete. It is a schematic only, meant to show very approximate periods of relative warmth and cold. The composite d18O proxy data used to estimate paleo-temperature variations, which has been gathered over many years is far more complex. I have charts if anyone is interested. Anyway, keeping it simple, the most recent chart showing Phanerozoic temperature variations estimated from updated d18O records compared with those which would result from (updated) paleo-CO2 data I have seen is from Royer 2009. 
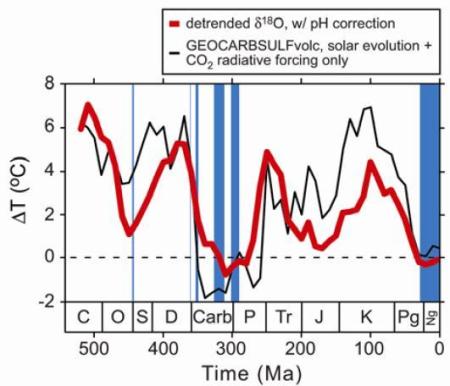
This includes recently revised (2009) paleosol CO2 estimates from Breecker 2010 but we must remember it is a compressed overview (each pixel is bigger than our entire ice core record). Over recent years, we have been able to address many gaps, uncertainties and lack of detail in our knowledge of paleo-CO2 data, from the Neogene to the Ordovician. Though much work is still to be done, as each new piece in the jigsaw is added, the link between carbon cycle and climate is strengthened. For those interested in more detail I have tried to find some free links to some good recent work, see: Seki 2010 (and see Seki 2010 supplementary data), Young 2010, Tripati 2009 (and see Tripati 2009 supplementary data). Incidentally, for some longer term solar irradiance proxy data (9300 years) try Steinhilber 2009, and on the NOAA paleo website there are much longer reconstructions based on the 10Be records from ice cores, though these should also be interpreted with a little care.
  3. Lung cancer existed before cigarettes were invented too. Does that fact invalidate cigarette induced lung cancer?
  4. bobconsole, actually many of the 'think tanks' (i.e. propaganda units) disputing global warming also insisted that cigarettes do NOT cause lung cancer. Go figure.
  5. Thanks for the post Peter. To say the least, Scotese chart shows the lack of correlation between low CO2 troughs and glaciation periods and CO2 crests inter-glaciation periods. It is meant to represent averages through different periods. The chart you found in Royer's 2009 paaper is actually from 2004. Its referenced right on the paper. So its not too long after Scotese. She doesn't show CO2 and Solar variation separately on the graph, just combined as radiative forcing. Also, on a side note, please see this response to Royer's temperature sensitivity assumptions. Detailed Response to Royer et al.’s letter “CO2 as a primary driver of Phanerozoic Climate” Here is a more detailed (than Scotese) temperature reconstruction from Veizer, and CO2 reconstruction from Antarctic ice cores, Pagani and geocarb. Solar variation is left out to show CO2-temperature correlation only. I hope to post raw data for everyone when I find some time. And I'll try to respond to the other comments later tonight.
  6. svettypoo at 11:57 AM on 1 September, 2010 Thanks. I am aware of the correspondance between Vezier and Royer, and there is a chain that goes beyond your reference. The temperature data from Royer 2009 is indeed from work in 2004, and Vezier acknowledges that to correct for pH (as Royer did) is valid. The Vezier T curve looks similar (as the d18O raw data will not be very different). However the CO2 data from Royer 2009 is very up to date (late 2009 corrections, please have a look at the references), most of the CO2 data you show (the output of model, GeoCarb) is not. We have proxy data from much recent work, and some of this is summarised in Royer 2009 and the later GeoCarbsulf(volc) model output). You should also read more widely on this, Pagani, Retallack, Zachos and Zeebe spring to mind, but then look at the recent references I linked above. On sea level, I will have to look at Schutter again, but there is the small matter of completely different continental configurations over this period...
  7. You know how everyone is talking about if climate change is natural or man made, in both cases (or even in the combination of both) don't we need to adapt? Because isn't that what our ancestors (most of them) did when the climate changed?
    Response: See the Argument "It's Not Bad."
  8. "Using ice cores, for instance, we can work out the degree of past temperature change, the level of solar activity, and the amount of greenhouse gases and volcanic dust in the atmosphere." Ice-cores are worthless, since CO2 sublimates above -70C, and thus esapes to newer parts of the ice; and there's NO place on Earth where temps remain below -70C, and so ice can't provide a reliable record since it simply escapes upward whenever the temperature's above this, giving the false impression of an increasign carbon-levels in the atmosphere.
  9. The CO2 is in a solid state? Can't be found unless it's solidified? Have you looked in a mirror recently, Captain Skywalker? Noticed any snow coming out of your nostrils?
  10. KirkSkywalker - It's not CO2 ice, it's CO2 gas trapped as bubbles in water ice; a physical sequestration (think ice gas tanks). There is some movement while additional snow/ice packs on top, which depending on the ice core is why a single layer is a running average of perhaps several decades - but sublimation isn't an issue.
  11. What an enormous pity that this level of debate is not centre stage. One would think that given the urgency of the matter it would be possible to get a permaneant link printed on all newspaper title boxes directing those interested in the topic to this site. I have been interested in global warming for many years, yet have only happened on this site today by pure fluke. Please keep up the good work.
  12. KirkSkywalker, to expand on the comments by KR and doug... you have essentially shown that CO2 cannot be a solid at the temperatures found in ice cores. Instead, it must be a gas. Of course... that is exactly what studies of ice core samples have stated all along. That they are examining the amount of CO2 gas found in air bubbles. Since those air bubbles date back to when the ice was formed this allows us to determine the CO2 content of the atmosphere at various points in the past. The website you reference in another post and its argument which you repeat here make no sense whatsoever. Indeed, if the CO2 were in solid form it would be much more difficult to isolate it and determine past atmospheric concentrations. Even making such an argument shows a complete lack of understanding of the underlying science.
  13. I have one simple question that I hope someone can asnwer. In that film 'The great global warming hoax' I think that is the name of it. Def something like that, it said that the huge graph which Al Gore used to demonstrate the history of warming on our planet (by showing the direct corellation between CO2 and warming), failed to tell us that on closer inspection, the temperature rose first and then the CO2 because the ocean was releasing the CO2 as it warmed and not the other way round. Is this true or false?
  14. @flanerz: check out the response to the CO2 Lags Temperatures argument.
  15. Re: flanerz (138) In addition to archiesteel's nice link at 139, please see "What does CO2 lagging temperature mean?" for a good explanation of what Gore said in his movie and what it means. RealClimate does a nice deconstruction of Gore's An Inconvenient Truth here, where they talk about what he got right with the science and what he got wrong. One of the more knowledgable commenters at RealClimate, Patrick 027, offers up a dissection of forcings, ice ages and milankovitch cycles here. I have not seen the film you name in your comment, so I couldn't characterize what they said that Gore said (he said, she said revisited). Hope that helps, The Yooper
  16. Sorry, this is a repeat of a post today, which I should have included with this topic, but placed under stratospheric cooling. My first blog--I haven't found such an interesting site before. I have reviewed some old posts and found one under "climate's changed before" with a question that I have also wondered, from jebjones42. It did not seem to have been addressed in any subsequent posts. "I'm curious. Do we know what caused the reversal in past warm periods in the Earth's history? What made it get cool again? Clearly, despite CO2 having a positive feedback loop, we didn't get runaway warming. We're not living on Venus. Even if we're headed for higher temps, rising sea levels, drought, mass extinctions, catastrophic loss of human life, etc. At some point won't it top out an head back to another ice age? What's prevented a runaway greenhouse effect in the past?" I am also interested in this question. Is it sun cycles and precession/sun obliquity, and is the prevailing thought that we will overwhelm these historical cyclical temp. changes ?
  17. Re: reluctant skeptic (141) I've posted the answers to your questions over here where I first saw them. To make things easier, when you have questions, please use the search feature in the upper left portion of any page here. This will give you a narrowed choice of where to post your question. Just pick the one that seems most appropriate & post it there. If multiple questions, follow this procedure for each. It'll get easier the more you do it. The Yooper
  18. Try this page . Some good stuff to start you off and some links that might help.
    Response: Indeed, that is probably the best place for any further discussion of positive feedbacks and "runaway" warming.
  19. To look at the chart below and claim we are a primary driver of climate is nonsense. The next time the climate turns cooler - are we supposed to retool again to produce massive emissions of CO2? http://jonova.s3.amazonaws.com/graphs/lappi/gisp-last-10000-new.png
  20. Re: averageguy (144) Welcome to Skeptical Science, wherein we debunk crap climate science, on both sides of the aisle. If you have an open mind and are here to learn (why else would you be here?), then Enter! This Door is always open. One thing I draw from your linked graphic is that it is from Alley's Central Greenland core. Thus, a timeline for a singular or regional location. It is considered an apples-to-oranges (i.e., "cherry picking") comparison to conflate localized data into global. The next thing to understand is that temperature variations over time from cores run the gamut over hundreds of millennia; it is rather unwise to focus on such a small window of time as presented in your graphic. Here's a bigger snapshot of time, showing the coupled relationship between temperatures and CO2 over the ice core record periods. You'll see that there are ample times one could focus on that would be markedly different from others: Returning now to the time period covered by your Alley graphic, look at this graphic showing the "sweet spot" of temperatures that has allowed mankind to develop a stable civilization (well, fairly stable): The interesting thing about the CO2/temperature record from ice cores (usually referred to as the paleo record) is that (as you refer to) natural variations, which are well-understood, were the dominant factor in climate change. However, the thing differing today is the massive slug of CO2 mankind has re-introduced into the carbon cycle. As a non-condensible GHG, CO2 is the Control Knob of Temperatures, capable of acting as feedback and forcing. In modern times, this means CO2 is driving temperatures up (with about a 40-year lag due to the thermal inertia of the oceans): We've pretty much eviscerated any chance of returning to glacial conditions for millennia. Indeed, there's these quotes from Dr Toby Tyrrell of the University of Southampton's School of Ocean and Earth Science at the National Oceanography Centre, Southampton, appearing in Science Daily:
    "Our research shows why atmospheric CO2 will not return to pre-industrial levels after we stop burning fossil fuels. It shows that it if we use up all known fossil fuels it doesn't matter at what rate we burn them. The result would be the same if we burned them at present rates or at more moderate rates; we would still get the same eventual ice-age-prevention result."
    and
    "Burning all recoverable fossil fuels could lead to avoidance of the next five ice ages."
    The Yooper
  21. New NASA computer model shows plants slow warming by 0.3C-0.6C when CO2 is doubled against the predicted 1.94C globally. No mention of atmospheric sulfur (a source of particulates which help form rain) having declined from a peak in 1970 to 100-year lows in 2000. Don't you love it when they use data that stops 10 years ago in a current article? Far too much data is left out of models to assure accuracy, IMHO. Worse still, there is no mention of missing/incomplete data, only mention of major consensus. -T . http://www.nasa.gov/topics/earth/features/cooling-plant-growth.html 'Greener' Climate Prediction Shows Plants Slow Warming A new NASA computer modeling effort has found that additional growth of plants and trees in a world with doubled atmospheric carbon dioxide levels would create a new negative feedback – a cooling effect – in the Earth's climate system that could work to reduce future global warming. The cooling effect would be -0.3 degrees Celsius (C) (-0.5 Fahrenheit (F)) globally and -0.6 degrees C (-1.1 F) over land, compared to simulations where the feedback was not included, said Lahouari Bounoua, of Goddard Space Flight Center, Greenbelt, Md. Bounoua is lead author on a paper detailing the results that will be published Dec. 7 in the journal Geophysical Research Letters. Without the negative feedback included, the model found a warming of 1.94 degrees C globally when carbon dioxide was doubled. Bounoua stressed that while the model's results showed a negative feedback, it is not a strong enough response to alter the global warming trend that is expected. In fact, the present work is an example of how, over time, scientists will create more sophisticated models that will chip away at the uncertainty range of climate change and allow more accurate projections of future climate. "This feedback slows but does not alleviate the projected warming," Bounoua said.
  22. Re: tobyw (146) There has been some discussion of the Bounoua et al study on another thread, specifically comments 15-24 located here. But thanks for the heads-up! The Yooper
  23. @tobyw: interesting study, but right now we haven't seen any increase in vegetation due to additional CO2 in the atmosphere (so far, it's been the opposite), so I'm a bit skeptical about this expected negative feedback.
  24. Hasn't climate also changed, (warming) on other planets and moons at the same time as the earth? Plenty of studies seem to show that to be true. AGW believers then search for any reason they can find to say "yes, but it's happening at the same time for different reasons"... what a coincidence!
    Response: [Daniel Bailey] Then you should have no difficulty providing links to those peer-reviewed studies then. We're waiting... And respond on the more appropriate thread "Mars is warming," after reading that post.
  25. Please refer to argument #31. Then refer to argument #1 because "other planets are warming" is just an indirect way of saying "it's the sun".

Prev  1  2  3  4  5  6  7  8  9  10  11  12  13  14  15  16  17  Next

Post a Comment

Political, off-topic or ad hominem comments will be deleted. Comments Policy...

You need to be logged in to post a comment. Login via the left margin or if you're new, register here.

Link to this page


The Consensus Project Website

THE ESCALATOR

(free to republish)


© Copyright 2024 John Cook
Home | Translations | About Us | Privacy | Contact Us