


 Arguments


Claims that climate models overestimate warming are 'unfounded', study shows
Posted on 5 February 2015 by Guest Author
This is a re-post from Roz Pidcock at Carbon Brief
A new paper takes an in-depth look at the suggestion that climate models routinely overestimate the speed at which Earth's surface is warming - and finds the argument lacking.
A look back over the past century shows that, by and large, what we see in global average temperature is extremely well captured by models, the authors tell Carbon Brief.
The new research, a collaboration between scientists at the Max Planck Institute in Germany and the University of Leeds, is published today in the journal Nature.
Recent trends
Climate scientists study how Earth's temperature changes over several decades. They also seek to understand how natural fluctuations influence the picture over shorter time periods.
The past 15 years has received a fair bit of attention. It's notable that 14 of those years topped the charts as the warmest on record. But the difference between individual years has been slight, meaning the earth's surface has risen a fair bit slower than in previous decades.
Most climate models haven't captured this slower rate of warming. Instead, they show continued warming, arriving at global temperatures that are above what we're seeing now.
Prof Tim Osborn, a climate scientist at the University of East Anglia, tells Carbon Brief even the news that 2014 was probably the hottest year on record doesn't change the picture much:
"Despite being very warm, 2014 still leaves the observed warming in the lower part of the range of climate model simulations."
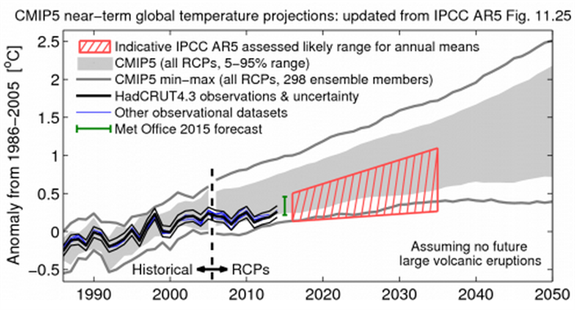
Surface temperature from HadCRUT4 (black line) tracks the lower edge of the 5-95% range of climate model projections (grey shading). Projections are relative to 1986-2005. Updated to include temperature data for 2014. Source: Ed Hawkins, Climate Lab Book
A discrepancy
The discrepancy between observed and model trends recently has led some to suggest models could be at fault, the authors explain in a summary accompanying the paper:
"Some have speculated that this difference occurs because climate models respond too sensitively to greenhouse gas increases, and thus overestimate climate change."
This turns out not to be the case, as the paper explains. But first, it's worth remembering that we're talking here about surface temperature, not the globe as a whole, lead author Prof Jochem Marotzke from the Max Planck Institute for Meteorology in Germany. He tells us:
"[Surface temperature is] the temperature of a very thin layer of the climate system. Anthropogenic climate change has continued, it's just not so visible in the surface ... It's clearly visible if you look at the heat stored in the ocean, which has kept going during these 15 years. So climate change is continuing, even though surface warming has slowed down quite a bit."
A close comparison
Choosing a 15-year period over which to examine surface temperatures is arbitrary. You can get almost any trend depending on which year you choose as the starting point.
That's why it's important to look at other 15-year periods in Earth's temperature record to see whether or not the most recent one is unusual, the new paper explains.
The authors looked at every possible 15-year period since the beginning of the 20th century. The first spans the period 1900-1914, the next one 1901-1915 and so on, right up to 2012.
The paper uses surface temperature data from the HadCRUT4 record, jointly produced by the UK Met Office and the Climatic Research Unit at the University of East Anglia (UEA).
For each 15-year period, the authors compared the temperature change we've seen in the real world with what the climate models suggest should have happened.
A good match
Over the 112-year record, the authors find no obvious pattern in whether real-world temperature trends are closer to the upper end of what model project, or the lower end.
In other words, while the models aren't capable of capturing all the "wiggles" along the path of rising temperatures, they are slightly too cool just as often as they're slightly too warm.
The paper gives some examples. For the 15-year period starting in 1927, surface temperature is lower in 110 of the 114 model simulations (brown bars in the left graph below) than in the real-world (black line).
The opposite is true for the period starting in 1998, however. All 114 model simulations overestimate the warming we've actually experienced (middle graph).
Taking all 15-year time periods together, the average observed trend since 1900 is 0.086 degrees Celsius per decade. This is almost exactly in line with the model average of 0.088 degrees per decade. You can see the overlap in the right-hand graph below.
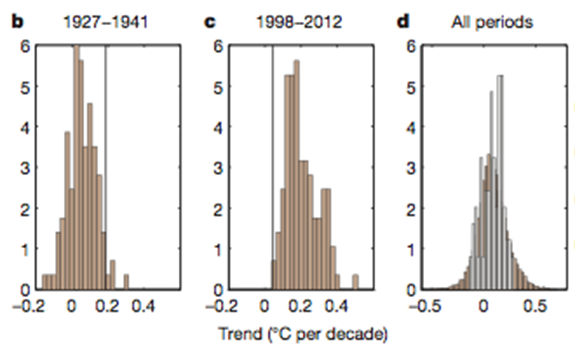
Comparing model-simulated (brown bars) and observed global surface temperature (vertical black line) for the 15-year periods covering 1927-1941 (left) and 1998-2012 (middle), and for all 15-year periods between 1900 and 2012 (right). Source: Marotzke and Forster (2015)
Natural fluctuations
So what causes real-world temperatures to diverge from the models over periods as short as 15 years? That's down to natural fluctuations that temporarily boost or dampen the speed of warming, such as the global weather phenomenon known as El Niño, the paper notes.
Such short-term ups and downs are known as internal variability, and they happen partly at random. That means, at any given time, it is largely down to chance as to whether real-world temperatures are higher or lower than models suggest.
The authors don't rule out a minor contribution from some models underestimating cooling from volcanic eruptions. In the past 15 years, the difference between modelled and observed trends has also likely been amplified by unusually rapid uptake of heat by the oceans.
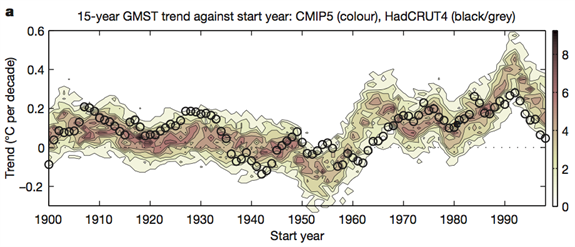
Comparing model simulated and observed 15-year trends of global average surface temperature since 1900, plotted by starting year. Colour shading shows how often a trend occurs. Black circles are HadCRUT4 data. Source: Marotzke and Forster (2015)
Unfounded criticism
Overall, the authors conclude there is no in-built bias in the models over the past 15 years, or any other 15-year period. The paper says:
"The claim that climate models systematically overestimate the response to radiative forcing from increasing greenhouse concentrations therefore seems to be unfounded."
A recent paper by climate skeptic politician Viscount Christopher Monckton claimed scientists' model-based projections of climate change are overstated. But Prof Piers Forster, climate scientist at Leeds University and co-author on the new paper, tells Carbon Brief:
"Our paper completely refutes this. We find no evidence that models are too responsive. In fact, we find the model range is an excellent predictor of observed trends and their uncertainty due to random chaotic processes in the atmosphere and ocean."
While it might be tempting for some to focus on what's occurred recently, today's research shows why taking the long view is important when it comes to assessing how well models are performing. Doing so shows no evidence that models are predisposed to higher or lower temperatures than we're seeing in the real world.
Marotzke, J. and Forster, P. (2015) Forcing, feedback and internal variability in global temperature trends. Nature http://dx.doi.org/10.1038/nature14117


In the long view, paleoclimate work presented in the AGU14 for the Miocene suggests sensitivities at the upper end of the IPCC range. In other words, the bahavior of Earth's climate in the past does not support the idea that model-based projections are overstated. If anything they suggest the opposite. There should hopefully be a post on this coming out in a few days.
This may or may not have been hasty.
I see that there is some information on climateaudit that the statistical methods used are flawed. I do not have the background to double check that. I hope the authors can check it out and act appropriately.... quickly.
[JH] Your comment appears to be a thinly-disguised attempt to castr a shadow on the information presented in the OP. If so, please cease and desist playing such a game on this website.
Upon further review, this comment is retracted.
I have just endured forty-two minutes and twenty-two seconds of the good Lord spouting forth about his new paper. He gets up to all his usual tricks, such as wearing several layers of clothing while indoors because it is cold outside and therefore global warming is all a hoax. Anyone with the stomache to watch it can find it here: https://www.youtube.com/watch?v=fE7r0gk5nmw (USA Watchdog channel).
He closes with the assertion that if his paper is found to be correct, it will settle the whole issue of whether climate change is real or not. I would like to suggest that the converse is also true. If his paper is found to be incorrect, then by the same token he should accept that such an eventuality proves that it is real and that he should just shut up about the issue. I am not holding my breath! Experience says that no matter how many papers there are like this OP, he will not change his stance. Though there are signs of desperation. He seems to be linking climate change to a socialist/communist conspiracy.
[JH] For future reference, we discourage commenters from providing direct links to propaganda pieces produced by Monckton and his ilk.
Warning: Watching a video like the one linked to above can be injurous to your mental health and well-being.
I don’t think that self-defining “skeptics” will be disturbed by this study, which indeed is very interesting.
I suppose they cannot be disturbed by any facts and arguments because imho try to convince these type of thinkers that AGW is a real and dangerous phenomenon using climate science is like to convince pious hindus that cow is not an holy creature with evolutionist biology knowledge.
Anyhow I have a small question looking at the last graph ("15-years GMST trend..."):
we can argue that positive Y-axis data on black circles for long period show directly a warming effect (from 1900 to 1935 roughly and from 1965 to now)?
And also that the patterns for show period going up and down (the longest up from about 1960 to 1985 , the longest down from approx. 1925 to 1940) of the circles in the chain indicates an acceleration (up) or deceleration (down) of the general warming rate (i.e shows in other way the variability)?
fungelstrumpet @3:
That has been Monckton's line for at least five years now. Indeed, if anything it represents a toning down of the rhetoric. In his 2009 blurb for Ian Wishart's propaganda piece, Air Con (very well self named), he wrote:
So whereas Monckton formerly described all of us as both (and simultaneiously) communists and fascists, he he toned down to calling us communists and totalitarians. (Don't tell Riddley. I'm sure he would have a fainting fit to think that such abusive language would be used in the climate debate. He also would be forced by his logic to concede that AGW is both real and dangerous.)
I will note as an aside that the way in which large numbers of quite influential members of the anti-climate science brigade take a known conspiracy theorist, and demagogue like Monckton seriously damns their cause far beyond anything I could manage. If they cannot determine that Monckton's thinking is, quite frankly, nuts; and act accordingly, but rather provide a ready conduit for any rubbish he puts out, they have shown themselves completely incapable of critical thinking on the topic.
Honestly, I'd be interested in seeing some comment on the claims of flawed statistical methods coming from denier blogs from someone who knows the topic. Not looking to cast any shadows, but those blogs have influence with people and I wonder if ignoring them is always the best way to go.
[JH] Rest assured that members of the SkS comment team and our regular readers monitor what is being posted on the more prominent websites of Deniersville. When a formal rebuttal is needed, we will do so either by updating an existing, or by posting a new SkS article. In many cases, our reuglar readers (e.g. Tom Curtis. KR, MA Rodger, etc. ) will thoroughly debunk a denier analysis in the comment threads of this website. In other cases, we may reprint a critique originated by another pro-science website such as Tamino's Open Mind.
I'm surprised there wasn't more about volcanic activity here. Surely, a major volcanic eruption (or many minor ones) could temporarily knock global tempuratures outside of the range of model projections. But that wouldn't invalidate the models.
Has there been enough volcanic activity recently for this to be part of the slower rise in the last fifteen years? I would think that some of the slowing in the rate of heating has to do with the human made 'volcano' of aerosols especially from China's rapid industrial expansion.
If the 'missing heat' really all is going into the oceans, shouldn't we have expected a pronounced increase in the rate of sea level rise just from thermal expansion. IIRC, that has not been the case in the last ten years. Or does heating the deep ocean not create as much thermal expansion because of the pressure?
Thanks ahead of time for any help from any direction (except, of course, from denialists) on any of these points.
@wili:
Actually, the past several decades have indicated sea level rise is substantially faster than the prior 20-30 years. A single decade is difficult to parse out of the data for a longer-term trend, but as I recall, sea levels are going up closer to 3.5mm/yr vs ~2.5mm/yr as the longer-term (early) 20th century trend.
However, overall rise is a combination of land-ice losses and thermal expansion, so overall sea level increases cannot be naively attributed to only ocean warming.
There is no 'deep sea pressure' mechanism that limits thermal expansion due to temperature rises I am aware of; I'd have to look up in a CRC handbook or something to see if there is any substantial variation in the coefficient of thermal expansion for water vs. pressure which might imply 'deep water' warming would have a lower or higher rate of expansion with heating. Nonetheless, any warming increases ocean volume.
That said, one concern I have not seen addressed/discussed is the land-ice losses and sea-ice losses relative to their absorbed heat-of-fusion; once this ice is gone, that reservoir for absorbing heat and limiting warming simply disappears - has anyone calculated how much faster warming might be once a significant portion of this ice warms through that transition temperature? The ratio of ice heat absorption to water warming is (I think) 80 cal/g-degree C; that means the energy to heat up a gram of water 80 degrees is the same as it takes to melt just 1 g of ice into water (or, the same amount of heat will warm the same mass of water 80x more). Once those ice 'heat absorbing' reservoirs are gone, the basic physics demands that overall warming w/o that phase transition will go somewhat faster. It could be an insignificantly small increment, but I have not seen that calculation/estimation.
Sir Harry, a professional statistician who has published climate science peer reviewed papers goes by the name Tamino on his blog, which is outstanding.
Thanks for the insights, Cooper. I do certainly know that thermal expansion isn't the only contributor to slr, but so far it is the largest single contributor (vs glacier melt, GIS, Antarctica and changes in terrestrial storage). I suppose increased evaporation rates and total humidity in the atmosphere (which is increasing) has to be figured in, too--over the long term, but also as a factor in year-to-year varability.
But I still would have thought that, if more heat has been going into the oceans in the last 15 years than previously, there would be some notable increase in the rate of slr over the same period. I can't imagine that ice sheet loss has been decelerating over the same period in a way that would mask the thermal expansion.
"the land-ice losses and sea-ice losses relative to their absorbed heat-of-fusion; once this ice is gone, that reservoir for absorbing heat and limiting warming simply disappears"
I think this is an important point, and I'm sure someone has figured out exactly (or at least approximately) how much energy has been going in to melting all that ice. It makes me wonder just how fast the Arctic Ocean will heat up once it's (mostly) free of ice and recieving solar radiation 24/7 for weeks.
Cooper & Wili:
I don’t know how deep sea pressure impacts (possibly limits) thermal expansion, but the temperature certainly does. Some time ago I made this graph showing how 1oC of warming causes more and more expansion as the initial temperature of water rises.
Note how the rate of expansion increases 3-fold from 0oC to 10oC and more than 5-fold from 0oC to 25oC. It’s also worth noting that the heat capacity of water is close to 4.2 J/g/K all the way from 0oC and 100oC, so the energy it takes to heat a certain amount of water by 1oC doesn’t change much with temperature.
I have a need for an answer to the attack on the paper from climateaudit.
That relies on SOMEONE someone taking up some defense of the paper from this particular attack and I note that they also attack the peer-review process at Nature. I do not think that ignoring this is going to help.
In calling attention to that attack I *have* to consider that it may even be accurate... any given paper might be in error without throwing any doubt on the overall science. We all take a false position when we pretend to be perfect.
I do NOT not have the tools to determine WTF they are saying and I can't simply "reject" a statistical argument I do not understand.
No matter that I agree with the conclusion of the original paper, I can't use it in argument anywhere if that argument on climateaudit stands unanswered.
What I am asking is that someone who has the tools to understand, read over that attack and respond appropriately, here or elsewhere. Please.
You know who I am and how to reach me. If you have any doubt whatsoever, just e-mail me.
[JH] The use of "all caps" is akin to shouting and is prohibited by the SkS Comments Policy.
bjchip,
I read the paper at Nature, and then I read the climateaudit post until I got bored. It didn't seem to be responsive to the basic claims of the paper, just throwing up a bunch of noise leading to a meaningless dismissal of Marotzke. The substance of the criticism isn't much more than the quote, "The statistical methods used in the paper are so bad as to merit use in a class on how not to do applied statistics." which is a good insult but not an informed criticism.
My reason for rejecting climateaudit is that it's inherently untrustworthy, as has been well demonstrated. Nature deserves more credibility a priori than climateaudit ever will.
Thanks for that OSweetMrMath...
I don't trust climateaudit apart from as a negative indicator, but I have to find actual problems in what they say. The fact that they are publishing to a blog and not submitting a comment to Nature is suspect, but I need to understand how they are wrong if in fact they are wrong. As long as there isn't a detailed takedown of the climateaudit comment the original work remains nullified as an argument.
One error would be this:
Right... tell it to the Chinese.
But what the heck is this? I don't see circularity here unless Marotzke is diagnosing a term that Forster already included. Which appears to be what is being claimed. The original paper is behind a paywall and that is not working well for us.
I can't begin... even if I had the time. The original paper is needed to address that question.
[JH] Why is it incumbent on you to find actual problems in what is posted on Climateaudit? When you do have an "actual problem" identified, what do you to with it? I ask the questions because your requests for assistance could be a cover for promoting Climateaudit. Over the years, we have encountered many commenters who are pretending to be something they are not.
I have retracted the above because I have been convinced that bjchip is honestly seeking assistance from us.
I actively defend the models in a variety of places, and this looks to become a useful addition to the science, but we can't use it while that critique is out there, unanswered.
If Lewis is wrong about the datasets used, wrong about the circularity, then we can use it.
I don't have access to the original paper, I don't know for certain what Lewis is on about in his critique, so I am asking for a little help here...
...because this isn't something I'd want to ask Forster or Marotzke cold.
That'd just be rude.
I think they're probably right and I really want to refer to it, but at the same time I really want to know how to respond to the people who just point at that critique.
I can and will continue to defend the model's quite excellent performance with many other things I have learned from Tamino and at Realclimate and here... but this paper looks real good and it isn't currently usable.
[DB] "I don't have access to the original paper"
An accessible copy of the full paper can be found here.
bjchip,
So on the one hand, we have a peer-reviewed, published paper. On the other hand, we have someone yelling on the Internet.
Your claim is even though you can't even understand the yelling person, their mere existence is sufficient to nullify the paper. What's the rule here? The winner is the person who yells last? The winner is the person who yells loudest? If you don't require the criticism to be at least understandable, then you are giving up scientific thinking as a criterion for evaluating the argument.
But let's go ahead and evaluate the argument. Nic Lewis says "As is now evident, Marotzke’s equation (3) involves regressing ΔT on a linear function of itself. This circularity fundamentally invalidates the regression model assumptions." Well, that certainly sounds bad. But is it true? And if so, what does it mean mean for the paper as a whole?
Your response here is to complain that Marotzke's paper isn't freely available. Perhaps if it were, you could read it and determine whether Lewis has a valid criticism. This is exactly backward. Lewis is criticizing the paper. It is his responsibility to present enough of Marotzke's argument to show where it fails. You are unlikely to find Lewis's full argument against Marotzke in Lewis's post.
Lewis has no interest in presenting a full argument. A well established denier tactic is to pluck a single statement out of a paper and then proceed to attack this statement with no context. The implication is always that if this statement is incorrect, the entire paper is invalid. By not addressing the paper as a whole, the denier doesn't have to substantiate the invalidity of the paper.
And by pulling the statement out of context, it becomes much easier to loudly attack it. Having set a low goal of challenging a single statement, taken by itself and out of context, the denier doesn't even try to succeed at that goal. All they do is make a lot of noise about that statement, leading the reader to conclude that if there's so much objectionable about the statement, it must be incorrect.
When you declare Marotzke's paper unusable, you give Nic Lewis far more power and credit than he deserves.
bjchip... Fundamental rule: Peer review trumps blog post.
The CA people think they have a legitimate challenge to the research then they need to get a response through peer review, preferably in the original journal the papers was published in. (And they know this.)
Rob - I agree... peer review does that... in the science. I do expect that there will be official and reasoned critiques in the journals and over the next year it will be all sorted... and defended... and if at the end of that time Lewis hasn't submitted, I'll be safe to ignore him... then. It will still be out there, but I will be able to respond by asking why he didn't submit the critique. That is then...
However, in the blogs and forums where I push back at the foolishness today, there is no distinction. If it is published on some blog it is credible to the credulous fools who buy the propaganda of the likes of CEI or the lying not-quite-a-Lord. In most cases I can do the take-down myself. This one is different.
OhSweetMath - Yes exactly
" But is it true? And if so, what does it mean mean for the paper as a whole?"
I am reading now, both the paper (thanks for that link) and the source reference by Forster that Lewis appears to claim makes the logic circular. For me this is apt to take several weeks. I am not a statistician, amateur or otherwise. I have to wade through it all by brute force.
I am not yet clearly seeing the "circular logic" claimed, and until/unless I can understand that I can't argue against it, or worse, possibly decide that it is correct, or more likely and even worse, deciding it is correct in error.
Part of the reason SkS exists is to make sure that people like me don't have to do that all by ourselves. I am relying on one of the statements of the moderator above...
I am not taking Lewis' word for it, but I am not able to simply ignore the critique in the arguments I get into, nor willing to just discard it because of its source.
If I can see errors myself and I usually do (I don't come here hat in hand all that often), I will hurl it away with great force. Reading it however, it appears that the context is enough... if it is correct.
When I say this paper unusable it is in the context of the arguments I am commonly engaged in, not in the context of the science. Context matters.
I want to thank you all for helping as you have. Glad to be able to look at the paper itself. Cautiously optimistic that someone with better tools than I have can help me understand better.
Thanks BJ
[JH] You are correct, the Lewis critique of the Marotzke paper has gone viral in Deniersville.
Many thanks for the link in Mod's response to post 15.
I'm in same boat as bjchip, trying to defend science against knuckleheads, but not really qualified to understand half the issues. But reading the paper... I think even a layman can spot what CA is trying to pull.
Their criticism isn't relevant to the question of model accuracy. It's about the next section, where the authors investigates "contributions of radiative forcing, climate feedback and ocean heat uptake" to the runs.
So even if they were right (which they probably aren't) - their criticism is completely irrelevant to the question of models being accurate.
Is that right? I'm hoping someone who understands this stuff better than me (I'm a carpenter), will be generous enough with their time, to take 5 minutes and verify... please?
[Rob P] - Haven't been following the latest storm in a teacup, but Marotzke & Forster's reply is up at Ed Hawkins' blog - Climate Lab Book.
agh, no, I'm wrong.
Cooper13:
It appears that the thermal expansion coefficient of seawater does vary with depth.
Also, according to the IPCC:
Thanks for that, MA. But am I reading your chart and statement right? At a given temperature increase, does water expand more under conditions of higher pressure than under conditions of lower pressure??
That seems rather...counterintuitive! Am I missing or misinterpeting something?
bjchip:
As Rob Painting has pointed out in a Moderator's Comment to #19 frenchie, Jochem Marotske & Piers Forseter have publicly responded to Nic Lewis's critque of Marotzke & Forster (2015). Their response is in the form of a guest post on the Ed Hawkins' blog, Climate Lab Book.
Saw it and already started using it.
Many thanks. We are all indebted to you guys for working through the hard stuff.
respectfully
BJ
May want to push that link up as an addendum to the OP.
"...The authors don't rule out a minor contribution from some models underestimating cooling from volcanic eruptions..."
That's either incorrect, or highly misleading, or a typo (he meant overestimating not underestimating). Look at the model to observation trend difference for the 15 year trends starting in 1992 in the above trend comparison graph (1992 is the approximate maximum cooling effect of Pinatubo). Those trends are much warmer in the models than the observations.
In the models there is an all time peak in the warming rate for trends starting approximately 1992. This would indicate the models (or most of them anyway) have overcooled the late 1991 to 1994 or 1995 period, either by the breadth of the cooling or the depth.
Perhaps some models don't cool enough, but that does not appear to be the case for most models.