


 Arguments


Recent Comments
Prev 2 3 4 5 6 7 8 9 10 11 12 13 14 15 16 17 Next
Comments 451 to 500:
-
One Planet Only Forever at 08:20 AM on 11 December 2023CO2 limits will harm the economy
PollutionMonster @120
I appreciate your concerns. Thanks for the link to the ccdh Toxic Ten.
I was unaware of the evaluation and identification of the Toxic Ten regarding climate change. It is indeed a helpful compilation and sharing of information. However, the results of the investigation are no surprise. The problem is much more than the success of the likes of the Toxic Ten.
Increasing the number of people who are determined to ‘learn to be less harmful and more helpful to others’ is a key to correcting the developed systemic socioeconomic-political problems and the diversity of resulting developed problems.
Keeping the Toxic Ten from being popular and profitable is helpful. But it is unlikely to solve the fundamental problem of ‘the success of efforts against learning to be more helpful and less harmful to others’. How and why the Toxic Ten, and other efforts against ethical learning, succeed is more of a concern.
A way of understanding the Toxic Ten ‘success’ is presented by Alan MacLeod in Propaganda in the Information Age, Routledge (Taylor and Francis Group), 2019. It is a social media era update of Edward S. Herman’s Propaganda Model that Herman presented (with Noam Chomsky) in Manufacturing Consent, New York: Pantheon Books, 1988 updated 2002 (a movie of the same name was made in 1992).
A significant point of the Propaganda Model is that developed socioeconomic-political systems can be systemically biased to develop and promote misinformation and disinformation to defend and excuse unjustified ‘successful powerful interests’.
In 2000 Herman stated the following update “Although the new technologies have great potential for democratic communication, there is little reason to expect the Internet to serve democratic ends if it is left to the market.”
An example of the free-marketplace failure Herman referred to is new in the news. Members of X have voted to allow proven massive-dis-informer Alex Jones to be eligible to post again on what used to be Twitter (the version of the social media platform that justifiably kicked Jones off of its communication platform). The harmful disinformation actors now thriving on X voted to allow one of their worst examples to ‘Shine Fine Again’ ... because more freedom is argued to always be better. (PS Alex Jones making money through X could help him pay court settlements. But that is no justification for increasing his Freedom to ‘almost certainly try to profit more from disinformation’).
I agree with the need to cripple the ability of ‘bad actors’ to proliferate harmful misunderstandings through social media and other means. However, I am also aware that the ‘bad actors’ include everyone involved in the recent US Court actions (an example article is NBC News item “Supreme Court blocks restrictions on Biden administration efforts to get platforms to remove social media posts”), including some members of the US Supreme Court, fighting against government efforts to limit the harm done through social media ... arguing that efforts to limit the harm done are harmful, often based on arguments of the glory of Freedom (especially Freedom from the responsibility to ethically learn to be less harmful and more helpful to Others).
Similar arguments have been made, including the opening line of the Myth “CO2 limits will harm the economy”. That is arguing that ‘harm is done by efforts to limit the harm done by fossil fuel use’. A significant ‘harm done’ would be the loss of undeserved perceptions of superior status by people who benefited most from the harm done so far.
Merchants of Doubt defending undeserved developed perceptions of status are an expected product of a socioeconomic-political system that lacks ethical self-governing or external governing of the competition for impressions of status, especially in a marketplace of ideas and actions driven to ‘over-protect freedoms’ to the detriment of ‘fundamental ethical responsibility to learn to be less harmful and more helpful to Others’.
This is an age-old problem. Protecting unjustified perceptions of superiority relative to Others has always included arguing for unjustifiable ways of obtaining and maintaining perceptions of status - including any argument that attempts to increase or prolong the ability of 'already fortunate people' to benefit more from fossil fuel use.
-
BaerbelW at 20:36 PM on 10 December 2023CO2 increase is natural, not human-caused
Please note: a new basic level version of this rebuttal was published on December 10, 2023. It includes an "at a glance“ section at the top. To learn more about these updates and how you can help with evaluating their effectiveness, please check out the accompanying blog post @ https://sks.to/at-a-glance
-
Doug Bostrom at 10:54 AM on 10 December 2023Skeptical Science New Research for Week #49 2023
Michael: This is unlikely to affect anyone living but bodes very bad for 1000 years from now.
I like to imagine we'll do better with the next 5,000 years of attempted civilization than we've done with the past 5,000 years. From that perspective it's concerning.
More basically: don't trash borrowed things. Somebody else is in line.
Technical note: I sure like the "structured abstract" approach in Science. The article itself is obfuscated but the payload "for the rest of us" gets through. We only have to take it on faith that it's faithful to the actual item. :-)
-
nigelj at 04:35 AM on 10 December 2023Skeptical Science New Research for Week #49 2023
MS Sweet. Good information to know.
"I note that Dr. Hansen has long held an Earth System Sensitivity of 6 C. The IPCC consensus has been 3C"
The IPCC number is "equilibrium climate sensitivity", a different thing from earth system sensativity as below. Making it hard to compare the two numbers.
"By definition, equilibrium climate sensitivity does not include feedbacks that take millennia to emerge, such as long-term changes in Earth's albedo because of changes in ice sheets and vegetation. It includes the slow response of the deep oceans' warming, which also takes millennia, and so ECS fails to reflect the actual future warming that would occur if CO2 is stabilized at double pre-industrial values.[38] Earth system sensitivity (ESS) incorporates the effects of these slower feedback loops, such as the change in Earth's albedo from the melting of large continental ice sheets, which covered much of the Northern Hemisphere during the Last Glacial Maximum and still cover Greenland and Antarctica)...."
(Climate sensitivity, wikipedia)
We will probably never know any of these numbers for sure because you can't put the planet in the laboratory. (Although I think paleo studies like the one you posted have a lot of credibility - because they are based on real world conditions). But IMHO that uncertainty is not necessarily a crucial problem. Current rates of warming are bad and are having very visible effects, and huge implicatrion in the short to medium term, and so whatever the level of climate sensitivity using whatever definition, we clearly have a huge problem.
-
michael sweet at 01:16 AM on 10 December 2023Skeptical Science New Research for Week #49 2023
This MSN article, Which is apparently a press release from the Columbia Climate school describes a paper in Science. The paper is a collaboration of many scientists summarizing knowledge of CO2 concentrations for the past 65 million years. The MSN article is easy to read. Since it is a press release it would be a good OP here at SkS. I have not yet read the paper.
Unfortunately, they conclude that Earth system sensitivity, the climate response when all slow feedbacks respond, is 5-8 C. The processes involved can take a long time to equilibrate (as much as thousands of years). Still, it is a very grim conclusion. I note that Dr. Hansen has long held an Earth System Sensitivity of 6 C. The IPCC consensus has been 3C. This is unlikely to affect anyone living but bodes very bad for 1000 years from now. The question of how long the slow processes take to equilibrate is left unanswered.
-
PollutionMonster at 16:15 PM on 8 December 2023CO2 limits will harm the economy
One Planet Only Forever @118
I bought and read the book 9.9% you mentioned. I am still fact checking and checking the references. What is distrubing about the book is the power of a few, magnified minority to influence both media and poltics with their vast wealth and power.
If I understand correctly, via dark money denier think tanks and lobbyists can have a massive impact discretly. Kind of a scary thought when disinformation campaigns magnified minority combined with politics can have major impacts, whether it be the Merchants of Doubt for Tobbaco, Disinformation Dozen anti-vaxx, and now the Toxic Ten for climate change.
Have you read about the ccdh Toxic Ten?
-
John Mason at 01:40 AM on 8 December 2023At a glance - Has the greenhouse effect been falsified?
@#7 Eclectic,
Just how important Eunice Foote's work was came to light relatively recently. I've not seen any evidence she corresponded with Tyndall. So far as I am aware the findings occurred independently of one another.
We revised The History of Climate Science here at SkS, to highlight her contribution, a few years ago after Katharine Hayhoe brought it to my atttention. -
One Planet Only Forever at 07:41 AM on 7 December 2023Most people don’t realize how much progress we’ve made on climate change
There is reason to continue to be skeptical regarding the rate of progress on the undeniable need for corrections of many ‘harmful popular profitable developments’ to limit the harm done to future generations by ‘most fortunate people’ today.
Things are undeniable worse today than they should have been. The following quote describes actions that caused less correction to occur than could have and should have happened.
“After years of inaction despite constant warnings from climate scientists, hopes had been high for a breakthrough in climate agreements in 2009, leading up to the U.N. summit — known as COP15 — in Copenhagen.
But just a few weeks before that event began, a hacker broke into a server at the University of East Anglia’s Climatic Research Unit and released a tranche of climate scientists’ stolen emails. Though there was no indication of wrongdoing in those emails, some phrases taken out of context, combined with the then-unusual nature of the public release of private email correspondence derailed the Copenhagen summit, which was ultimately widely considered a failure.
Climate science denial and policy obstruction thrived in the ensuing years (after the theft of East Anglia emails and misleading promotion of them prior to COP . That was exemplified by an incident in which then-Sen. James Inhofe, a Republican from Oklahoma, brought a snowball to the floor of the Senate in February 2015, because he apparently believed that winter snow proved that global warming was a hoax. (it doesn't)”
Inhofe was likely promoting a misleading marketing scam. And the ‘liking to benefit from making things as bad as can be gotten away with’ crowd is still at it today.
This recent NPR item “Oil firms are out in force at the climate talks. Here's how to decode their language” (linked here) exposes that those who resist harm reduction efforts rely on science, the science of misleading marketing. See the NPR item “U.N. climate talks head says "no science" backs ending fossil fuels. That's incorrect" (Linked here) which includes the following: “...al-Jaber responds to Robinson's suggestion with this incorrect statement: "I respect the science, and there is no science out there, or no scenario out there, that says that the phase-out of fossil fuel is what's going to achieve 1.5 [degrees Celsius]." That is my basis for stating that the beneficiaries of being more harmful ‘love the science ... of misleading marketing’.
As presented in the first NPR item the Oil (and gas) firms have developed misleading marketing abuses of the following terms (watch out for how they are abused):
- Low carbon and Lower carbon (no admission of the need to meet the Paris objective)
- Unabated fossil fuels (abated gets a free pass even if it isn’t a significant abatement)
- Net-zero (relies on the magic of actions that suck carbon out, or relies on the harm of their actions, providing fossil fuels that ‘other harmful people burn’, being perceived to be net-zero)
- Reliable. Affordable and ‘secure’ energy (questionable claims made using these terms – all dismissive of harm done.
The worst claims are the one about reducing perceptions of poverty - without mentioning that is accomplished via unsustainable and harmful actions – which means that no real reduction of poverty has occurred, just fleeting impressions that things have improved.
-
Paul Pukite at 07:31 AM on 7 December 2023At a glance - Evidence for global warming
You may be skeptical of the claims, but they're out there and after 5 years no-one has tried to refute, debunk, or falsify the claims. I submitted a presentation to next spring's US CliVar Workshop which they're calling "Confronting Earth System Model Trends with Observations: The Good, the Bad, and the Ugly".
Comparing historical trends in Earth system models with observations to identify and understand where models are performing well and poorly to focus the community on where more work is needed to ensure credible projections moving forward. What are we getting right? What are we getting wrong and why? What have we not yet paid enough attention to and where might surprises lie?
Objectives
For over 40 years, and through several rounds of IPCC reports, the climate science community has made projections of climate change under specific emissions scenarios. While assessments of the fidelity of Earth System Model simulations over the historical period have been performed for basic variables such as near surface air temperature, internal variability and a relatively small signal in a short observational record has made a comprehensive assessment challenging.My submitted abstract addresses the internal variability part. I don't know yet whether it was accepted for presentation, but I'm confident that it won't be wasting anyone's time.
-
One Planet Only Forever at 06:48 AM on 7 December 2023At a glance - Evidence for global warming
Regarding the discussion of ENSO patterns, modelling and forecasting.
The SkS Argument/Myth item "Global warming and the El Niño Southern Oscillation" that John Mason @31 suggested as a more appropriate thread has some potentially very relevant points made in the latest comments starting with comment 198 (from 2019).
Another location of potentially helpful information is the Australian Bureau of Meteorology's "Climate Driver Update" website (linked here). The "Pacific Ocean" tab (linked here) presents a broad range of forecasts for the NINO3.4 SST from multiple forecasters. There is approximately a 1.0 degrees C range of forecasts for January 2024.
-
Eclectic at 05:43 AM on 7 December 2023At a glance - Has the greenhouse effect been falsified?
Eunice Foote certainly deserves to be more notable. History is often unfair, in its "colloquial" form.
bf@4 : Thanks for those thoughts.
I was intrigued that you had described the color box as dark orange tab ~ rather than the dark red tab which I had automatically pictured.
As you say, it is a devilish job to design even a simple black&white "form" for people to fill out correctly (without danger of misinterpretations).
Then we get to the devilish question of colors themselves ~ and how they are perceived (even at different illumination levels) by the "mainstream" viewers, versus the various so-called "anomalous" genetic subgroups that make up each & every population (and are exhibited differently in males/females). Fortunately, these different color perceptions are usually not of great importance . . . although camouflage-designers and traffic-light-designers would disagree on that. [You may have idly wondered why the green "GO" traffic light has a faint tinge of blue.]
And then there is the psychological component, where humans may mentally perceive the color that they expect to see (in a certain object or context).
And nowadays we have the problem of designing eye-catching layouts for a target population of people who are busy and/or distractable ~ and who are viewing on screens (usually without standard color calibration) of widely-differing sizes . . . sizes down to even a few inches, quite commonly.
But enough of this off-topic verbiage from me. The small groups of volunteers managing the SkepticalScience website have a wickedly big load on their shoulders, in all sorts of ways.
-
nigelj at 05:04 AM on 7 December 2023At a glance - Has the greenhouse effect been falsified?
"By the end of that century, Eunice Foote and John Tyndall had proved him quite correct through their experiments with various gases..."
Exactly so. It might be good to include a brief statement about how the experiments worked (with canisters of CO2 exposed to a radiant heat source and measurements taken?). I say this because this is really the crucial foundation of things, along with observations of the planets climates and deducations from that.
In order to make sense of the whole complicated issue as a non expert, I have always done this. It seems to we know for a fact from laboratory experiments that CO2 is a greenhouse gas because it (simplifying) absorbs heat while oxygen and nitrogen etc,etc do not. Therefore if you add even very, very small quantities of CO2 to the atmosphere, even one single molecule, it must absorb heat and thus have at least some warming effect on the atmosphere, and the issue is entirely about how much CO2 is added to the atmosphere, and what warming effect results in total. This is simple logic.
Arrhenius did some calculations in the 1890s I dont fully understand but they seem robust as they made accurate predictions about warming in the 20th century. While I generally dont like assumptions, it seems safe to assume our current climate calculations are more sophisticated. So I see no need to be scepetical any longer about the greenhouse effect, and the proclamations in the climate myth box that the greenhouse effect contradicts so called physical laws is just ignorance or made up nonsense.
-
wilddouglascounty at 03:29 AM on 7 December 2023At a glance - Has the greenhouse effect been falsified?
Thanks for inserting Eunice Foote as the lead person finding out the role of greenhouse gases, three years before John Tyndall. In fact Tyndall most likely read Foote's article about it before doing his own experiments, and has gotten all of the credit up until recently. There's an excellent chapter about this in the book All We Can Save edi. by Ayana Elizabeth Johnson and Katharine K. Wilkinson.
-
At a glance - Has the greenhouse effect been falsified?
Eclectic @3 - I've never encountered the Ishihara Color Chart, but never had any known issues with color vision, and never had problems with the old tests where the number in a field of colored dots would be hidden to people with this or that form of colorblindness.
But the first time I had to pay attention to viewability issues was decades ago when the company I was working at needed to design a standard form for customers to fill out and mail back. The goal was OCR and the people working that process first suggested a very very light blue drop-out for the form, and I reminded them the senior citizens filling the forms out don't have the same vision as the twenty-somethings putting the thing together. We went with the highest-contrast, dark red drop-out ink for the form design instead.
But yesterday I was struck by the fact that I read the "What the science says" and the line in the green box, but my eyes then went immediately to the "The greenhouse effect has been falsified" at the start of the orange box, without noting the much smaller "climate myth" in the tab. This on a laptop, by the way, and I've got fairly decent vision.
I've been looking at this site for a long time and this is the first time I realized the readability might need a change to better manage the reader's flow. Perhaps putting "Climate Myth" at the same size font as the "What the science says...", only have it on white background in the dark orange as font color. Lots of online text these days in different publications will feature text with different background shades just as decoration, so the shift from green to orange may no longer be enough of a cue.
-
michael sweet at 23:20 PM on 6 December 2023At a glance - Evidence for global warming
Paul Pukite:
So a monograph that I cannot access and a paper with 21 citations. Not very impressive. How well did the group that published the paper predict in advance the last 5 years of La Ninas and the current El Nino? I am always skeptical of claims that tidal forces can cause changes in weather a year later.
It appears to me that the general description that ENSO is random and not predictable in advance is correct. Your claims at post 34 do not hold up to close inspection. You are welcome to believe anything you like.
-
michael sweet at 22:48 PM on 6 December 2023At a glance - Evidence for global warming
Daniel,
I have seen similar graphs before. The slopes of the lines are very similar.
In your graphic the graphed line for the La Nina data is obviously incorrect. It has a different slope and runs through the middle of the bars when it should be at the top of the bars. The data is fine. Hopefully the person who maintains the graph will notice when they add the data for 2023 and correct it.
-
Eclectic at 18:01 PM on 6 December 2023At a glance - Has the greenhouse effect been falsified?
bf @1 :- A technical question for you:
Do your eyes rate as "mainstream" on the Ishihara Color Chart ?
and
Do the various screens you use get calibrated for color gamut ?
You are certainly quite right that many people nowadays are using very small screens, though high-resolution (e.g. latest iPhones).
-
John Mason at 17:05 PM on 6 December 2023At a glance - Has the greenhouse effect been falsified?
re - #1 - thanks for the feedback. Always useful to read people's thoughts about design/accessibility.
-
At a glance - Has the greenhouse effect been falsified?
A formatting suggestion if you don't want people to mistake the myth for the debunking - don't use a teeny-tiny white font in a dark orange tab to label the "Climate myth..."
Those important words are missed "at a glance" by many who don't have eyes that quickly read the smallest line on the eye doctor's exam chart, and including the myth (and its tiny label) INSIDE the frame of a box clearly labeled "What the Science Says" in a large, green font makes being misled even easier.
Separate and label "MYTH HERE" clearly.
Regards,
B Fagan
-
Paul Pukite at 11:59 AM on 6 December 2023At a glance - Evidence for global warming
"I note that your post at 34 contains several completely unsupported assertions."
No problem. Concerning the points that ENSO is not chaotic, not random, and not driven by wind, there are a couple of citations I can point to. The most comprehensive is a monograph that I co-authored titled Mathematical Geoenergy (Wiley/AGU, 2018, chapter 12: Wave Energy) . Another coincidental finding was reported Lin & Qian "Switch Between El Nino and La Nina is Caused by Subsurface Ocean Waves Likely Driven by Lunar Tidal Forcing" https://www.nature.com/articles/s41598-019-49678-w
These of course havee nothing to do with climate change, as according to the definitions at this site, ENSO is apparently not considered climate change, but as climate variability.
-
Daniel Bailey at 10:53 AM on 6 December 2023At a glance - Evidence for global warming
@michael sweet @38
The graphic uses the GISS temperature data, color-coded by ENSO phase, updated through the end of 2021. When the full-year data for 2023 comes out, it should get updated then. The slopes will change somewhat as the background phase states change, but the underlying exogenous driver is still human activities. As a result, ocean heat content rates are accelerating (from Li et al 2023, Figure 1), further warming all ENSO phases over time:
-
michael sweet at 10:25 AM on 6 December 2023At a glance - Evidence for global warming
Paul Pukite:
When we discuss new science at SkS we like the contributors to post links to suppoort their positions. I note that your post at 34 contains several completely unsupported assertions. Perhaps you could present some data and links to papers to support your claims. I really do not care what someone who incorrectly labels their graphs thinks.
-
michael sweet at 10:22 AM on 6 December 2023At a glance - Evidence for global warming
Hi Daniel,
I like yor graphic. It appears to my eyecrometer that the line for the La Nina years has too low a slope for the data points. Did you arrange the graph or did you copy it somwhere? If the La Nina line is corrected the slope of all three lines is about the same. We would expect the slope to be the same if the El Nino oscellation was not affecting the underlying AGW.
-
One Planet Only Forever at 09:01 AM on 6 December 2023At a glance - Evidence for global warming
Daniel Bailey,
John Mason @31 pointed to the SkS Argument/Myth item "Global warming and the El Niño Southern Oscillation".
That does appear to be a good location for the discussion in question to be continued.
-
Daniel Bailey at 06:20 AM on 6 December 2023At a glance - Evidence for global warming
Yes, this is getting off-topic. Risking pushing the envelope, all ENSO phases are clearly warming, due to the underlying and overburdening human forcing of climate becoming increasingly pervasive. Perhaps a better thread can be suggested for such (but not here).

-
nigelj at 05:17 AM on 6 December 2023At a glance - Evidence for global warming
Paul Pukete. While this website is called scepticalscience.com its obviously about climate change and so your comments about the causes of ENSO are strictly speaking a bit off topic. You might consider combining commentary on climate change with some comments on the causes of ENSO. People generally like off topic up to a point, as long as its interesting and people are not constantly off topic and clearly pushing personal agendas. I have generally found your comments interesting.
-
Paul Pukite at 01:45 AM on 6 December 2023At a glance - Evidence for global warming
But you asked why I commented on this post with respect to ENSO, when it was you that mentioned La Nina in the the post itself. But we're no longer in a La Nina regime but in El Nino.
I just wanted to test the waters here again to see if this site has changed its approach to being more about research than gatekeeping. I keep thinking that the name Skeptical Science describes the charter.
I am skeptical that ENSO is chaotic.
I am skeptical that ENSO is random.
I am skeptical that ENSO is triggered by a change in prevailing winds.I think I get it — the skepticism is directed not at current models of bleeding edge climate science where millions of $$ are being poured into machine learning for ENSO predictions by the likes of Google and NVIDIA, but at skepticism to combat crackpot models that claim AGW is being generated by subsurface volcanic activity.
Cheers. I think I'm good now.
-
John Mason at 15:12 PM on 5 December 2023At a glance - Evidence for global warming
@Paul #32:
"As it turns out we are now in the midst of a definitely emerging El Nino. The ENSO cycles can transiently override the gradual warming of AGW, so this is a factor to point out. "
I think most readers on here are well aware that the EN phase of ENSO overdubs the AGW signal on a temporary basis!
-
Paul Pukite at 03:01 AM on 5 December 2023At a glance - Evidence for global warming
Because the present post is mentioning ENSO
"Sea-surface temperature patterns in the tropical Pacific were characteristic of La Niña, a phenomenon that should have mitigated against atmospheric heat gain at the global scale. However, the annual global surface temperature across land and oceans was among the six highest in records dating as far back as the mid-1800s. 2022 was the warmest La Niña year on record.
At the time of writing, there is still about a month of 2023 to run. Yet once again we have record-breaking temperatures, with some records smashed by huge margins, so that 2023 looks as though it may well go down as the hottest on record."
As it turns out we are now in the midst of a definitely emerging El Nino. The ENSO cycles can transiently override the gradual warming of AGW, so this is a factor to point out.
concerning
https://skepticalscience.com/el-nino-southern-oscillation.htm
There was a long-running discussion on ENSO at the Azimuth Project forum started in 2014 that recently ended. The original motivation was to collaborate and analyze ENSO data and consider different math approaches to modeling the cycles, as the organizers of the project were skeptical as to a chaotic or random origin for ENSO. Alas, the owner of the site shut it down and wiped out the entire archive. Fortunately, some of the open source code for the effort was kept on a GitHub repo and I was able to grab ownership and keep that alive, so a remnant discussion is available for those that have GitHub accounts. https://github.com/azimuth-project
-
John Mason at 18:16 PM on 4 December 2023At a glance - Evidence for global warming
@Paul #30:
Fair enough and I have encountered you at RC too, but it might be more appropriate to post about ENSO in a thread specifically about ENSO, for example:
https://skepticalscience.com/el-nino-southern-oscillation.htmThat page has not yet been updated like many of our rebuttals, but it will be in due course.
-
Paul Pukite at 15:46 PM on 4 December 2023At a glance - Evidence for global warming
"If that's your motivation it seems well and good, but why did you choose to interject on this thread?"
Had an account here for many years and thought I would test the waters for discussion on bleeding-edge research, which is what ENSO is all about. I do have my own blog so it's not like an alien thing for me to raise a discussion point,
-
One Planet Only Forever at 07:28 AM on 4 December 2023At a glance - Evidence for global warming
Paul Pukite,
I like John Mason’s question @26. But would extend it as follows: “...why did you choose to interject on this thread...” the way that you did @2?
Though you have not directly addressed the questions I raised @4 regarding your comment @2, your latest comments appear to indicate an awareness that it was incorrect to state that there was no similar warming in “the middle of the equatorial Pacific” [quote from you @2] (I agreed that it is worthy of being thrown away). But I still do not see indications of awareness that it was also wrong to try to justify that incorrect assertion by misrepresenting the paper you linked @2 with a ‘quote-clearly-out-of-context’.
Making incorrect statements with questionable or made-up justifications and then arguing against attempts at clarification and correction of the incorrect belief is similar to the behaviour of the regular denizens of sites like WUWT and Dr. Roy Spencer.
I wish you luck in your endeavours to ‘constantly learn more about ENSO – constantly changing your mind as you learn more’.
-
michael sweet at 00:13 AM on 4 December 2023At a glance - Evidence for global warming
I note that Arhennius predicted in 1896 that the tropics would heat up slower that the poles and the ocean would heat up slower than the ocean. Since the global average heating is about 1.2 C, we woud expect less than 1 C warming in the tropical ocean.
-
michael sweet at 00:07 AM on 4 December 2023At a glance - Evidence for global warming
Paul Pukite,
At post two you said "Not the middle of the equatorial Pacific." Referring to the comment "All these show a similar warming trend."
At post 7 you said "when one searches for equatorial Pacific ocean SST time-series, you only get NINO34, NINO4, etc data. These show no or very little trend,"
I entered the thread to show that your comments were false. My illustration at post 9 clearly demonstrates that you were incorrect. You posted a graph at post 13 claiming no trend, asserting that the graph had not been detrended. My post at 21 showed your graph was detrended and your claims of no trend in the tropical ocean are simply false.
Now at 23 you post a graph that is actually not detrended and use your eyecrometer to claim your graph is more informative than my illustration. Using my eyecroneter on my illustration I see clearly that the trend is closer to one degree. If you put a least squares line on your graph we would have data instead of idle speculation. All these trends can easily be Googled, you are simply not looking.
I have proved beyond doubt that your claim that the tropical oceans "show no or very little trend," is completely false. The fact that you produced a graph that was not detrended and showed a trend after claiming a detrended graph showed there was no trend indicates that you are not interested in a discussion of the science here.
If you want to speculate on ENSO causes go for it As I understand it, ENSO is essentially random on a yearly basis.
-
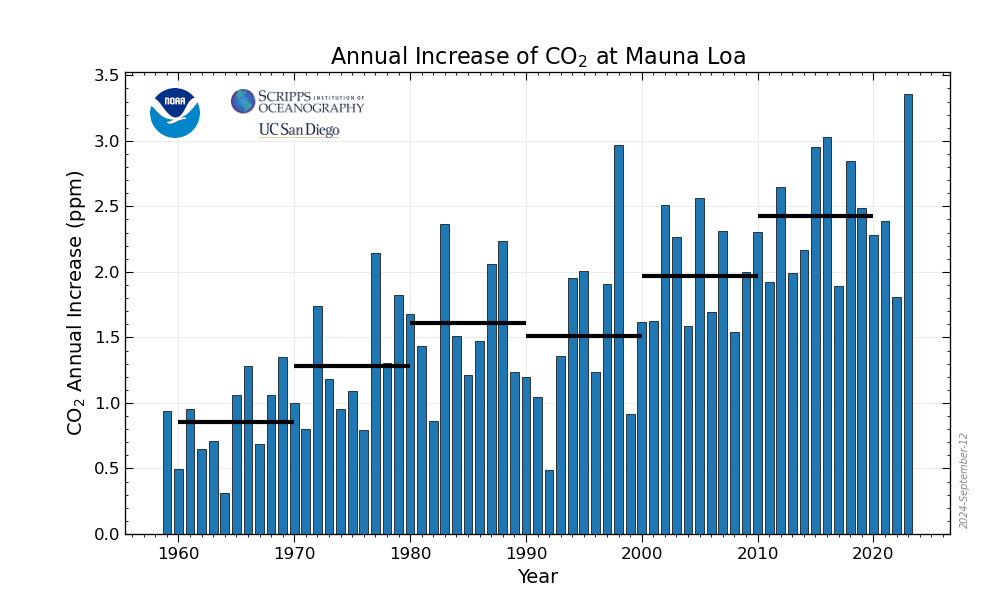
Evan at 21:49 PM on 3 December 20232023 SkS Weekly Climate Change & Global Warming News Roundup #48
Although I do not disagree with the conclusion of the lead article here that CO2 concentrations are rising at alarming rates, it is incorrect to compare levels from one year to the next, simply because natural variability causes up and down swings in individual readings.
A 10-year running average shows that the rate of increase of CO2 is continuing to increase. This alone is alarming and concerning, but focusing on changes during a single year is excessively alarming.
-
BaerbelW at 18:27 PM on 3 December 2023Breathing contributes to CO2 buildup
Please note: the basic version of this rebuttal has been updated on December 3, 2023 and now includes an "at a glance“ section at the top. To learn more about these updates and how you can help with evaluating their effectiveness, please check out the accompanying blog post @ https://sks.to/at-a-glance
-
John Mason at 17:37 PM on 3 December 2023At a glance - Evidence for global warming
@Paul#25:
If that's your motivation it seems well and good, but why did you choose to interject on this thread?
-
Paul Pukite at 16:27 PM on 3 December 2023At a glance - Evidence for global warming
I don't think you have any idea what my objective is. I frankly don't worry about modeling AGW as that's in good hands, IMHO. Instead, what I have been trying to do the last several years is model natural climate variations such as ENSO, AMO, PDO, etc. You may find it odd, but not observing a large contribution of an AGW signal in a time-series such as NINO34 actually makes it easier to do the modeling since the signal vs noise discrimination is more apparent. In other words, the underlying trend is so small relatively speaking that it doesn't matter if the time-series is detrended or not when fitting a model to the data.
So based on my actual research interests, I would much rather discuss ideas concerning forcing factors behind ENSO — including tidal & annual — than deconstructing my phrasing in a tossed-off comment. If you want to delve into modeling of the geophysical fluid dynamics and how neural nets and machine learning may be helping in revealing patterns instead of pedantic point-scoring, I am game. I will grant you a win on all the petty stuff as you seem so determined to play gotcha on a comment I made based on dealing with the data for years now.
-
One Planet Only Forever at 14:11 PM on 3 December 2023At a glance - Evidence for global warming
Paul Pukite @23,
I will continue to pursue the points I raised regarding your comment @2.
I am confident that nigelj’s comment about similar trends was regarding ‘a trend like the global average surface temperature data - warming rather than cooling with more significant warming occurring after 1950 than prior to 1950’.
Your comment @2, and later comments except for your latest @23 (sort of), appear to insist that it is not possible to have confidence regarding a warming trend in the NINO 3.4 region (the middle of the equatorial Pacific).
Your comment @2 starts with:
"All these show a similar warming trend." [nigelj’s point]
Not the middle of the equatorial Pacific. (your response)As my comments should indicate, I learned from and accepted nigelj’s finding of an explanation about the current models indicating a larger amount of warming in the equatorial Pacific (especially the east part) than the actual observations. However, as I commented, that does not alter the incorrectness of your comment @2. But you do appear to have finally accepted your incorrectness (sort of) by ‘seeing’ a warming trend in the NINO 3.4 SST data.
However, I am still confident that it is incorrect to declare that having confidence that ‘the NINO 3.4 SST historical data indicates warming similar to the global average surface temperature data’ requires an accurate explanation for the trend being lower than the current global climate models for that region and it requires that understood influence to be removed from the SST values.
The data is what it is regardless of the mechanisms producing it. Large variations of the temperature data simply requires a longer duration of the data set to have confidence that there is a warming trend. And a lower trend rate will also require a longer data set to establish confidence.
The NOAA presentation of the centered 30-year base periods (linked here) that I provided a link to in my comment @16 helpfully presents the trend of the SST NINO3.4 data set in spite of significant variations in the data values. Each 30-year period contains a substantial variety of the variation. Comparing the 5 year steps for the data starting in 1936 shows that there is indeed a recent trend (more significant after 1950 than before 1950 – consistent with the NINO3.4 chart you included in your comment @23). The 1966 to 1995 values, and all the more recent ones, are clearly warmer than the earlier ones. However, it also shows that the ENSO perturbations in the data are large enough to make the warming trend hard to be confident of, even appearing to potentially be a cooling trend in a shorter data set. The 1981 to 2010 results are not clearly warmer, and may even be cooler, than 1976 to 2005.
Global average surface temperature data evaluations using the SkS Temperature Trend Calculator (linked here) can also provide an example supporting my confidence that the ‘noise’ of ENSO variations do not need to be removed to be able to have confidence regarding a trend.
As I indicated in my comment @17, using the GISTEMPv4 dataset in the SkS Temperature Trend Calculator (linked here) the trend of the data after 1950 is 0.152+-0.018 C / decade (high confidence of a warming trend). I add the following set of shorter recent time periods and the resulting trend and level of confidence (2 sigma value compared to trend value):
Years Trend +- 2 sigma
2016 to 2023 = -0.148 +- 0.513
2015 to 2023 = -0.066 +- 0.428
2014 to 2023 = +0.074 +- 0.379
2013 to 2023 = +0.180 +- 0.331
2012 to 2023 = +0.244 +- 0.289
2011 to 2023 = +0.284 +- 0.249
2010 to 2023 = +0.262 +- 0.220
2005 to 2023 = +0.229 +- 0.129The longer the time period is the more confidence there is in the evaluated trend. Admittedly the global average surface temperature variation in the evaluations is only about 2 degrees C. So a longer time period would be expected to be required for the NINO SST values because they have larger variation of temperature and a smaller trend. But confidence regarding the trend can still be established without a detailed understanding of the mechanisms at play. And I am confident that the authors of 2012 report you (mis)quoted in your comment @2 had reason to be confident with their evaluation and reporting (repeating part of the quote I had included in my comment @4)
“...While centennial trends are not assessed here, we note that using a reduced period results in more consistent linear trends in SSTs over the 61-year record (Fig. 1), which are significantly positive throughout the tropical Pacific Ocean.”
What the authors of the paper observed and explained, was that the pre-1950 data was not as reliable as the post-1950 data. And since the main interest is ‘warming similar’ to the global average surface temperature which has more significant warming since 1950 than before 1950, the earlier SST values are not that important.
-
Paul Pukite at 06:57 AM on 3 December 2023At a glance - Evidence for global warming
It's interesting to compare NINO34 almost-raw (annual cycle is still removed) and de-trended
This is raw from KNMI explorer site

This is de-trended

So there appears to be a ~0.5 degree trend removed over the time span. All my original comments stated were that the trend was difficult to discern because of the dominating ENSO variations and those are not understood very well. That's all I said, go back and check.
In terms of optimal control theory, properly removing the signal (a warming trend) from the noise (ENSO variations) is only possible if a model for the noise is known. If the noise is statistically random with no trend, it's practical to create e.g. a Kalman filter to optimally remove the noise. However, if the noise of ENSO carries long-period multidecadal fluctuations, such as is observed with the AMO on the Atlantic side or the decadal PDO in the north Pacific, then it becomes much more challenging to discriminate the noise from the signal. That's because climate scientists still have no validated model for ENSO, being unable to predict it more than a few years in advance.
The ~1/2 degree warming in the NINO34 time-series above is in all likelihood a real AGW effect but my original remark was only in pointing out that the comment by Nigel J: "All these show a similar warming trend" could be challenged. He was OK with my remark as he found the case of the Pacific cold tongue research, which is described by NINO12 (and even more diffficult to extract the trend) and that the map by MS doesn't show this at the granularity needed. So are the rest of you speaking for him?
Moderator Response:[DB] Please limit image widths to 450. Thanks!
-
nigelj at 05:09 AM on 3 December 2023At a glance - Evidence for global warming
OPOF & M Sweet. You guys sound correct in your technical analysis and correct that the equatorial part of the pacific ocean is warming (and I also thought the graphs posted by PP showed a slight warming after 1970). But the warming in a narrow band along the equator is at a significantly slower rate than the pacific ocean as a whole (roughly 0.2 compared to 0.6 in the maps in link I posted). The map posted by MS is a bit too large scale to pick up this level of detail and difference.
This basic pattern is important, and the explanation seems quite good. I think that is the main point.
-
michael sweet at 23:24 PM on 2 December 2023At a glance - Evidence for global warming
Paul Pukte @10,
When you present a graph and say "my eyecrometer detects no trend" with no statistical analysis you are wasting our time. Likewise when you say "I am pretty certain this is not detrended" you are wasting our time. If you are not absolutely certain the data is not detrended go find out for sure.
When I go to your data source I find the graph you have presented has this label:
"cutting out region defined by mask ersstv5 nino3 mask.nc, operating on NOAA ERSSTv5 (in situ only), SSTA normalized to 1981-2010, Nino3 index minus 20S-20N average SST, normalised by a factor" my emphasis
It appears to me that your graph shows the anomaly in the Nino3 area minus the trend in the tropical oceans. Since the illustration that I posted in post at 9 shows that the tropical ocean has a clear waring trend. You have ignored since it contradicts your claims. It appears to me that your graph shows that the ENSO anomally has not changed compared to the rest of the ocean, not that the temperature has not risen in the Nino 3 area as you claim.
I note the the older data in your graph must have large error bars. I also note that small areas of the globe have much more noise so it is hard to detect the warming signal, especially by eyecrometer.
-
One Planet Only Forever at 17:13 PM on 2 December 2023At a glance - Evidence for global warming
Paul Pukite,
I included some points in my comment @18 that directly (interestingly) relate to your comment @19.
-
One Planet Only Forever at 17:09 PM on 2 December 2023At a glance - Evidence for global warming
Paul Pukite,
The SkS Temperature Trend Calculator does a statistical analysis of the temperature data that 'includes ENSO nuisance'. The same can be done for the SST data.
And you still have not addressed the points I have made regarding your inaccuate and incorrect beginning. WUWT?
I will agree that improving the ability to forecast ENSO events is important and helpful work. But the points you have tried to make-up on this string are not helpful.
-
Paul Pukite at 16:23 PM on 2 December 2023At a glance - Evidence for global warming
There could be a warming trend buried in the NINO3 time-series but it's difficult to extract because of the large El Nino and La Nina excursions — note that they exceed 4C on the positive side and almost that much on the negative side. Remember that this region is the source of energy (or sink of energy) which can heat up (or cool down) the world for months at a time so it may be understandable that the AGW trend gets buried.

It's difficult to do statistical trend analysis on such a time-series without a model of the underlying "nuisance" signal. Since I have been doing mainly ENSO research, having published and presented at several AGU/EGU meetings on the topic, I tend to think of the AGW as the nuisance — tho, since it's so small it's not much a nuisance. On the other hand if you're iterested in the AGW trend here, the ENSO signal is a huge nuisance.
-
One Planet Only Forever at 14:01 PM on 2 December 2023At a glance - Evidence for global warming
nigelj @14,
Paul Pukite’s set of comments here starting with his comment @2 are the matter of concern. Though there is a difference between current developed models and actual observations, that difference is not related to, and does not explain or excuse, Paul’s resistance to learning about the reality of a warming trend throughout the equatorial Pacific.
Note that a warming trend since 1950 appears to also be in the graph of Nino12a that Paul Pukite selected to present @15. Prior to 1950 can justifiably be excluded from the evaluation because of the reasons given by the authors of the 2012 paper Paul misrepresented and still has not indicated he has learned about.
Note that the NOAA information I most recently shared in my latest response to Paul also does not evaluate the SST before 1950 (except for using pre-1950 values to determine the earlier centered 30-year base period values).
Also note that the global average surface temperature had a significant increase of temperature after 1950 compared to the rate of increased prior to 1950. Using the SkS Temperature Trend Calculator and GISTEMPv4:
- trend: 1880 to 1950 is 0.038+-0.021 C / decade (little warming)
- trend: 1950 to today is 0.152+-0.018 C / decade (lots of warming).
Also note that it is well understood that the land temperatures and polar regions have been warming much more rapidly than the equatorial SST. So the equatorial SST warming since 1950 will be significantly less than the 1 degree C global average since 1950 (much harder to see in a chart with monthly data value swings of up to 8 degrees C like the NINO12 image presented by Paul @15 - statistical evaluation is the proper way : not "I think I see what I think I see").
-
One Planet Only Forever at 13:41 PM on 2 December 2023At a glance - Evidence for global warming
Paul Pukite @13,
Your latest comment does not address the questions I raised regarding your initial comment and the ways you have commented regarding this point.
@2 You said “...Not the middle of the equatorial Pacific. The temperature variation there is also not well understood because El Nino & La Nina cycles dominate and these are difficult to predict more than a year in advance.”I am open to learning (even though I still struggle with right vs left hand). Years ago I learned that the difficulty in ‘predicting the ENSO’ does not affect the ability to evaluate trends in the equatorial Pacific SST. Due to the trend of SST in the Niño 3.4 region (the middle of the equatorial Pacific) NOAA had revised their methodology for the Ocean Nino Index (ONI) values to be relative to a regularly updated baseline.
The following is from the NOAA webpage (linked here) that presents the ONI values identifying the “Cold & Warm Episodes by Season”.
“DESCRIPTION: Warm (red) and cold (blue) periods based on a threshold of +/- 0.5oC for the Oceanic Niño Index (ONI) [3 month running mean of ERSST.v5 SST anomalies in the Niño 3.4 region (5oN-5oS, 120o-170oW)], based on .”centered 30-year base periods updated every 5 years.”\
And the linked NOAA webpage for “centered 30-year base periods updated every 5 years” shows the annual temperature curves for each of the 30-year base periods. In that presentation there is an undeniable warming trend since 1950.
What you will notice is that the NOAA ONI and the related base periods start in 1950. This ties directly to the paper you made the unrepresentative quote from mistakenly believing that it supported your incorrect ‘declared belief’ about the middle of the equatorial Pacific.
In closing I will say that a statistical evaluation of the data points is the proper way to determine a trend in the data. However, when I look at the NINO3 graph you have chosen to share I see a warming trend for the portion from 1950 to 2010. That would be consistent with the more valid evaluation of the data done by the authors of the paper you misrepresented in your comment @2.
-
Paul Pukite at 08:13 AM on 2 December 2023At a glance - Evidence for global warming
Makes sense. The NINO3 time-series above is closer to Peru and the cold tongue than the equatorial Pacific NINO34 and NINO34 indices. Another even closer to Peru is the NINO12 time-series, which also doesn't show much of a trend.
-
nigelj at 05:44 AM on 2 December 2023At a glance - Evidence for global warming
I don't think PP is a denialist. Have seen his comments at RC. We sometimes just get on edge and jump to the conclusion that anyone who says "flat trend" is a denialist because its a common denialist talking point.
We know the oceans as a whole have warmed considerably since the 1980s. But then you do have a few areas with cooling like the cold blob in the nothern atlantic.
I'm eyeballing Paul Pukete's graphs of the equatorial pacific and at best I can only see a very slight warming trend from around 1970 - 2022. I mean it does look flat or near flat, so I looked for an explanation and this is interesting. I have highlighted the main pargraphs only:. It seems to be consistent with what PP is saying.
Part of the Pacific Ocean Is Not Warming as Expected. Why? BY KEVIN KRAJICK |JUNE 24, 2019
State-of-the-art climate models predict that as a result of human-induced climate change, the surface of the Pacific Ocean should be warming — some parts more, some less, but all warming nonetheless. Indeed, most regions are acting as expected, with one key exception: what scientists call the equatorial cold tongue. This is a strip of relatively cool water stretching along the equator from Peru into the western Pacific, across quarter of the earth’s circumference. It is produced by equatorial trade winds that blow from east to west, piling up warm surface water in the west Pacific, and also pushing surface water away from the equator itself. This makes way for colder waters to well up from the depths, creating the cold tongue.
Climate models of global warming — computerized simulations of what various parts of the earth are expected to do in reaction to rising greenhouse gases — say that the equatorial cold tongue, along with other regions, should have started warming decades ago, and should still be warming now. But the cold tongue has remained stubbornly cold.
Why are the state-of-the-art climate models out of line with what we are seeing?Well, they’ve been out of line for decades. This is not a new problem. In this paper, we think we’ve finally found out the reason why. Through multiple model generations, climate models have simulated cold tongues that are too cold and which extend too far west. There is also spuriously warm water immediately to the south of the model cold tongues, instead of cool waters that extend all the way to the cold coastal upwelling regions west of Peru and Chile. These over-developed cold tongues in the models lead to equatorial environments that have too high relative humidity and too low wind speeds. These make the sea surface temperature very sensitive to rising greenhouse gases. Hence the model cold tongues warm a lot over the past decades. In the real world, the sensitivity is lower and, in fact, some of heat added by rising greenhouse gases is offset by the upwelling of cool water from below. Thus the real-world cold tongue warms less than the waters over the tropical west Pacific or off the equator to the north and south. This pattern of sea-surface temperature change then causes the trade winds to strengthen, which lifts the cold subsurface water upward, further cooling the cold tongue.
news.climate.columbia.edu/2019/06/24/pacific-ocean-cold-tongue/
-
Paul Pukite at 04:52 AM on 2 December 2023At a glance - Evidence for global warming
One Planet Only Forever
Here is the NINO3 SST time-series, which is taken from the equatorial Pacific, and note that it is difficult to discern a warming trend. That's just the way it is in the ocean, which acts like a large heat sink, with the colder water below the therrmocline occasionally approaching the surface leading to colder La Nina episodes.
,

I am pretty certain this is not detrended as it the detrended version is also here an it appears similar
https://climexp.knmi.nl/selectindex.cgi?id=someone@somewhere


