Climate Science Glossary

Term Lookup

Enter a term in the search box to find its definition.

Settings

Use the controls in the far right panel to increase or decrease the number of terms automatically displayed (or to completely turn that feature off).

Term Lookup

Settings


All IPCC definitions taken from Climate Change 2007: The Physical Science Basis. Working Group I Contribution to the Fourth Assessment Report of the Intergovernmental Panel on Climate Change, Annex I, Glossary, pp. 941-954. Cambridge University Press.

Home Arguments Software Resources Comments The Consensus Project Translations About Support

Bluesky Facebook LinkedIn Mastodon MeWe

Twitter YouTube RSS Posts RSS Comments Email Subscribe


Climate's changed before
It's the sun
It's not bad
There is no consensus
It's cooling
Models are unreliable
Temp record is unreliable
Animals and plants can adapt
It hasn't warmed since 1998
Antarctica is gaining ice
View All Arguments...


Username
Password
New? Register here
Forgot your password?

Latest Posts

Archives

Crux of a Core, Part 1b

Posted on 3 March 2011 by Rob Honeycutt

Crux of a Core, part 1b: J Storrs Hall on WUWT

I would like to thank Dr Hall for taking the time to post a response at WUWT to my article, Crux of a Core part 1.  But I need to take the time to point out some errors.  Thanks go out to the WUWT readers who also pointed out these errors in the comments section.

In my original article I made a point to steer clear of any ad hominem remarks, an act that was not reciprocated in Dr Hall's response.  Any perceived intent to cast him as a lesser scientist than Dr Alley was unintentional.  That said, I do need to point out that Dr Alley has authored over 170 published papers related to the cryosphere and climate change.  He is, undoubtedly, one of the most eminent authorities on paleoclimate, so I find him a useful resource.  But, again, any attempt to cast Dr Hall in a lesser light in my original article was not intentional.

Point 1)  Al Gore uses single ice core records too

Dr Hall posts a photo from Al Gore's film An Inconvenient Truth and says that other people also use single ice core records as a proxy for global temperature.

As we are all aware, Al Gore is not a scientist.  I never referenced Al Gore.  And Al Gore is presenting the relationship between CO2 and temperature over the past 800,000 years, which would be an appropriate use of an Antarctic ice core record.  He is not specifically presenting it as a global temperature proxy except in the broadest sense.

Point 2)  Quotes from abstracts of papers by GISP2 authors

Hall provides a range of quotes from various abstracts on papers related to GISP2 stating that GISP2 is a record of climate.

Hall opens his response saying first that my most substantive point was that GISP2 was a local record, but here he flip-flops into referencing GISP2 as a climate record.  In none of my remarks did I ever question that GISP2 was not a robust record of climate.  I merely point out that it is not a global temperature proxy.

Point 3)  Comparison between Vostok and GISP2 data

Hall presents his own diagram of the Vostok, GISP2, and NGRIP records superimposed on each other, claiming they correlate with each other.

This is a real zinger.  First, Dr Hall has completely altered the data.  The temperature scale is only for GISP2, but he rescales the other temperature records to try to over-fit the graphs in order to show correlation.  This is a epic no-no.  If Hansen had so randomly rescaled a data series, the folks at WUWT would, rightfully, have a field day.  

In clear fact, these records only correlate at a very coarse level.  Glacial-interglacial cycles for GISP2 range nearly 20°C while Vostok range only about 7–8°C.  As pointed out by one reader, many of the individual events are actually anti-phased between the two poles (D-O events).  But, glacial-interglacial cycles tell us very little about temperature changes during the Holocene.  In the Holocene you still need to identify similar anti-phasing, called Bonds events.  More about this in Crux of a Core, Part 2.

Additional Error: Incorrect dating of the original chart

I passed on this mistake in my original piece but I think it is appropriate to point out now.

In the original post that came out on WUWT, Dr Hall makes a serious error dating the end of the graph.  The GISP2 data ends at "0.095 thousand years BP (before present)."  Hall erroneously makes the assumption that this means 1905, likely based on the publication date of Alley 2000.  In truth, BP is dated to the standard 1950 used for radiometric dating, thus the graph actually ends in 1855.  The "hockey stick" in Dr Hall's graph (yes, he does actually call it a "hockey stick") is completely preindustrial.

So, just what is the current temperature of the Greenland summit?

Dr Hall alludes in his original article that the "temperature continues up another half a degree during the 20th century."  But Greenland is not the world!  This is made quite obvious by the mere fact that, unlike in Greenland, the whole world is not on average -20°C.

According to research from Dr Jason Box the current temperatures at the Greenland summit are more than 2°C higher than the late 1800's.  This places the current temperature at the summit nearly as high as most of the peak high temperatures seen during the Holocene, and nearly the warmest seen in the entire GISP2 50,000 year temperature record.  Since Greenland is Greenland, this is the appropriate temperature comparison.

Is current warming unprecedented?

Dr Hall's closing statement is "The 20th-century warming was hardly unprecedented, and doesn’t call for unusual explanations."

This statement is completely unsupportable by the evidence Dr Hall is presenting.  It would require that he perform a much more detailed study of a wide range of records to make such a statement.  It is impossible to determine this from GISP2 alone.  

As pointed out in my article, Miller et al 2010 section 12.2 states that, looking at a wide range of proxies, the past 6000 years have shown a gradual "neo-glaciation."  So, yes, we absolutely need explanations for why we find such a sharp reversal of this trend in global temperatures.  

Furthermore, it is completely misguided to attempt to use paleoclimate data to suggest that current warming is not anthropogenic.  We don't believe warming is anthropogenic because it's "unprecedented", we believe it's anthropogenic because of well-established physics (see: How We Know Recent Warming is not Natural).

There are reasons that we look to the top experts in various fields.  They are the people who have a deep understanding of the areas of science on which they are commenting.  I am quite confident that Dr Hall commands great respect in his own field.  I would never presume to denigrate Dr Hall on matters of nanotechnology, AI or microprocessor design.  But with all due respect, expertise in one field does not make one an expert in all fields of science.  This is made abundantly clear in Dr Hall's original article, as well as his rebuttal.

0 0

Printable Version  |  Link to this page

Comments

Comments 1 to 27:

  1. A Commenter at WUWT suggested that there should be more "rebuttals" of Skeptical Science. I too would love to see them engage in such a scientific debate rather than do as the site owner does and cast insults at the site and it's content. SS does exactly what these people have asked for and scientifically and robustly deals with their so-called counter evidence to which they seemingly can respond only with taunts and ad hom. I invite anyone to compare the two sites, the content and the commentary objectively and decide for themselves which genuinely engages in real, scientific debate.
    0 0
  2. "There are reasons that we look to the top experts in various fields. They are the people who have a deep understanding of the areas of science on which they are commenting. I am quite confident that Dr Hall commands great respect in his own field. I would never presume to denigrate Dr Hall on matters of nanotechnology, AI or microprocessor design. But with all due respect, expertise in one field does not make one an expert in all fields of science. This is made abundantly clear in Dr Hall's original article, as well as his rebuttal." We see too much of this; e.g. Freeman Dyson and others. This paragraph sums it up very succinctly and accurately and should be posted in bold on the home page of this website for future reference and use. It should also be tattooed on the foreheads of any number of "skeptics" e.g. Inhofe, et al. Great post!
    0 0
  3. Hall's original thread had comments on it to the same effect, pointing out the regional nature of the GISP2 data and the mistake in dating. One wonders why Anthony Watts doesn't comment on these basic mistakes made by his guest commentators, like an [Editor's Note: ...] sort of thing. This same vein of goof-up happened after Hall's original post when Don Easterbrook made similar mistakes (and sometimes to a more egregious extent), even when the comments for Hall's thread had pointed out the dating error. One might also wonder why Watts uses such non-experts as guest posters in the first place. It doesn't certainly doesn't seem to serve the aim of spreading accurate climate science information to the public. Quite the opposite: I've had to correct mistakes about GISP2 data in more than one place after a guest post on WUWT mangled it. And I'm not even a scientist.
    0 0
  4. Once someone uses the term "alarmist" and brings Al Gore into the discussion, they are pretty much exposing themselves. Hall apparently didn't read Alley's comment at DotEarth regarding point #1, since he doesn't address this: "First off, no single temperature record from anywhere can prove or disprove global warming, because the temperature is a local record, and one site is not the whole world. One of the lessons drawn from comparing Greenland to Antarctica and many other places is that some of the temperature changes (the ice-age cycling) are very widespread and shared among most records, but other of the temperature changes (sometimes called millennial, or abrupt, or Younger-Dryas-type) are antiphased between Greenland and the south, and still other temperature changes may be unrelated between different places (one anomalously cold year in Greenland does not tell you the temperature anomaly in Australia or Peru). After scientists have done the hard work of working out these relations, it is possible to use one ice-core record to represent broader regions IF you restrict consideration to the parts that are widely coherent, so it is O.K. to plot a smoothed version of an Antarctic temperature record against CO2 over long times and discuss the relation as if it is global, but a lot of background is required." Seems the details of this could be expanded on in another post. One interesting part of Hall's "rebuttal" is he changes the timescale by an order of magnitude from 10,000 years (his original post) to 100,000 years, so the goalposts shifted quite a bit. It's impossible to note any correlation from the graph over the last 10,000 years. Hall also claims Vostok shows the Younger Dryas event, but remove the artificial scaling done on his doctored graph, temperature change is magnified considerably. And did he shift the x axis as well?
    0 0
    Moderator Response: [Daniel Bailey] "Seems the details of this could be expanded on in another post. " This is in the works.
  5. Greenland is an island partially surrounded by perennial sea ice and often exposed to the apparent vagrancies of sea and atmospheric currents. So it is quite possible to see changes in the Greenland record dramatically more variable than a global record. Without engaging with that subtantially I am at a loss as to what point Dr Hall was trying to raise.
    0 0
  6. Nice response Rob. I think it's pretty clear that Hall's original analysis and "rebuttal" were of extremely poor quality. It seems to be a rather convoluted misuse of GISP2 to argue that current warming isn't "unprecedented", therefore it's not anthropogenic. Even if the current warming isn't "unprecedented", that logic is like saying arsen is impossible because fires are known to start naturally. Only when investigators look carefully at all the evidence can they determine if a fire was started 'naturally' or by humans. Same thing with global warming. You have to look at the cause, not just the effect.
    0 0
  7. Combining multiple locations and proxies in the Arctic and including the recent temperature average... Arctic Warming Overtakes 2000 Years of Natural Cooling At least for the last 2000 years and averaged over broader Arctic region, recent warming is very much unprecedented, and as we know, this conclusion can be extended to northern hemisphere average with fairly high confidence.
    0 0
  8. "Dr Hall's closing statement is "The 20th-century warming was hardly unprecedented, and doesn’t call for unusual explanations." This statement is completely unsupportable by the evidence Dr Hall is presenting. It would require that he perform a much more detailed study of a wide range of records to make such a statement. It is impossible to determine this from GISP2 alone" (from above article) I did find this article. I do not know how valid it is but the claims made in the arcticle would indicate our current warming is most insignificant of what has happened. I will link the article, maybe it is a bogus piece. This is always a good place to post such links as many intelligent minds will be able to determine it worth. Article with claims of much greater temp variations. For those not linking to the article. Here are some claims. "On two occasions between 135,000 and 110,000 years before present (BP), temperatures dropped from 2C warmer than they are today to 5C cooler in less than a few centuries. In one instance the temperature dropped 14C in a decade and returned to its former level 70 years later." Much greater temp change than anything today and without CO2 so if legite, what caused these massive temp fluctuations?
    0 0
  9. Norman... I haven't read the article you link to but I think the first question you have to ask yourself is, "Is that a local change in temperature?" Even Dr Alley says that many of the abrupt changes in the GISP2 record are related to a large variety of local events including snow drifts. So, you have to determine whether a temperature change is a climatic change or an event related change.
    0 0
  10. Norman... Reading through this, my first comment is that, it's not a peer reviewed paper but a republished summary. I would want to read the original paper before coming to any major conclusions. Second, I would make note of the fact that the original paper came out in 1999 and, I would assume, based on older data. 1999 is about the time a lot of the ice core data was coming out. Third, again, no one assumes that CO2 is the only driver of temperature change. Large and rapid temperature changes are not proof that current warming is not anthropogenic. Remember Alley's analogy. Just because forest fires happened naturally in the past doesn't rule out arson as the cause of a current fire.
    0 0
  11. i've read the SkC original posting, the WUWT rebuttal and now the SkC rebuttal of the rebuttal and enjoyed all of them and learned some from each. thanks rob for your time in posting these articles. with regard to Dr. Hall changing the scales of the Vostok data to match the GISP2 data i didn't have an issue with this. he stated in the rebuttal that he did this and the reason for doing it. the purpose in doing this, as i understand it, was to show that both data sets had similar inflection points and showed common periods of warming and cooling. and the fact that greenland and antartica showed similar trends speaks to the theory that maybe both local temperature sets give a picture of the entire global temperature trends. Dr. Hall also notes that there are periods where the two set diverge in their trends as you stated in this post. and with regard to unprecedented temperatures of the 20th century - i'd say that antartica has seen warmer temperatures as the vostok data shows. but i agree with the posting here that you can't take that local temperature set and extrapolate that to the rest of the planet. but to my knowledge there isn't another proxy that dates back as far as these ice cores so until we get that for another part of the globe it must be feasible that the rest of the earth was warmer than the 20th century during these periods shown in the vostok data. if there are other proxies that show data contrary to this i'd appreciate a link so i can check it out. i'm trying not to get OT here but i'm trying to raise the point that since we are data limited for these long times in the past we can't rule something out that is supported by the only data we have.
    0 0
    Moderator Response: [Daniel Bailey] Your linked image is behind a firewall, causing SkS users to input a password; as such the link was deleted. If you can find a version openly available, please re-link to it. Thanks!
  12. "between 135,000 and 110,000 years before present ... temperatures dropped from 2C warmer than they are today to 5C cooler in less than a few centuries" You really have to look carefully at time resolution for events that old. Do the original data justify hundred year resolution at >100k yr bp? "massive temp fluctuations" Even in GISP2 temp data, the big warmup from about 12.5kyr bp to 10.2kyr bp was 'only' ~17C in 2300 yrs, about 0.07C/decade. We're doing 2x that globally now; 5x that in the northern hemisphere.
    0 0
  13. #9 and #10 Rob Honeycutt, I found the original document for the summary. It seems as if the authors are referring to Global temps. They use many sources for their claims as described in the full length article. Link to Document for Rob Honeycutt.
    0 0
    Moderator Response: [DB] Fixed link html tag.
  14. Norman @8, the claim you report is a summary of a claim on page 69 of this article (PDF). The data on which the claim is made is again Greenland icecores, so this is a variation in regional temperatures rather than global temperatures. Further, it is explicitly referenced to Dansgard et al (1993), "Evidence for instability of past climate from a 250-kyr ice-core record" (Published in Nature). This is, of course, another regional temperature fluctuation, not a global temperature fluctuation, and is probably associated with shutting down the thermo-haline circulation.
    0 0
  15. Further to 13, Dansgaard et al (1993) describes the GRIP Summit Ice Core. It does not mention the cooling events in the Eemian that you referred to, although it does mention two others, one lasting 2 thousand and the other lasting 5 thousand years (page 220). It also compares the GRIP Summit core with temperature proxies from Nevada (Devil's Hole), data from the SPECMAP project (a global series of ocean sediment data), data from the Vostok Ice Core, and data from DSDP-609 (Between Labrador and Ireland, and South of Iceland) supplemented with sediment data of the coast of Ireland. Of these, only the North Atlantic sites (GISP, DSDP-609, and the sediments of Ireland) show the fluctuations, and only GISP shows fluctuations of such magnitude. These are definitely regional fluctuations in temperature, not global.
    0 0
  16. Sorry, I missed pointing out that Bluemle et al cite Dansgaard et al. for the claim (p 69). As a further note, the GRIP data has a time resolution of only 200 years per data point at that period, so could not show a three data point variation in 80 years in any event.
    0 0
  17. 7 NYJ : as far as i can see, in this graph, the PROXY (not instrumental but reconstructed) temperature raises only in the first part of the XXth century, when anthropic forcings are supposed to be hardly measurable, and stop climbing when anthropic forcings are supposed to become dominant. Any explanation for that ? about changing scales : why is it inappropriate to demonstrate a CORRELATION ?
    0 0
  18. modes... I'm getting an error from garythompsons graphics link to ftp://webpages.charter.net/vostok%20plot.jpg which is requesting a password!
    0 0
    Moderator Response: [DB] Thanks for bringing that to our attention. I was wondering why I was getting that prompt all of a sudden.
  19. Gilles @16, it is nonsense to suggest that anthropic forcings are hardly measurable in the first part of the 20th century. Forcings due to the green house effect are approximately constant for each doubling of concentration of the greenhouse effect. That means the 35 ppm increase in CO2 from approx 1850 to 1960 (12.5% increase) generates the same forcing as the 40 ppm increase from 1960 to 1990 (12.5% increase). So while the GHG forcing in the second half of the 20th century relative to the first half is larger than the forcing in the first half relative to the preindustrial era, it is not much larger. Deniers often misrepresent the findings of the IPCC that the warming in the first half of the 20th century cannot be unambiguously attributed anthropogenic causes as meaning anthropogenic causes were weak or non-existent at that time - again nonsense if not deliberate deceit. All the attribution result means is that the warming does not lie outside of the 95% confidence interval of natural forcings alone. Consistent with that, anthropogenic forcings have contributed around 40% forcing, with some combination of reduced volcanic activity and increased solar activity contributing the rest. In the second half of the twentieth century, volcanic activity has been high, and solar activity slightly reducing, so that natural forcings alone would lead us to expect a cooling planet. However, despite the fact that in the early twentieth century, substantial anhropogenic forcings worked with natural forcings to drive up temperature, while natural forcings worked against anthropogenic forcings as they drove up temperatures in the second half of the 2nd century, and contrary to your claims, the longest and steepest climb in temperatures in chart @7 is clearly in the instrumental record of the second half of the second century. You are entitled your own theories, but not your own facts.
    0 0
  20. My apologies for pasting the wrong link to my post in #11. the correct graph is here:
    0 0
  21. Norman @ 13... Read that paper just now. It strikes me as fairly dated already. It's also seems to fall short of being a full paper on temperature reconstruction. They're kind of piecing together various different parts of other papers in order to make a conclusion on holocene temperatures. The conclusion is fairly pedestrian... "Even though there are anthropogenic sources of GHG's such as CO2, climate changes must be judged against the natural climatic variability that occurs on a comparable time scale. The LIA, the MWP, and similar events are this natural variability. These events correspond to global temperature changes of 1-2C. The frequency, rate, and magnitude of climate changes during the holocene do not support the opinion that the climatic changes observed during the last 100 years are unique or even unusual. Recent fluctuations in temperature, both upward and downward, are well within the limits of observed nature." This is hardly news, even in 1999. It's widely accepted that climate changes. It's widely accepted that there are a range of mechanisms that force changes in climate. You have to step back for a moment and consider the alternative position. If we have introduced an additional radiative forcing of ~1.5W/m2 through an enhanced GHG effect (which is widely accepted on both sides of the debate), why would that NOT translate into the increased warming we've seen in the past century? 1) What would be damping the GHG forcing, and 2) What would be the natural mechanism driving the warming? This is why so much money has gone into climate research over the past 2 decades. We have to know if this is real. The conclusion that is coming out in the research is that, we can NOT account for current warming through other natural mechanisms and we are warming the planet through our use of fossil fuels.
    0 0
  22. garythompson @11, you asked if any other proxy's date back as far as the ice cores. The following proxy is from 40 deep sea drilling projects, so it has a fair claim to in fact representing global temperature changes: This focuses on the last 400 thousand years. The top image is from Antarctica (Dome C), while the bottom is a detail of the above drill data. The blue line is the calculated temperature based on known forcings with a climate sensitivity of 3. Focusing still closer, we have the and of the last Glacial, and the Holocene. On the left had side, blue is Vostok, Green is Dome C, and red a closer detail of the deep sea data. On the right, the three lines represent three different ocean basins. In the second two graphs, ice core data is scaled by multiplying by 0.5, and deep sea cores by multiplying by 1.5. This is justified, in part in that the ocean depths do not exhibit as much temperature variation as the surface, and the poles exhibit more than the tropics, and hence the global average. Of course, you may wish to argue that the antarctic data should not be scaled so drastically. Just remember that you will need to scale the climate sensitivity with the antarctic data. Thus if you insist the Antarctic data is representative of global temperatures without need to scale, then you are committing yourself to a climate sensitivity of 6. All graphs come originally from Hansen and Sato 2011.
    0 0
  23. Gilles (#17), The instrumental record appears to extend another decade. Note the recent decade is more than 0.5 C warmer in the Arctic regions than the previous one. 2000-2009 compared to 1990-1999 I often see contrarian types remove the instrumental record entirely, which often means cutting off 30-50 years of data, then claiming MWP was warmer than the "recent period". See also: Kaufman 2009 A few of the proxies appear to be high latitude tree rings, which might have the modern divergence problem Regarding scaling, if the purpose is to just show a correlation, there's no need to do the scaling, unless one is trying to greatly exaggerate very weak correlations. Scaling is appropriate if you have entirely different unrelated measurements, such as temperature vs TSI. Furthermore, Hall doesn't even accomplish showing a correlation in the context of his initial graph. Recall that his initial graph focused on the recent 10,000 year period. From his new "correlation" graph, which increases the time scale by an order of magnitude, the last 10,000 years are just a blur, and finding any correlation over that period is impossible. Also note that Hall is ultimately claiming recent global warming is not unprecedented, and using the scaled graph to support the idea that there were steep variation in other regions. To follow his lead, maybe we should scale recent global temperature changes 5x, which would show 4 C of warming over the last century. On a related note, there's an important distinction between "recent warming" and "recent warmth", which can be mistakingly used interchangeably. One refers to rate of change and the other to magnitude. It's easy to show "recent warmth" is not unprecedented. The Holocene peak was possibly a little warmer than recent temperatures, and of course millions of years ago when dinosaurs roamed the Earth it was considerably warmer. Hall uses the phrase "recent warming". Over the last 2000 years, there has not been a rapid rise in temperature
    0 0
  24. Finishing my last paragraph... On a related note, there's an important distinction between "recent warming" and "recent warmth", which can be mistakingly used interchangeably. One refers to rate of change and the other to magnitude. It's easy to show "recent warmth" is not unprecedented. The Holocene peak was possibly a little warmer than recent temperatures, and of course millions of years ago when dinosaurs roamed the Earth it was considerably warmer. Hall uses the phrase "recent warming". Over the last 2000 years, there has not been a rapid rise in temperature over a century equivalent of the last century. There are rare events in geological time that I believe exceed the rate of recent change. Although a cooling event, and mainly localized, it seems Younger Dryas would be a candidate. Such natural events also would be very likely detectable today. There's no natural mechanism that explains recent warming.
    0 0
  25. Just to add a little perspective... here would be a more appropriate combining of the GSIP2 and Vostok data: 
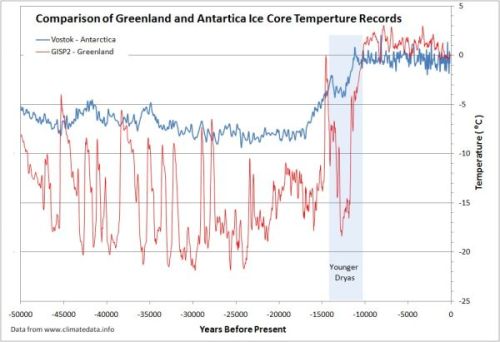
You can see how there is a very broad correlation between the two but for the most part only in terms of timing for when we come out of the last glacial. The temperature swings in the GSIP2 record are extreme compared with the Vostok record. By stretching the Vostok record to fit the GISP2 scale Dr Hall is hiding a tremendous amount of information about how these two records relate to each other. If you look closely at the early holocene you can see that one huge jump in the GISP2 data is clearly antiphased with an equally profound response in the Vostok record. So, the one event in the GISP2 record that shows a greater temperature trend that the current warming has a counter response in Antarctica. I'm still looking into Bond events, but I believe that is specifically called Bond event 5 at 8200 years BP.
    0 0
  26. Yup. Here it is... Bond event 5:
    0 0
    Moderator Response: [DB] Fixed image.
  27. Here is a detail of Rob Honeycutt's image @25 so that the extent to which temperature fluctuations in northern and southern polar regions are antiphased during the Holocence can be clearly seen: 
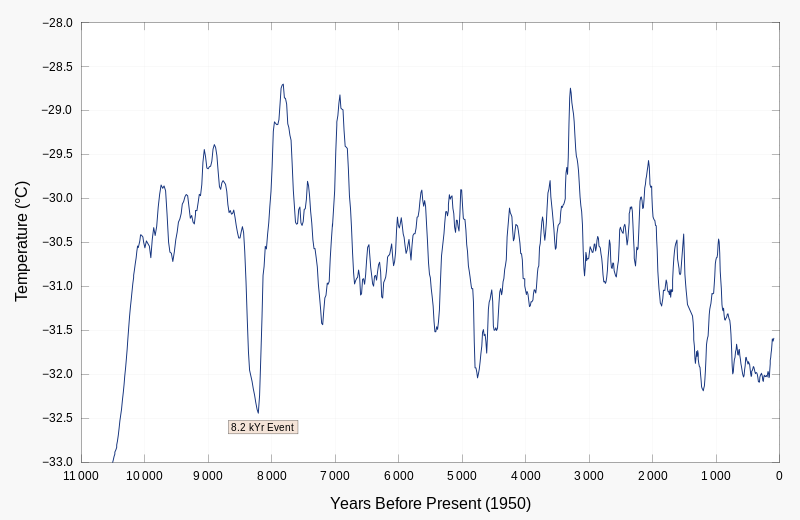
And for completeness, ice cores over the Holocene for a Greenland, a Northern Chinese (Northern Hemisphere), two Andian (Tropcical), and two Antarctic (Southern Hemisphere)to give some idea as to the extent of regional variability involved:
    0 0

You need to be logged in to post a comment. Login via the left margin or if you're new, register here.


The Consensus Project Website

THE ESCALATOR

(free to republish)


© Copyright 2024 John Cook
Home | Translations | About Us | Privacy | Contact Us