


 Arguments


Q&A: Is Antarctica gaining or losing ice?
Posted on 4 November 2015 by Guest Author
This is a re-post from Robert McSweeney at Carbon Brief dealing with recent confusion over a paper claiming Antarctic land ice gains up to 2008
A new study from scientists at NASA has whipped up a storm in the media by claiming that gains in East Antarctica ice have been outweighing losses in the West Antarctic and the Antarctic Peninsula.
The research has been covered widely by newspapers and websites, prompting a range of headlines, from, “Antarctica is gaining ice. Here’s why that’s not actually good news”, in Newsweek to, “Expanding Antarctica eases threat from rising sea levels”, in the Times.
A Daily Express headline even suggested the research questioned the fundamentals of climate change: “What global warming? Antarctic ice is INCREASING by 135 billion tonnes a year, says NASA.”
With other outlets reporting that scientists are disputing the new study’s results, confusion is rife.
So, what did the study actually find? How does it fit with other research? What does it mean for sea levels? Carbon Brief answers some of the questions the new research raises.
What did the new study do?
The study, published in the Journal of Glaciology, calculates the changes in ice over the entire Antarctic ice sheet from 1992 to 2008. The ice sheet comprises three parts: East Antarctica, West Antarctica and the Antarctic Peninsula.
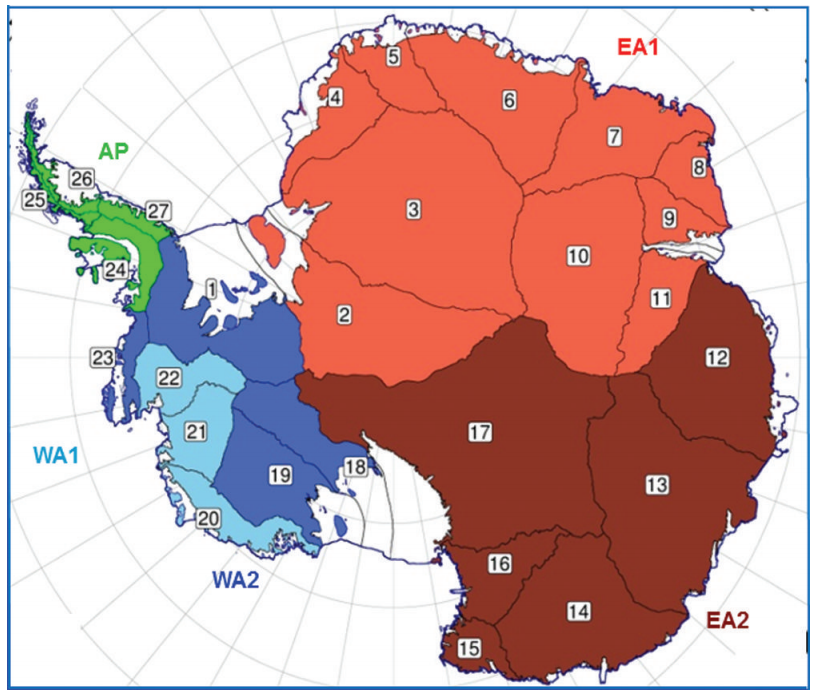
Map of Antarctica and its regions: the Antarctic Peninsula (green), the West Antarctic Ice Sheet (blue), and the East Antarctic Ice Sheet (red). Numbers indicate specific basins within each ice sheet. Source: Zwally et al. (2015)
The researchers use two sets of satellite data: The European Remote Sensing Satellites 1 and 2 (ERS-1/2) covering the period 1992-2001, and NASA’s Ice, Cloud and land Elevation Satellite (ICESat), in operation from 2003-08. These satellites work slightly differently; ERS uses radar altimetry, which means it bounces a signal off the ice sheet to work out how thick it is. The ICEsat satellites use lasers, which fires a beam of light down to the ice to measure its thickness.
The researchers analysed these two datasets, correcting the data for other factors, such as uplift or sinking of the land surface, to produce their estimates for how the ice sheets changed during the two time periods.
What does the study say about different parts of Antarctica?
As you can see from the map below, the changes in ice mass has varied quite a lot over the different regions of Antarctica over the 17 years the study covers. The left-hand map shows changes between 1992-2001, and the right-hand map shows changes between 2003-08.
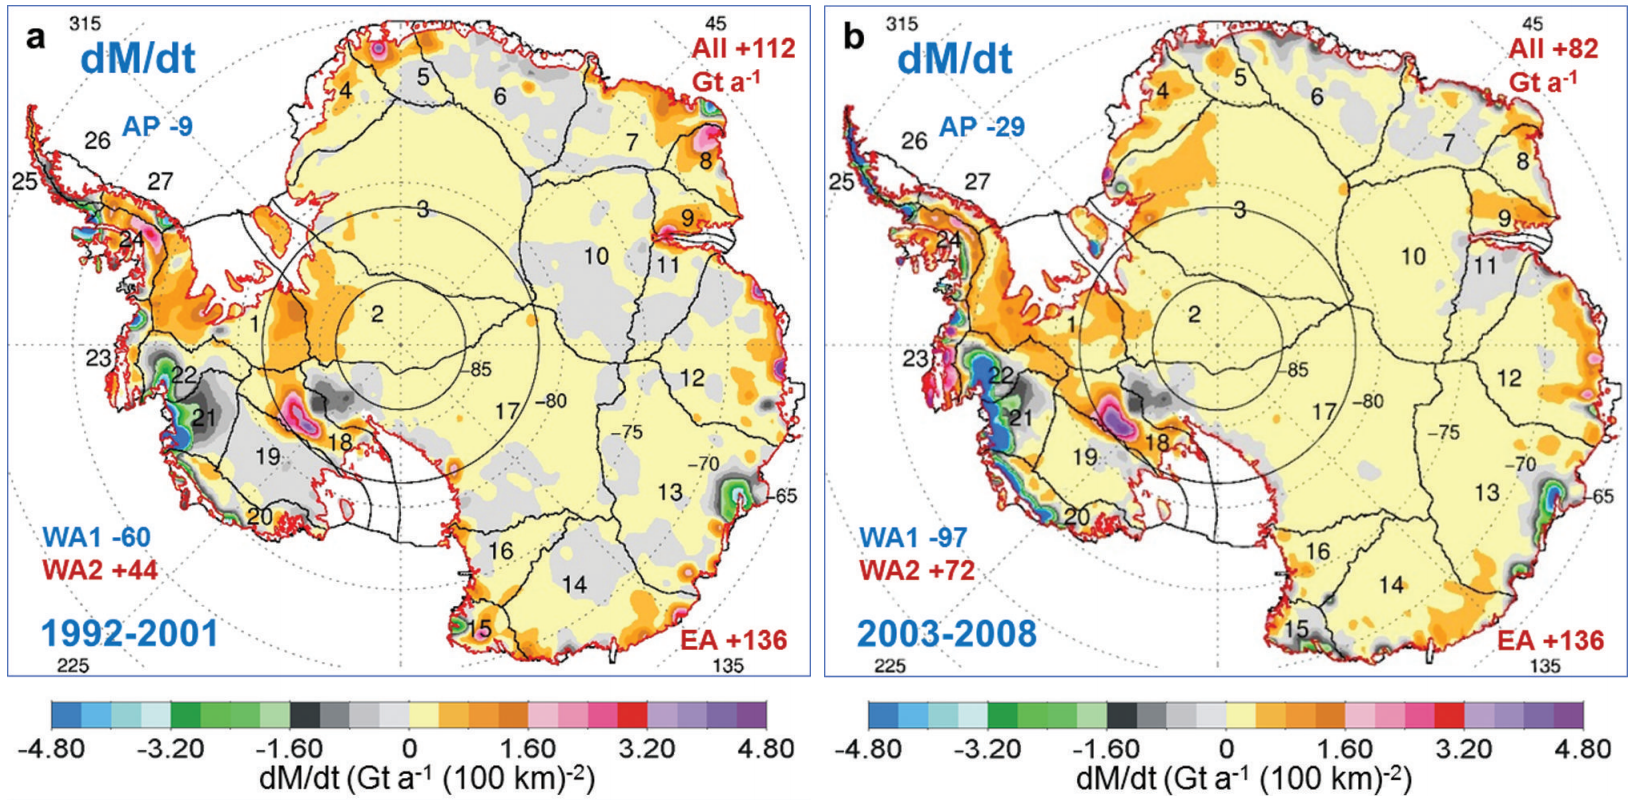
Change in mass of Antarctic ice over a) 1992-2001 and b) 2003-08. Shading indicates losses (black, green and blue) or gains (yellow, pink and purple) of ice. Figures in bold text indicate overall change for each part of the ice sheet, with losses in blue text and gains in red. Source: Zwally et al. (2015)
On the peninsula, the study shows an acceleration of ice loss from 9bn tonnes a year over 1992-2001, to 29bn tonnes during the more recent period, 2003-08. The data suggest ice has thinned by 2.2cm and 9.8cm per year for the two periods, respectively (see map below).
For the West Antarctic Ice Sheet (WAIS), it’s a mixed picture. Some regions, such as the Pine Island glacier (region 22 on map) and the Thwaites and Smith glaciers (region 21), show losses totalling 97bn tonnes per year over 2003-08. You can see these as black, green and blue shaded areas on the maps above. Meanwhile, the study says other parts of the WAIS have accumulated around 72bn tonnes per year at the same time, resulting in an overall ice loss of 25bn tonnes each year.
For the vast expanse of East Antarctica, there has been a consistent thickening of ice over both time periods of 136bn tonnes per year, the study says. Losses in some areas have been outweighed by small gains across most areas, meaning on balance, extra ice has added an average of just over a centimetre of ice across the sheet, say the researchers.

Change in thickness of Antarctic ice sheet over a) 1992-2001 and b) 2003-08. Shading indicates losses (black, green and blue) or gains (yellow, pink and purple) of ice. Figures in bold text indicate overall change for each part of the ice sheet, with losses in blue text and gains in red. Source: Zwally et al. (2015)
What does it say about Antarctica overall?
The study concludes that the gains in ice over East Antarctica outweigh the losses on WAIS and the peninsula between 1992 and 2008.
This is what prompted the headlines in today’s papers.
So, where is this extra ice on East Antarctica coming from? The researchers say it all started around 10,000 years ago, at the end of the last Ice Age. As the air warmed up, it could hold more moisture, and the amount of snow that fell onto the ice sheet doubled. Since then, this extra snow has gradually been compacting into ice, making the ice sheet thicker.
A small amount of thickening spread across most of East Antarctica translates to a lot of ice gained. Even a recent decrease in snowfall hasn’t slowed down this long-term process, they say.
But the gap between ice gained and ice lost is getting smaller. Between 1992 and 2001, the net gain was 112bn tonnes a year, the paper finds. This dropped to 82bn tonnes between 2003 and 2008. If ice loss from WAIS and the peninsula continues to accelerate, this gain would soon be reversed, lead author Dr Jay Zwally said in a NASA press release:
I don’t think there will be enough snowfall increase to offset these losses.
What’s important to note here is that the study ends in 2008, and there is evidence that ice loss in some regions has, indeed, accelerated since then.
What does the latest data show?
Some of the more recent studies use the CryoSat-2 satellite, which was launched in 2010. A paper published in July analysed the first three years of this data, and finds that between 2010 and 2013, West Antarctica, East Antarctica, and the Antarctic Peninsula lost 134bn, 3bn, and 23bn tonnes of ice per year, respectively.
A paper based on the same data found that the volume of ice lost from the WAIS has trebled between 2003-09 and 2010-14. The study also notes that although ice on some parts of the East Antarctica has thickened, the gains only partly compensate for the losses elsewhere on the ice sheet.
Another study published earlier this year finds that multiple glaciers in the southern Antarctic Peninsula have started thinning more rapidly, from no net ice loss during the 2000s to 56bn tonnes per year since 2009.
And research published last year suggests that retreat of major glaciers on the WAIS are now past the point of no return, potentially leading to the eventual collapse of the entire WAIS in the centuries and millennia to come.
In other words, there have been a lot of changes in Antarctica over the last seven years that the NASA study hasn’t included.
Can we trust the new study?
Measuring ice changes on Antarctica has long been problematic – particularly on East Antarctica. The many different satellite missions of different durations makes it tricky to get a consistent view of what is happening to the ice sheet.
The findings of the new NASA study are “at least somewhat at odds with multiple lines of other evidence,” says Prof Richard Alley from Penn State University, who wasn’t involved in the research. He points to another recent paper – which some of the authors of the new study also contributed to – as the current scientific consensus on ice loss from Antarctica. That paper found changes between 1992 and 2011 of +14bn, -65bn and -20bn tonnes of ice per year on East Antarctica, West Antarctica, and the Antarctic Peninsula, respectively.
Prof Andy Shepherd from the University of Leeds, who led the study that Alley refers to, says the NASA study attempts the difficult job of accounting for snowfall, which can mask changes in ice sheet thickness. He tells Carbon Brief:
It’s right to attempt this, but in places where nothing much happens – like the interior of Antarctica, which is a vast a desert – it’s really quite difficult to be sure that snowfall can be simulated with enough precision to detect ice imbalance.
Prof Jonathan Bamber, a professor at the University of Bristol whose work focuses on satellite monitoring of the ice sheets, says there are also potential pitfalls in combining radar and laser satellite data for the two different time periods, as the NASA study does. He tells Carbon Brief:
At a whole ice sheet scale, the results between the two time periods that they study appear to be consistent. But when you start to look at a slightly smaller regional level – and I’m still talking about thousands of kilometres – then it is doesn’t appear to be quite so consistent, and that is a bit of a worry.
Nonetheless, Bamber says, the reasons the researchers give for inconsistencies in previous estimates of ice changes on Antarctica and why their estimates are different, are “completely plausible”.
Does it challenge the IPCC?
The NASA press release claims the study “challenges the conclusions of other studies, including the Intergovernmental Panel on Climate Change’s (IPCC) 2013 report, which says that Antarctica is overall losing land ice”.
In its Fifth Assessment Report (AR5), the IPCC concludes that, based on the evidence available, Antarctica is losing ice:
Overall, there is high confidence that the Antarctic ice sheet is currently losing mass.
While the new study isn’t consistent with the latest IPCC report, says Bamber, it has to be interpreted in light of many other studies that have given different results.
The IPCC process draws conclusions based on the research available at the time. It also includes all available research published up to 2012, covering multiple satellites and their various techniques. The new study will be one of the many studies that feeds into the next assessment report.
Does it give a reason not to worry about climate change?
No.
The new study doesn’t contest that global sea levels are rising. Rather, it says that if Antarctica is getting thicker overall, the 0.27mm per year that scientists thought the ice sheet was contributing to sea levels must instead be coming from elsewhere.
As Alley puts it:
What is absolutely obvious is that this does not in any way mean that we don’t need to worry about sea level rise from our warming.
It will take a number of other studies, both satellite and on-the-ground research, to confirm if the new NASA study is correct about East Antarctica. If it is confirmed, it will still only apply up to 2008, not to the present day. This limits how much it can usefully tell us, Alley concludes:
While the new work will feed into the next assessments, I don’t see anything in it that really changes our overall picture that we face future sea level rise from our warming, nor does this do much to the best estimate of how much rise we face.
Help us do science! we’ve teamed up with researcher Paige Brown Jarreau to create a survey of Skeptical Science readers. By participating, you’ll be helping me improve SkS and contributing to SCIENCE on blog readership. You will also get FREE science art from Paige's Photography for participating, as well as a chance to win a t-shirt and other perks! It should only take 10-15 minutes to complete. You can find the survey here: http://bit.ly/mysciblogreaders. For completing the survey, readers will be entered into a drawing for a $50.00 Amazon gift card, as well as for other prizes (i.e. t-shirts).


This new NASA report just points out that we can't rely on bets and pieces of data on global warming (GW). It is a global phenomenon, as the name implies, thus we need a global indicator to measure it. Global mean sea level rise is the best such indicator. It is clearly rising and maybe accelerating. The only thing can through it off is increased snow (ice) accumulation on Antrctica, which removes sea water from the oceans and deposites it in frozen form on the huge land area of Antrctica. - - This phenomenon could lead to a potential geoengineering solution to reduce SLR by pumping seawater onto the Antarctic ice sheet that would freez and stay there for centuries or milenias (The average surface temperatures over most of Antractica are well below freezing year around and likely to stay there even with much more GW). I call this idea the Ice Build Up Concept (IBUC). It would be costly and challanging, but from an engineering standpoint it is feasible. And if we consider the socio-economic costs of potential multi-meter SLR, what is "costly"? I have proposed it to the NSF, but they are not interested in geoengineering solutions.
Correction: In comment 1 - Typo: ...through... should read ...throw...
Hmmm, pumping Gts of relatvely warm salt water directly up onto the East Antarctic ice sheet. Now what could possibly go wrong with that?
This is what I love about science... I observe something and make an hypothesis. Jon observes something different but related - he proposes an alternative hypothesis that is not ncessarily in conflict with me.
Unfortunately the rest of the story is not quite as wholesome:
Mine and Jon's hypotheses are not necessarily mutually exclusive, but someone in an unrelated field eg journalism "detects" a story and posts unscientific crap that mis-represents my and Jon's research to peddle a previously debunked unscientific claim.
Rant over but thank you for a most informative post - I had wondered how the "mismatch" would be resolved.
This paper is nearly identical to one publish in 2012 that did not receive as much attention. But something else may be going on:
"The paper also pointed out the difficulties in measuring the height of ice in Antarctica, saying that improved tools are needed to better perform the task.
The US space agency is currently developing a new satellite capable of a more accurately measuring long-term changes in ice in Antarctica.
ICESat-2, which will be able to “measure changes in the ice sheet within the thickness of a No. 2 pencil,” is planned for launch in 2018, according to NASA glaciologist Tom Neumann."
Source: https://www.rt.com/usa/320554-antarctica-gaining-ice-nasa/
This paper is seeking support for a follow-up satellite mission, ICESat-2. Whether or not it works, is another question. Just Antarctic accumulation of snow from warmer seas and the higher humidity has long been predicted in the model reports I've read.
Regarding my idea (Comment 1.) of slowing or stopping SLR by pumping sea water onto the Atarctic ice shield to freez (btw, it would be easier to do it on the WAIS and it may help buttressing glaciers and high speed ice flows), but Jim Eager's comment (3.) is right, a lot could go wrong. That is why I am proposing that we should start testing the IBUC on small scale in connection with the current WISSARD project of NSF along the grounding line of the Ross Ice Shelf. There are a lot of unknowns and risks, but unlimited SLR is a certain global desaster in time. Does anyone believe we will be able to reverse GW by GHG reduction? I don't. I believe we be lucky if we can limit GW to 3 - 4 C by 2100. But even if we could stay below 2 C, Ocean waters will continue to stay warm for centuries, especially if projections of an extra long interglacial period are right. SLR is a problem that needs geoengineering solutions. We have time to develop them, but we better start now. Anyone has a better idea?
I think understand the limitations/concerns with altimetry based datasets that this group used for measurement of ice gains/losses.
Thus, how do these new data coincide with the GRACE datasets, which show significant mass-losses from the Antarctic region?
Is it plausible that we have less-dense snow and ice, which is showing 'more ice' from altimetry, but the gravitational data is still correct in showing actual mass losses from the continent? The gravimetric data have lower spatial resolution than the hi-res altimetry, so it's more challenging to tell where the ice losses/gains are using that method, but if the two methods are showing vastly different directions (GRACE shows losses since 2002), there is clearly an underlying assumption that is incorrect, or an error that is unaccounted for.
From my physics background, the gravimetric data do not 'lie'; if you are detecting lower mass, there simply HAS to be less ice. The altimetry data are inferring mass based on height variations, and perhaps the density variation in the ice is bigger than people have assumed....
Anyone w/ some 'real' glaciology background able to 'weigh in' (pun intended) on this?
Sifeher, you are aware that the average elevation of the East Antarctic ice cap is 3000 meters, and that most of it lies above 2000 meters, right? Please tell me that you've done the math to calculate the energy requirement to pump a Gt of water that high.
Sifeher,
Please calculate how much water you could pump up 1,500 meters using all the power produced by five 1000 MW nuclear reactors (cost $50 billion for the plants alone). Disregard friction in the pipes. Estimate the diameter of the pipes needed and how long they would have to be.
I think you will find that the amount of water that you could theoretically pump unto the top of an ice sheet is so small compared to a 1 cm rise in sea level that it would be a waste of time. Many proposals for geoengineering fall over because of the immense size of the ocean and the enormous amount of energy that has to be removed. Proposals to remove CO2 from the air and pump it underground require a business as large as all current companies that remove the carbon from the ground combined.
Cooper13 @8, GRACE measures the mass changes due to the combined effect of Glacial Isostatic Adjustment (plus any other process effecting the altitude of the base rock) plus ice balance. If the baserock of Antartica were sinking, that would confound the results from GRACE. That said, Riva et al (2009) combine GRACE and altimetry data to determine that the GIA adjustment is positive, ie, that the base rock is rising. By their estimate, the effect of the GIA is 100 Gt/year which should be added to the direct GRACE results to get the actual loss in ice mass. That adjustment is uncertain, however. Ivins et al (2013) estimate GIA only contributes 57 Gt/annum to the Antarctic mass gain. Zwally et al list that result (and others) in table 8, having converted it to mm/year uplift. Based on that result and Whithouse et al (2012) who show (according to Zwally et al) 5.4 mm/year uplift, Zwally et al use an estimate of 8 mm/year uplift.
As bwilson4web indicated, this isn't really a "new" study and I don't know why it keeps being referred to as such. It seems to have been a 2012 conference paper, referenced on NASA's Technical Reports Server and also referenced in this 2012 Nature article. True, it may have received a few edits since 2012 but appears to be essentially the same study, by the same authors. Have I missed something or has almost every report on this missed something?
@10, [should I be feeling approximatley apopleptic about now?/]
Si, me gusta etc.........
michael sweet @10.
It would be best to actually demonstrate the calculation rather than leave each visitor to this thread with the task.
Your 5 x 1,000MW power stations would provide some 36TWh per year. To mitigate 1mm SLR requires the removal of 360e12 kg sea water and lifting it 2km requires 20kj/kg or 7.2e18j or 2,000TWh. Note the world(2012) uses 155,000TWh.
Perhaps a bigger problem would be the latent energy this water has to lose to freeze itself - 33,000TWh/mmSLR. (Eternal optimists may dream of this as a source of power for the uphill pumping.) So each kg of pumped water has the capacity of raising the temperature of a kg of ice by 165ºC which means any serious SLR mitigation is going to have an impact on Antarctic climate.
MARodger,
You are correct, I should have done the calculations myself. Thank you for posting the numbers.
As you show, it is impossible to pump enough water to the top of the ice sheet. The additional issue of where the energy would go is also impossible to resolve.
TonyW - While on the very same subject, and with what appears to be the same authors, the more recent paper has a different abstract and different numbers (2015: 82 Gt/yr mass gain vs. 2012: 49 Gt/y, for example) than the conference paper.
It appears to be significantly updated information.
Jim @9, Michael S. @10 &15, MA Roger @14.
Thanks for the comments. The beauty of these blogs is the exchange of ideas and commenting on them, as you have on my wild IBUC.
I did run some numbers, much more need to be calculated and tested. But let me cite a few figures to support the engineering feasibility of my concept. With 50 years of practical engineering experience, I like to base my calculations on actual engineering practice, rather than theoretical computations. I based the IBUC pumping feasibility on the largest actual water pumping installation I could find, the California Aqueduct, which lifts 3.9 cu.km/yr water over the 1,800 ft high Tehachapi Mountains near Los Angeles. It takes 60 MW to power the 14 huge pumps at the Tehachapi Lift Station. From those figures I extrapolated to the approximately 1,000 cu.km/yr (about 1,000 Gtn/yr) water that would need to be pumped out of the ocean to counter the current 3mm/yr SLR. That is about 250 times what is pumped at Tehachapi. That is a lot of water, about 6 times the volume of water in Lake Tahoe. It would flood the California Central Valley (approx. 100,000 sq. km.) to a depth of 1 m.
By the way, I propose to pump the sea water to the top of the ice sheet along the grounding lines of the WAIS, not to the top of the East Antarctica Ice Sheet. The ice sheet surface elevation along the grounding lines of the WAIS, at the foot of the glaciers, is about 200-300 m above sea level. The best test site would be near the NSF's WISSARD project site on the edge of the WAIS as it meets the Ross Ice Sheet. The WISSARD project has successfully drilled through the 800 m thick ice sheet in this area, opening a 12 in. dia. hole with "hot water drilling" technology. I believe that technology could be scaled up to accommodate much larger diameter pumps and with constant pumping the drill shafts could be kept open year around. Remains to be seen, as a lot of things about this idea need to be tested.
My thinking on meeting the power requirement for hot water drilling and running the pumps year around, is to use large wind generators. The largest wind power turbines currently are about 5 MW capacity used in Denmark. It would take a bunch of those, of course, but there is plenty of wind on Antarctica. To power pumps to lift 1,000 cu.km/yr would require roughly 210 GW power based on the Tehachapi experience. That is a lot of power and thousands of giant wind generators would be needed. But is it technically feasible? I believe it is, if we really have to do it.
The latent heat removal from the "warm" sea water issue, raised by MA Roger @14, I believe that the cold winds swooping down from the heights of Antarctic Ice Sheet would take care of that,. This super cold airflow forms thousends of squar kilometers of sea ice every year around the continent several meters thick. Water spilled on the surface of the ice in Antarctica freezes in seconds during all but the middle of "summer" (so I am told - never been there and it's not on my bucket list). I will be the first to admit, that I don’t have all the answers on this concept. That is why I propose that it should be tested at least on a small scale on an actual test site in Antarctica. So far I haven’t found any takers, but at least I received a reply from the “NSF that it does not fund geoengineering projects”. I will keep trying. I hope we never have to use IBUC, but it would be good to have some solutions to SLR available in case we do need it as a last resort.
Tom Curtis @11:
So, if I understand correctly, this new study used the GIA/rebound as a parameter in their altimetry, to 'correct' for that deviation.
But that still doesn't address the question of 'why is the GRACE data showing a significant loss in ice mass' while the altimetry data is showing a gain. If you apply the same GIA assumptions (or, use boundaries of high/low estimates), how would the numbers for past publications using only gravimetric data match up with their equivalent numbers from altimetry?
Using these two different ice-loss estimators (altimetry or gravimetric) cannot show opposite results unless the assumptions being used for one of them are substantially off....
" one of them are substantially off...."
Assumptions or problems with the methodology. But so far not clear. The altimetry method results in issues for the sealevel budget and goes against other studies so I think it will come in for close scrutiny. More science needed.
sifeher @17.
There is an error with your use of the Tehachapi Lift Station. The 60MW (0.53TWh pa) is 60MW for each of the 14 pump units (total 835MW apparently) not 60MW for the whole operation. So your numbers need multiplying by 14 (6.45TWh pa). And if the freezy wind is absent in the summer, the pumps will have to be working faster when the freezy wind is blowing. Do not get carried away with the Antarctic cold. It isn't unlimited. Southern sea ice averages some 7,500Gt and you in some manner will be robbing it of 1,000Gt of freeziness to reduce SLR by 300mm per century (if it goes acording to plan).
MA Roger @20.
Thanks for your comments and corrections. It just makes the challange that much larger, only a question of cost. My whole point in proposing this concept is to suggest a possible solution to SLR in case our grandchildren need it. Something needs to be done because SLR may continue until the next glacesion period which may be many millennia away.
Ma Roger @20.
I rechecked my power numbers and found that I did us 60 MW/pump x 14 x 250 (scale factor) to arrive at the 210 GW power requirement estimate. In my proposed concept, it would require 42,000 wind turbines of 5 MW each to power 3,500 pumps of 60 MW (80,000 hp) each. That would be a mega project. But the task of countering SLR is no small deal any way we look at it. Thanks for your interest and attention to details. I would like to continue our chat via email: sifeher@scdinstitute.org
With carbon dioxide increasing it seems that the world is going to get warmer so I do not doubt that global warming is taking place. However, if ice is melting at the poles and so less radiation is being reflected into the sky will this not decrease the effective sky temperature used to calculate the radiant energy lost by a surface on the ground during the day? Could this significantly decrease surface temperatures of some bodies such as ice (depending on emissivities, etc)? Also, temperature change will effect the temperature of the seawater and this could cause different proportions of microscopic sea life to result. The temperature change and different turbidity of the water will change the reflectivity the absorptivity and emissivity of the seawater. Could this significantly affect energy exchange between earth and space and between seawater and ice? For instance for snow with an effective sky temperature of 230 K I calculate a 13 W/square metre loss in energy, whereas for an effective sky temperature of 250 K I calculate a 48 W/square metre gain in energy. Used absorptivity of snow = 0.28 and emissivity=0.97. Used total solar energy (direct and diffuse) = 300W/square metre. Used surface temp of snow 260 K If you look at figures using this sort of calculation a significant portion (often the larger portion) is due to Tsky (the effective sky temperature). The aborption of total solar energy is actually a lot less than absorption of energy from the atmosphere.