Climate Science Glossary

Term Lookup

Enter a term in the search box to find its definition.

Settings

Use the controls in the far right panel to increase or decrease the number of terms automatically displayed (or to completely turn that feature off).

Term Lookup

Settings


All IPCC definitions taken from Climate Change 2007: The Physical Science Basis. Working Group I Contribution to the Fourth Assessment Report of the Intergovernmental Panel on Climate Change, Annex I, Glossary, pp. 941-954. Cambridge University Press.

Home Arguments Software Resources Comments The Consensus Project Translations About Support

Bluesky Facebook LinkedIn Mastodon MeWe

Twitter YouTube RSS Posts RSS Comments Email Subscribe


Climate's changed before
It's the sun
It's not bad
There is no consensus
It's cooling
Models are unreliable
Temp record is unreliable
Animals and plants can adapt
It hasn't warmed since 1998
Antarctica is gaining ice
View All Arguments...


Username
Password
New? Register here
Forgot your password?

Latest Posts

Archives

Lessons from Past Climate Predictions: Arctic Sea Ice Extent

Posted on 6 October 2011 by dana1981

Predicting the annual Arctic sea ice extent minimum has become a bit of a sport, with many varying groups submitting predictions to the Study of Environmental Arctic Change (SEARCH), for example.  Here we'll examine a few such predictions made for the 2010 and 2011 seasons.

2010

In late 2009 and early 2010, Anthony Watts and Steve Goddard predicted a 0.5 million square kilometers (km) recovery from the 2009 minimum of 5.25 million square km, or between 5.7 and 5.8 million square km.  This was the size of the short-term Arctic sea ice extent 'recovery' from 2008 to 2009, and Watts and Goddard felt it was a good bet that a similar short-term 'recovery' would occur in 2010.  Watts also posted a poll on his website, and nearly 70% of WUWT readers predicted that the 2010 minimum Arctic sea ice extent would exceed that in 2009 (a further 6.8% said it would be "near normal", whatever that means).

Steve Goddard later revised his estimate downward, predicting a 5.5 million square km minimum in 2010 on WattsUpWithThat (WUWT) as late as August 22 of last year.  He later revised his prediction down even further to 5.1 million square km less than a month prior to the actual annual minimum, which occurred on 17 September 2010 (though predicting the minimum 3 weeks ahead of time is less than impressive).

On 26 July 2010, tamino weighed in with his own prediction by fitting a quadratic trend line to the annual September sea ice extent data (Figure 1).

"So here’s a simple projection: I’ve extrapolated the trend line to this year. Which gives a predicted September extent of 4.78 million km^2 (plotted as the red dot on the graph). I’ll call that my forecast for the summer minimum....I expect this summer’s extent to be less than last year’s. I’ll give that an 89% chance of happening."

tamino 2010

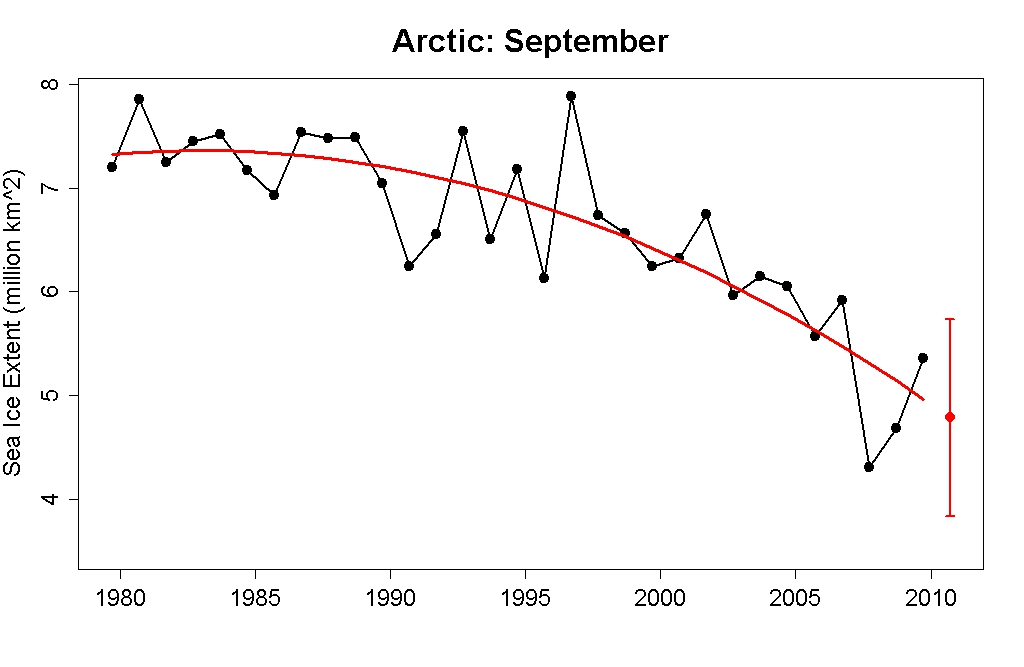
Figure 1: tamino's plot of September Arctic sea ice extent data fitted with a quadratic trend, and his 2010 minimum prediction

Skeptical Science's own Dikran Marsupial advanced his own after-the-fact prediction of 4.93 million square km for the 2010 minimum (Figure 2):

"I obtained from data for Arctic sea ice extent from 1979-2009...I then fitted a Gaussian process model, using the excellent MATLAB Gaussian Processes for Machine Learning toolbox (the book is jolly good as well). I experimented with some basic covariance functions, and chose the squared exponential, as that gave the lowest negative log marginal likelihood (NLML). The hyper-parameters were tuned by minimising the NLML in the usual way."

DM's prediction

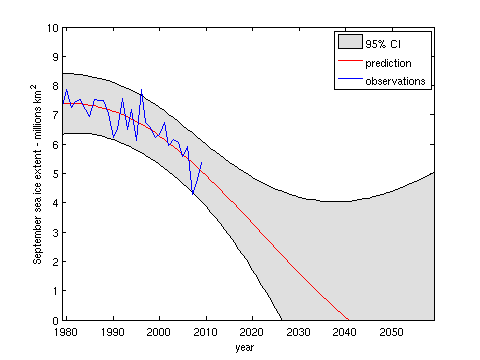
Figure 2: Dikran Marsupial's Arctic sea ice extent model prediction (red line, gray bars) vs. observations (blue)

That's quite a difference, with climate "skeptics" Watts and Goddard initially predicting a minimum 2010 Arctic sea ice extent of 5.75 million square km and 70% of WUWT readers believing it would exceed the 2009 minimum, vs. tamino's 4.78 million square km prediction with 89% likelihood of not exceeding the 2009 minimum, and Dikran's 4.93 million square km prediction.

So who was right?  Not surprisingly, those who used the long-term trend to predict future changes (tamino and Dikran Marsupial).  The actual 2010 minimum was 4.81 million square km.  Goddard and Watts were wrong by nearly 1 million square km (nearly 20%), 70+% of WUWT readers were wrong about 2010 exceeding the 2009 minimum extent, while tamino's projection was almost perfect (his best estimate was off by just 0.6%), and Dikran's best estimate was only off by 2.5%.  Goddard's revised prediction made ~3 weeks before the minimum occurred was also off by 0.3 million square km (6%).

Dikran Marsupial also notes that using a quadratic covariance function yields a very different, "skeptic"-like result of 5.4 million square km for the 2010 minimum, which he notes shows "how sensitive projections can be to the assumptions on which they are based." 

2011

This year, perhaps as a result of their poor 2010 performance, Watts and Goddard declined to make Arctic sea ice extent minimum predictions.  Weatherman Joe Bastardi took up the reins for the optimistic "skeptic" annual prediction.  In a video you can watch via Climate Progress and Neven's Arctic Sea Ice blog.  Bastardi claimed:

"we're gonna recover dramatically here with the cold that is coming over the next 9 to 12 months.  I think next year you're going to see the latest start to the sea ice melt that we've seen in a long time"

In the video, Bastardi created a hand-drawn graph to illustrate his 2011 Arctic sea ice extent prediction (Figure 3).

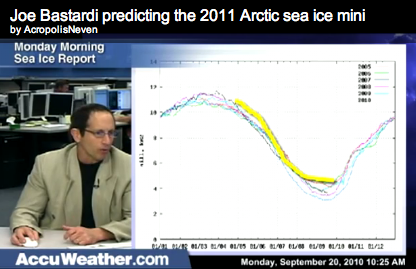
Figure 3: Joe Bastardi's hand-drawn 2011 Arctic sea ice extent prediction (made on 20 September 2010).

Here Bastardi is using an Arctic sea ice extent graph from DMI, whose data only extend back as far as 2005.  We'll instead use JAXA, whose data extend back to 2002 (and whose data are easier to obtain).  Bastardi clarified his prediction in a comment published on WUWT:

"My forecast for next year is for sea ice to melt only to levels we saw back in 2005, or 06. If I had to put a number on it, I think it would be around 5.5 at its lowest"

WUWT readers mirrored Bastardi's 2011 minimum prediction, after taking a vote in May 2011 and submitting their prediction to SEARCH in June 2011, summarized by Watts:

PAN-ARCTIC OUTLOOK – WUWT (acronym for WattsUpWithThat.com)
1. Extent Projection: 5.5 million square kilometers

2. Methods/Techniques: web poll of readers

3. Rationale: Composite of projections by readers, projection bracket with the highest response is the one submitted.

4. Executive Summary: Website devoted to climate and weather polled its readers for the best estimate of 2011 sea ice extent minimum by choosing bracketed values from a web poll which can be seen at: http://wattsupwiththat.com/2011/05/19/sea-ice-news-call-for-arctic-sea-ice-forecasts-plus-forecast-poll/

15.64% chose 5.5 million km2 or greater, with 13.09% choosing 5.0 to 5.1 million sq km2 as the second highest vote.

5. Estimate of Forecast Skill: none

The WUWT prediction was the second-most optimistic prediction submitted to SEARCH in June 2011. 

In October 2010, tamino also made a 2011 Arctic sea ice extent minimum prediction again based on extrapolation of a quadratic trend (Figure 4):

"Now that NSIDC data for this September are available, I’ll do as I did before: fit a quadratic trend to the September average data from NSIDC, then use that trend to predict that next year’s September average from NSIDC, and next year’s JAXA minimum, will be 4.63 +/- 0.9 million km^2. After all, the best predictor of future behavior is past behavior: the trend continues."

tamino prediction

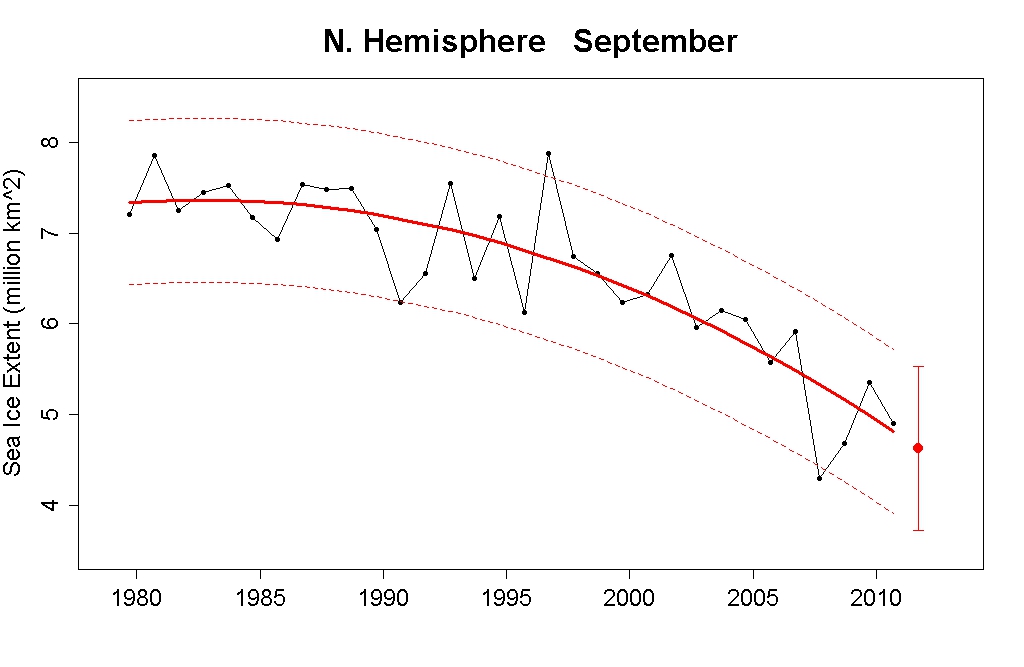
Figure 4: tamino's plot of September Arctic sea ice extent data fitted with a quadratic trend, and his 2011 minimum prediction.

Dikran Marsupial's model (Figure 2) predicts a 4.77 million square km minimum for 2011.  Figure 5 is an approximate re-creation of Bastardi's hand-drawn prediction, placing the 2011 minimum at 5.5 million square km, plus WUWT and tamino's predictions.

predictions

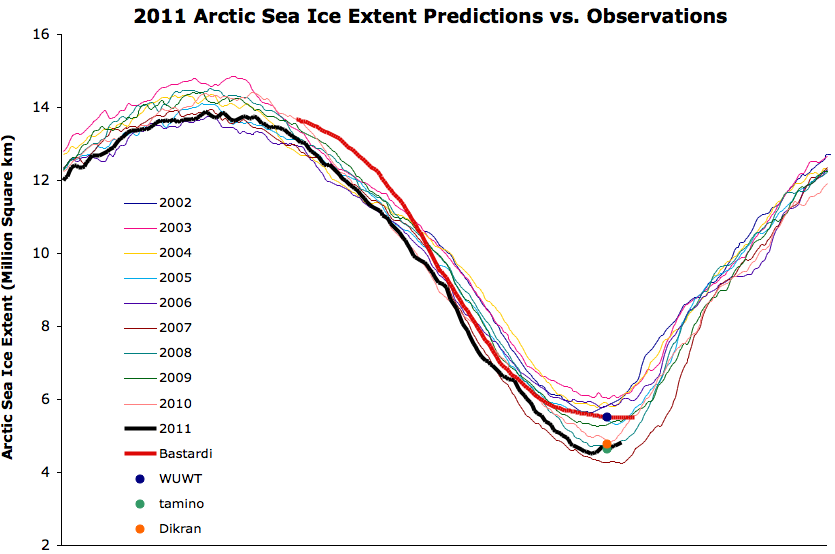
Figure 5: JAXA Arctic sea ice extent data, with an approximate re-creation of Joe Bastardi's 2011 prediction from Figure 1 (red), WUWT readers' predicted minimum (blue dot), tamino's predicted minimum (green dot), Dikran Marsupial's predicted minimum (orange dot), and the actual 2011 data (black).

Clearly Bastardi and WUWT's predictions did not fare well.  Contrary to Bastardi's prediction, the melt season did not begin late, and the annual minimum (4.53 million square kilometers [km]) was approximately 1 million square km (21%) less than the "skeptic" prediction.  On the other hand, tamino once again fared very well, with his best estimate missing the mark by just 0.1 million square km (2.2%), and Dikran Marsupial fared reasonably well, overestimating the 2011 minimum by 0.24 million square km (5%).

Ice Age/Thickness/Volume

Steven Goddard declined to make an Arctic sea ice extent prediction for 2011 (perhaps being discouraged by his poor 2010 prediction), but did make a prediction about Arctic sea ice thickness:

"My forecast is that come the end of September, the amount of multi-year ice will again  increase relative to last year, as it has done every year since 2008. In 2013 there should be an increase in the amount of five year old ice, because that is when the 2008 ice will have aged five years."

Firstly, "every year since 2008" encompassed a whopping two years of data when Goddard made that statement.  Figure 6 shows the data from September (end of summer), updated by NSIDC through 2011.  Bear in mind that this is a graph of percent of total ice extent, which is only an accurate representation of the amount of ice if the the total amount remains constant, which is not the case.

NSIDC Sept

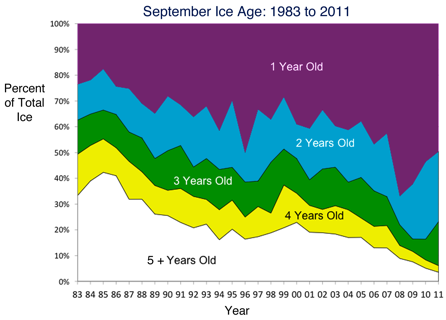
Figure 6: NSIDC Arctic sea ice age from 1983 through 2011 (Source)

As you can see, the percentage of 2-year-old ice has increased since 2008.  The percentage of 3-year-old ice declined from 2008 to 2009, but increased from 2010 to 2011.  The percentage of 4- and 5-year-old ice has declined consistently over essentially the entire decade.  The total amount of multi-year ice did increase slightly from 2010 to 2011, due to the increase in 2- and 3-year-old ice.  However, sea ice thickness declined due to the loss of 4- and 5-year-old ice.

Because of this declining sea ice age/thickness, even though sea ice extent did not break the 2007 record, sea ice volume did set a new record low in 2011.  According to the Pan-Arctic Ice Ocean Modeling and Assimilation System (PIOMAS), both 2010 and 2011 set new record lows for Arctic sea ice volume, and like the sea ice age/thickness data, has declined steadily since 2007 (Figure 7).

PIOMAS

Figure 7: PIOMAS Arctic sea ice volume anomaly and trend.

Arctic Optimism is Skating on Thin Ice

Climate "skeptic" Arctic sea ice extent predictions were too optimistic by approximately 20% in both 2010 and 2011, while tamino's prediction based on a quadratic declining trend (a.k.a. a "death spiral") has been exceptionally accurate.  We've only examined two years' worth of predictions here, but tamino's and Dikran's projections were based on applying a quadratic trend to 30 years worth of data.

In short, "skeptic" optimism about an Arctic sea ice recovery seem very badly misplaced.  The planet (especially the Arctic) is warming rapidly, and the decline in both Arctic sea ice extent and volume is accelerating faster than climate models project

We have to wonder if WUWT will produce its third consecutive overly optimistic Arctic sea ice prediction in 2012, or if "skeptics" will learn that their optimism is not based in reality.  Canadian researchers reported this month:

"Canada’s Arctic ice shelves, formations that date back thousands of years, have been almost halved in size over the last six years"

So much for misplaced optimism.

0 0

Printable Version  |  Link to this page

Comments

Comments 1 to 30:

  1. Shouldn't "took up the reigns" be "took up the reins"?
    0 0
  2. I hate to defend Goddard but "Goddard Also Wrong on Ice Thickness/Volume" doesn't seem to me to be an accurate characterisation of what he wrote since the only thing he ventured a prediction about in the linked blog post was ice age. I think it's entirely plausible that he'll end up being right that there will be an uptick in the amount of five year ice in 2013 compared to 2012.
    0 0
  3. Yes it should, KR. Djon - Goddard said the amount of multi-year ice would increase, in addition to his likely wrong prediction about 5-year-old ice. Technically the total percentage of multi-year ice did increase, but almost all of that increase was from 2-year ice, and that's also an increase in percentage, not amount. I haven't run the numbers, but given the decrease in total amount of sea ice, I suspect his prediction of an increase in amount of multi-year ice from 2010 to 2011 is wrong.
    0 0
  4. Dana, Maybe you should try to run the numbers. My attempt to do so after using an on screen pixel measuring tool to measure the percentage of 2-year and older ice in September 2010 and 2011 and multiply that by the monthly average extents yielded a result of his prediction just barely coming true. Whichever way that comes out, the point remains that his predictions are for ice age, not ice volume or thickness. Though he was certainly guilty of a bit of sleight of hand with his switch from discussing thickness to ice age, as though the two correlated perfectly.
    0 0
  5. I don't have the raw ice age data, but it looks like the total amount of multi-year ice was roughly the same in 2010 and 2011. Basically the short-term recovery of ice extent after the 2007 minimum created more first-year ice, which in turn led to more second and third year ice the next few years. But the decline in total ice extent in from 2010 to 2011 roughly offset that short-term multi-year ice percentage increase.
    0 0
  6. Funny how WUWT is always attacking the idea of science by consensus (which really is a strawman the way they define it); yet they engage merrily in scientific prediction by consensus, which amounts to nothing more than collective wishful thinking and ends up so far off it's a total joke. Djon, if Goddard got anything right at all in his history of ramblings on the Arctic, it is purely by chance. I nothe that neither him nor Bastardi made an attempt at explaining what kind of methodology they were using to come up with their "predictions." It is really unfortunate that so much time and attention has to be wasted on these people's disinformation efforts.
    0 0
  7. Some sad news regarding the ability to collect sea ice data has been published by Roy Spencer (and WUWT) with regards to the AMSR-E instrument which supplies the JAXA data. The instrument was designed for a 6 years mission and is currently at 9+. Unfortuntately, the device is creating too much torque and has caused problems for the other instruments on board the bird (Aqua) and has been shutdown. At first, the instrument was placed in a safe mode (4 rpm versus a nominal 40 rpm) but that still caused high jitter on the satellite and is now, essentially, shutdown. The next instrument to replace it, AMSR2, is not scheduled to launch until early next year.
    0 0
  8. The University of Bremen researchers who had been producing the most detailed daily ice maps and extent time series based on AMSR-E have announced that they will be switching to SSMIS data over the next few days.
    0 0
  9. Hi Dana, I think by "SOURCE" you mean "SEARCH".
    0 0
    Response:

    [dana1981] Correct, thanks

  10. So, I looked up SSMIS and it sounds like a superior (certainly newer) set of instruments relative to AMSR-E. Is there a reason researchers like Uni Bremen hadn't switched already? (Like it's a fine instrument but not as good for this particular task?)
    0 0
  11. The Search Outlook has been running since 2008 making sea ice predictions each year. The 2008 outlook predicted a minimum similar to 2007 with some above and some below. The actual 2008 sea ice ended in the upper range of these predictions, but not spectacularly so. In 2009 the Search Outlook predicted sea ice conditions not too far off 2007, but more predictions were for above than below. However in the end every single prediction was too low. There was one prediction at 3.2m, the rest between 4.2 and 5, and the actual result was above 5.3m. The 'skeptics' were quite pleased with this failure and I remember many comments about how incompetent the scientists were and that any average Joe could do better. And then next year the 'skeptic' side made the attempt and as you documented they mostly did fairly badly. However one success on that side was Joe Bastardi in 2010 predicting that the minimum that year would be quite low. But even back then he was predicting the recovery in 2011 would be very strong and that of course has failed badly. Of note is that the scientists were overly pessimistic in 2008 and 2009, and seem to have learned from these mistakes and provided much more accurate predictions. The 'skeptics' mocked the initial mistakes, then preceded to make worse predictions of their own, and then come back next year to make exactly the same mistake again. It will be interesting to see how the more aggressive predictions of mostly ice free by late this decade that have been around for a few years now go. PIOMAS has continued to decline on track with this prediction, but satellite measures of extent seem way behind and something like 2030 seems more reasonable based on extent.
    0 0
  12. I can't believe all those WUWT people could be so wrong! They always seem so wise, whenever I drop in there. One only has to see the level of scorn they heap on non-believers to realise just how much they must know. But don't worry. One year, one of them will make a prediction that is pretty close, and then the rejoicing and mutual back patting will be a thing to behold. A quick check at WUWT reveals a lot of recent posts, but none discussing the annual arctic sea ice minimum. I wonder why they aren't interested in it?
    0 0
  13. John Brookes#12: "one of them will make a prediction that is pretty close," You know what they say about stopped clocks.
    0 0
  14. Djon @4, based on pixel counts, the percentage and extent (in million km^2) of multi-year ice in 2010 and 2011 are as follows: ____________2010__Area___2011__Area__Survival 1 year ice: 53.2% 2.61 | 49.6% 2.29 | xxxxxx 2 year ice: 29.9% 1.47 | 27.1% 1.25 | 47.9% 3 year ice: 07.8% 0.38 | 17.4% 0.80 | 54.4% 4 year ice: 03.6% 0.18 | 02.2% 0.10 | 26.3% 5 year ice: 05.1% 0.25 | 03.9% 0.18 | 41.8% From the area, it was possible to calculate what proportion of 1 year ice in 2010 survived to become 2 year ice in 2011, and so on. Survival for 5 year ice is the ratio of 2011 5 year ice to the sum of 2010 for and 5 year ice. In order for there to be an "uptick" in five year ice in 2012, that would require a survival rate of 4 and 5 year ice in 2012 greater than 64%. If, as expected, sea ice extent declines, or even if it remains constant, that appears unlikely. On the other hand, sea ice extent will have to decline to around 3 million km^2 in 2013. Of course, if the spur of old ice from the North Pole to the Russian coast does not survive the next two years, all bets are off. With regard to your point that Goddard predicted ice age, not ice thickness, you are technically correct. However, ice thickness is a function of ice age, so that there cannot be an increase in ice thickness without a commensurate increase in ice age. Furthermore, any increase in extent of old ice will ipso facto be accompanied by an increase of ice thickness, or at minimum, a cessation of the continuing declining trend. As it happens, the decline in sea ice volume in 2011 of about 10% approximately matches the decline in area suggesting that most of the loss of sea ice volume is accounted for by that decline in area. That would suggest the increase in three year ice has more or less compensated for the decline in sea ice extent for ice of all other ages. So, and contrary to Dana, Goddard did get both his actual and his implicit prediction right. Specifically, sea ice extent of multi-year ice increased from approximately 2.29 million km^2 to 2.32 million km^2. The sea ice thickness remained approximately constant or even slightly increased, and there may well be an increase in 5 year ice in 2013 (although there will be a sharp reduction in 2014). Contrary to AndyWeissDC (in comments at Goddard's site), Goddard being correct in his prediction is not "a death blow to the alarmist cause". For a start, there is no "alarmist cause", merely a recognition of the actual scientific facts leading to considerable alarm. More importantly to this thread, even though Goddard was right, both arctic sea ice area and volume declined by about 10% relative to 2010. Goddard chose to make predictions on topics that give no indication of overall decline or recovery of sea ice. He did so, I suspect, to distract people from the ongoing death spiral in Arctic sea ice extent.
    0 0
  15. Sad news abour AMSR-E. However Cryosat-2 ha been up since last year, has completed its calibration work-up and is starting to produce data. Hopefully within a year we will see results from it. It will provide a backup to PIOMASS that isn't partly model based. The trends on PIOMASS are probably why extent isn't as reliable a guide to future collapse. Effectively ice thickness equals mechanical strength. So more and more thin ice is weaker and liable to collapse due to break-up, not just melting in-situ. My bet from PIOMASS is effectively Ice-Free (apart from isolated pockets) by 2016/17.
    0 0
  16. John Brookes, not that I go to WUWT very often (because it makes my brain hurt, and not in a 'good' way), but I don't believe they often mention record warm temperatures, heat-waves, etc. - only cold ones. Or when it snows. Seems a bit strange...not !
    0 0
  17. JMurphy @16, That's a natural human perception objectivity: snow is "cold" so think about it if you don't believe in global warming. If you add windchill, it's much colder than calm air with an absolute temperature even 10-20C less. But because it "feels" colder, it's perfect to argue that the heavy, snowy winter we just had in US or Europe heralds the end of global warming. But in terms of absolute temperature rather than "perceptual coldness" it may actually be opposite. So much for the perceptive manipulation by skeptics. As for the accuracy of the Goddard prediction we are talking about here, he appears to have choosen the right words as to avoid talking about the main long term problem, the long term loss of ice. Talking about possible increase of 5y ice percentage is just obvious when we had a short term increase of 1-2y ice percentage in 2008-9.
    0 0
  18. I postulate that any attempt to determine if Goddard is possibly right in his predictions is like arguing about the accuracy of stopped clock. He maybe right only by coincidence, and about an irrelevant detail.
    0 0
  19. JMurphy, what you fail to understand* is that 1998 was actually the warmest year on record and the earth** has been cooling since. In fact, disingenuous warmists*** like Willis have had to massage the data to keep the warming myth going. (definitions) *believe, rabidly **select measurements of temperature, over select time scales, measured by select individuals and using select statistical methods *** scientists who don't agree with our perspective
    0 0
  20. Suggested reading: "Climate change eradicating Arctic's oldest ice," The Vancouver Sun, Oct 5, 2011 To access this article, click here
    0 0
  21. Suggested reading: “Arctic Sea Ice Continues Decline, Hits Second-Lowest Level,” Science Daily, Oct 4, 2011 To access this article, click here
    0 0
  22. I did well to save that Bastardi video to my hard drive last year, as AccuWeather has removed all his video blogs. :-) Like I said in my post: "One down, zero to go. Extent didn't set a new record low, but the credibility of pseudo-skeptics did." They're a lot more quiet now, but haven't given up yet. Maybe next melting season will give them another 'recovery'.
    0 0
  23. Tom Curtis, Your pixel measuring agrees with mine, though you appear to have gone for more precision in your measurements than I did. For the rest, my "defend Goddard" was a poor choice of words. My objection is not that he's being done an injustice but that he's being handed an opportunity to say "Skeptical Science said I was wrong but the data from NSIDC backs me up". Goddard doesn't deserve even so minor a propaganda victory as that so I'd like to see the necessary level of care taken not to hand it to him.
    0 0
  24. Neven - yes, I'm glad you saved the video too. Thanks! Djon - I changed the section heading to simply "Ice Age/Thickness/Volume".
    0 0
  25. Further to my post 14, I have redone my pixel count on sea ice area, and downloaded the daily figures for sea ice volume from Piomass. As a result I can now correct my calculations. Based on a pixel count of the graph of arctic ice area from cyrosphere today, ice area has decreased by 94.3% from 2010 to 2011 (minimum area). According to Piomas daily figures, the 2011 ice volume minimum was 4.007 on day 253. In 2010 the minimum was 4.455 on day 251. That is a decline in volume from minimum to minimum of 89.9% Contrary to my claims in 14, that indicates a decline in sea ice thickness of approximately 5%. That sea ice thickness should decline in a year when multi-year ice increased is very disturbing, IMO.
    0 0
  26. Tom, pixel counting has its hazards (ask Steve Goddard!) - is the map you are counting from drawn on polar equal area projection?
    0 0
  27. I'm not pixel counting the map. I'm pixel counting the graph. Assuming the graph is accurate, my pixel count should give accurate ratios to within 5% for the extent counts, and within 2% for the area count. I would, of course rather do the calculations direct from digital data by could not find a link for the extents of multi-year ice at NSIDC.
    0 0
  28. Curtis@25: No, that is *NOT* a decline of 89.9%. 4.007/4.455 = 0.899. It is a decline to 89.9% of the previous year, for a decline *of* about 10%.
    0 0
  29. rand 15 @28, good call and my bad. I used similarly sloppy (ie, downright wrong) language regarding area where the decline is 5.7%. Mea culpa, and I hope no-one was confused.
    0 0
  30. Suggested reading: “Young and Thin Instead of Old and Bulky: Researchers Report On Changes in Arctic Sea Ice After Return of Research Vessel Polarstern” ScienceDaily, Oct 6, 2011 To access this article, click here
    0 0

You need to be logged in to post a comment. Login via the left margin or if you're new, register here.


The Consensus Project Website

THE ESCALATOR

(free to republish)


© Copyright 2024 John Cook
Home | Translations | About Us | Privacy | Contact Us