


 Arguments


Research downplaying impending global warming is overturned
Posted on 3 June 2015 by dana1981
A new paper just published in Science Bulletin by Mark Richardson, Zeke Hausfather, Dana Nuccitelli, Ken Rice, and John Abraham shows that mainstream climate models simulate global temperature observations much better than the “irreducibly simple climate model” of Christopher Monckton, Willie Soon, David Legates, and William Briggs.
When the Monckton paper was published in the Chinese journal Science Bulletinthis January, it was covered by conservative media outlets like the Daily Mail,Breitbart and World Net Daily, which used it to manufacture doubt about the dangers associated with human-caused global warming. The ideologically-appealing but scientifically incorrect message from the paper was essentially, ‘climate models are running hot, the climate is insensitive to the increasing greenhouse effect, and thus future global warming will be minimal and nothing to worry about.’
However, our team identified numerous glaring fundamental errors in the Monckton paper. The first was in the very premise of the paper itself, claiming that global climate models are “running hot.” In reality, as I show in my bookClimatology versus Pseudoscience, mainstream climate models have done a good job at projecting the observed changes in the global surface temperature.
While temperature measurements have been toward the lower of the range of model projections in recent years, there’s been a tremendous body of scientific research investigating the various contributors to the slowdown in global surface warming. This research, which was entirely ignored by Monckton and his colleagues, is summarized by Kevin Cowtan in week 5 of the Denial101x course.
Kevin Cowtan’s Denial101x lecture 5.8.1.2.
In fact, ignoring a vast body of important relevant research was a recurring theme throughout the Monckton paper. After they manufactured a problem by exaggerating the discrepancy between mainstream climate model simulations and temperature observations, and ignored the relevant scientific research on that issue, Monckton and colleagues created their own “irreducibly simple climate model” with built-in assumptions based on circuit design rather than the physics of the Earth’s climate system.
Here they made two fundamental mistakes. First, they assumed that the Earth’s climate is very stable, and built that assumption into their model. This assumption was based ignoring most of the body of paleoclimate (historical climate change) research showing big past climate change swings influenced by amplifying feedbacks, and by assuming that the Earth’s climate will behave the same as a human-designed electrical circuit with minimal gain and feedbacks.
Second, based on that first assumption of a stable climate, their paper claimed “warming is already at equilibrium.” However, we know that’s not true becausesatellites measure a large ongoing global energy imbalance, with a tremendous amount of heat building up in the oceans. As John Abraham explains,
The model of Monckton and his colleagues is fatally flawed in that it assumes the Earth responds instantly to changes in heat. We know this isn’t true. The Earth has what’s called thermal inertia. Just like it takes a while for a pot of water to boil, or a Thanksgiving turkey to heat up, the Earth takes a while to absorb heat. If you ignore that, you will be way off in your results.
Circular logic was another fundamental flaw in the Monckton et al. paper – they used their simple model, which assumed that the Earth’s climate is stable and hence insensitive to the increasing greenhouse effect, to demonstrate that the climate is insensitive to the increasing greenhouse effect.
As you might expect from a simple model based on flawed assumptions, as we show in our paper, it does a poor job in reproducing observed temperature changes. In the figure below, the blue area represents temperature changes simulated by climate models used in the last IPCC report; the red area represents temperature simulations from the Monckton et al. simple model; and the red, blue and black lines show the observed global surface temperature changes. As you can see, the mainstream climate models do a much better job simulating the observational data than the flawed, simple model.
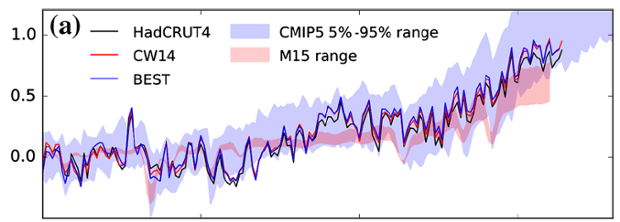
Comparison between modelled and observed temperature change (°C) from 1850. Solid lines show observational series HadCRUT4, Berkeley Earth (BEST) and Cowtan and Way. The 5%–95% CMIP5 range and Monckton et al. range are shown as shaded areas. N = 45 CMIP5 models transitioning to RCP6.0 after 2005, M15 model forced with the Otto et al. radiative forcing time series and all temperature series anomalies calculated relative to the 1850–1900 mean. Source: Science Bulletin; Richardson et al. (2015).
Ultimately our paper concludes as follows,
The M15 [Monckton et al. (2015)] model performs poorly against observations because its parameters were selected using a logically flawed narrative, rather than physical and mathematical analysis. Observational evidence from palaeoclimate and of ocean heat content measurements directly contradict the values adopted by M15, but are not acknowledged.
Partial use and misinterpretation of the relevant literature may explain many of the differences between statements in M15 and the results of other studies. The authors of M15 cite some studies supporting their estimate of lower climate response, but miss much of the larger body of research that contradicts the claims in M15 …
Their low estimates of future warming are due to assumptions developed using a logically flawed justification narrative rather than physical analysis. The key conclusions are directly contradicted by observations and cannot be considered credible.
The paper by Monckton and colleagues was badly flawed and should not have been published,


I had the pleasure of being at the RSE meeting on Climate Change and Society last week, about which Christopher Monckton wrote a lovely piece - misrepresenting most it and highlighting his own predujices. It lead me into reading a bit more of his published material.
One question - the plots he shows for the observed temperature change look completely different to most which I assume is down to the datasets he chooses to average but can you give some more details? Unfortunately I don't have access to your paper if it's in there.
DrMcCoy
Yesterday, while posting at one of science deniers sites out there, I also notices that the graph at the top of the page did not match up with the actual data they claimed they were using.
The following statement accompanied the graph: But don’t take my word for it. Here, in a single handy graph, are five major global temperature records (UAH, RSS, GISS, NCDC and HadCRUT4) from Climate4you:
It would appear that Climate4you is also in the business of creating bogus temperature data graphs.
DrMcoy @1 - Monckton et al. (2015) shows the average of RSS, UAH, NCDC, HadCRUT4, and GISS in its Figure 1. We didn't make this point in our rebuttal, but averaging together the satellite estimates of lower troposphere temperatures (RSS and UAH) with surface temperature measurements (NCDC, HadCRUT4, and GISS) doesn't make sense. Since it's a comparison to model surface temperature projections, UAH and RSS shouldn't have been included. But the misrepresentation of the model projections was far worse, so we focused on that.
1) Dana, congratulations on publication of the response.
2) @3, it is certainly inappropriate to average surface temperature records with satellite temperature records to produce a combined record. Not only that, even averaging surface temperature records is dubious. As there is considerable overlap between the stations used for the different records, the effect is to downweight the effect of stations not represented in all records. As HadCRUT4 ignores the Arctic, de facto assuming arctic temperature increase equals the global average, averaging temperature records also downweights arctic temperature trends.
In fact, if you want to use a single record it is difficult to justify using anything other than that record which employs the most raw data, and uses the best statistical approach. At the moment this is the BEST record. HadCRUT4, which is the most commonly used record, is the worst on both of those criteria (ie, it has the least raw data, and employs the worst statistical method). Ergo, as good practise scientists should currently employ either only the BEST record or (as replication is important), all records shown seperately.
3) When I read the abstract of the paper, I thought it one of the most damning critiques of another paper I have ever read. Well worth a read:
The quality of M15, having Monckton as the lead author, is of no surprise: it underpins the utter lack of any scientific credentials of the author.
The only interesting question is: who was the editor/reviewers who allowed such piece appear in peer reviewed literature, rather than in some obscure anti-science blog or proceedings of anti-science organisations like NIPCC, where Monckton is known to have published his previous work.
chrisoz,
Based on other observations of what is going on around the planet it appears to be quite likely that there is a correlation of the publishing of the Monckton document with funding to key individuals in the publishing organization by parties like the ones that fund Willie Soon's making-up of claims.
Tom:
While I'm a big fan of Berkeley Earth (the temperature record formerly known as BEST), I think the CRU station data should not be dismissed. While the station count may not appear spectacular, the stations are very carefully chosen and validated. As a result, coverage is dramatically better than GHCNv3 post 2000.
They also make use of (often manual) homogenizations from the national weather services rather than automated methods used elsewhere. That's a very important cross check.
Kevin C @7, I certainly do not have a problem with using HadCRUT4 for (as you put it) cross checking, or (as I put it) replication. I have long disliked theories that depend for their validation on one or more of the available temperature series being false. On the other hand, if you are going to use just one temperature record, it is a mistake IMO to use HadCRUT4 in preference to BEST. And if you are going to use all of them, it is also a mistake to average them first.
Tom, thanks. Personally I don't have a big problem with averaging the surface temp data sets for illustrative purposes, although in a scientific paper it's probably better just to show the individual data sets separately.
Note that we've received a draft copy of the Monckton et al. response to our paper, and it's quite poor, even juvenile in places. It will be interesting to see if it goes through a more rigorous peer-review process than their initial submission, and if it survives in a state similar to the draft copy.