Climate Science Glossary

Term Lookup

Enter a term in the search box to find its definition.

Settings

Use the controls in the far right panel to increase or decrease the number of terms automatically displayed (or to completely turn that feature off).

Term Lookup

Settings


All IPCC definitions taken from Climate Change 2007: The Physical Science Basis. Working Group I Contribution to the Fourth Assessment Report of the Intergovernmental Panel on Climate Change, Annex I, Glossary, pp. 941-954. Cambridge University Press.

Home Arguments Software Resources Comments The Consensus Project Translations About Support

Bluesky Facebook LinkedIn Mastodon MeWe

Twitter YouTube RSS Posts RSS Comments Email Subscribe


Climate's changed before
It's the sun
It's not bad
There is no consensus
It's cooling
Models are unreliable
Temp record is unreliable
Animals and plants can adapt
It hasn't warmed since 1998
Antarctica is gaining ice
View All Arguments...


Username
Password
New? Register here
Forgot your password?

Latest Posts

Archives

What Role Did the Arctic Storm Play in the Record Sea Ice Minimum?

Posted on 19 October 2012 by dana1981, Albatross

With 2012 shattering the previous minimum Arctic sea ice extent record by more than three quarters of a million square kilometers, climate contrarians have predictably been scrambling to find an excuse why the Arctic death spiral is still nothing to worry about.  The Arctic storm which first hit on 05 August 2012 has been used as a convenient scapegoat. This despite the fact that the evidence indicates that most of the long-term loss of Arctic sea ice is human-caused.

Can this single storm really be responsible for breaking the previous Arctic sea ice record by such a large margin?  The short answer is no.

Sea Ice Decline Prior to August

Since the Arctic storm first hit on August 5th, we can first evaluate its impact by looking at the state of the sea ice extent leading up to that point.  For example, the average July sea ice extent in 2012 was the second-lowest on record, just slightly behind 2011 (Figure 1).

July sea ice NSIDC

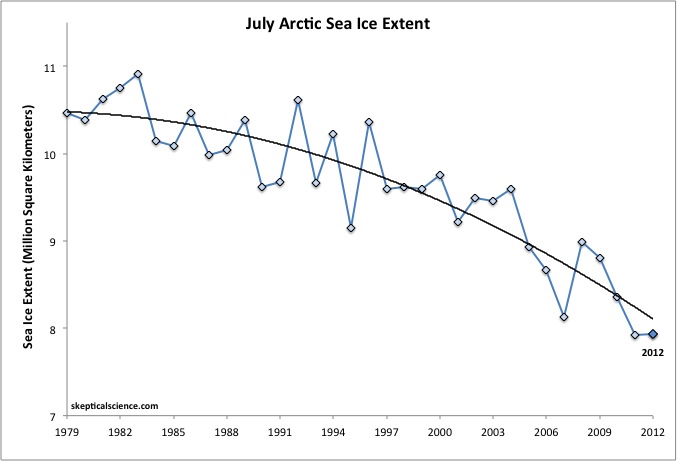
Figure 1: July average sea ice extent, data from the National Snow and Ice Data Center (NSIDC).  July 2012 had a lower extent than 2007, and the second-lowest July average extent behind 2011.

According to JAXA, as of August 4th, the 2012 Arctic sea ice extent was also the 2nd-lowest on record, behind only 2007.  2012 and 2007 were also essentially tied for the largest sea ice decline between early June and early August (2011 having less June-August ice loss because its extent in June was already low) (Figure 2).

JAXA extent to Aug 4

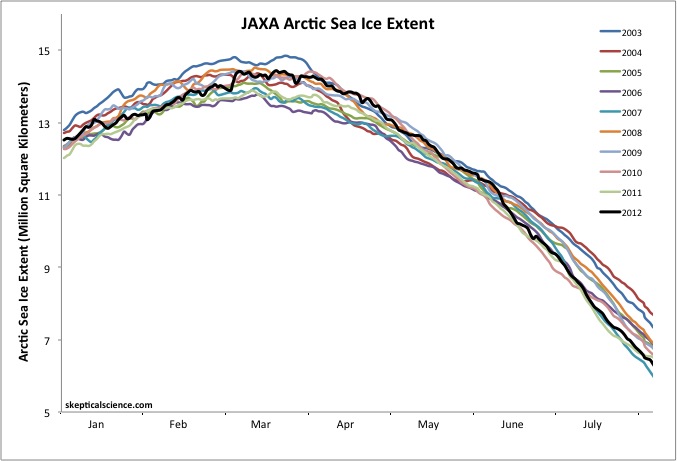
Figure 2: Arctic sea ice extent from 01 January to 04 August, for 2003 through 2012, data from JAXA.

Thus we see that Arctic sea ice in 2012 was experiencing substantial decline even before the Arctic storm hit.  

Comments from Arctic Experts

Several Arctic sea ice experts have weighed in on the record-breaking minimum in 2012 and the effects of the summer storm on this record.  According to NSIDC Director Mark Serreze,

"The previous record, set in 2007, occurred because of near perfect summer weather for melting ice. Apart from one big storm in early August, weather patterns this year were unremarkable. The ice is so thin and weak now, it doesn't matter how the winds blow."

NSIDC scientist Walt Meier said,

"...in the context of what's happened in the last several years and throughout the satellite record, it's an indication that the Arctic sea ice cover is fundamentally changing....The Arctic used to be dominated by multiyear ice, or ice that stayed around for several years.  Now it's becoming more of a seasonal ice cover and large areas are now prone to melting out in summer."

Dr. Julienne Stroeve (another NSIDC scientist) said,

"The acceleration of the loss of the extent of the ice is mostly because the ice has been so thin. This would explain why it has melted so much this year. By June the ice edge had pulled back to where it normally is in September,"

"The 2007 record was set when you had weather conditions which were perfect for melting. This year we didn't have those. It was mixed. So this suggests the ice has got to a point where it's so thin it doesn't matter what the weather is, it's going to melt in the summer. This could become the new normal"

NSIDC Arctic sea ice news and analysis:

"Other than the August storm, the pressure pattern in 2012 does not appear to have been as favorable in promoting ice loss as was the case in 2007, and yet a new record low occurred."

Claire Parkinson, a climate scientist at NASA Goddard Space Flight Center said,

"The storm definitely seems to have played a role in this year's unusually large retreat of the ice.  But that exact same storm, had it occurred decades ago when the ice was thicker and more extensive, likely wouldn't have had as prominent an impact, because the ice wasn't as vulnerable then as it is now."

Paul A. Newman, chief scientist for Atmospheric Sciences at NASA's Goddard Space Flight Center estimated that there have been about eight storms of similar strength during the month of August in the last 34 years of satellite records - one every 4 to 5 years.

How Strong was the 2012 Storm?

While the 2012 Arctic storm was a strong one, as Newman noted, it was not unprecedented.  To confirm Newman's claim, we examined daily surface pressure maps from NCEP-NCAR and NCEP-II DOE reanalysis data.  Low pressure systems are typically associated with a tight pressure gradient that results in strong surface winds.

In the 34 years between 1979 and 2012, we identified 19 deep low pressure systems (defined here as having a central pressure less than 980 hectopascals [hPa]) in the Arctic between 15 July and 15 September.  Most of these deep lows occurred over the Barents, Laptev, and Kara seas, so they are not suitable analogs for the 2012 storm.

However, there were nine previous storms during this timeframe in the same general area as the 2012 event.  Of these, we identified five best analogs for the 2012 event. These occurred in 1980, 1990, 1991, 1994, and 1997 (Figure 3 - click for a larger version).

arctic storms

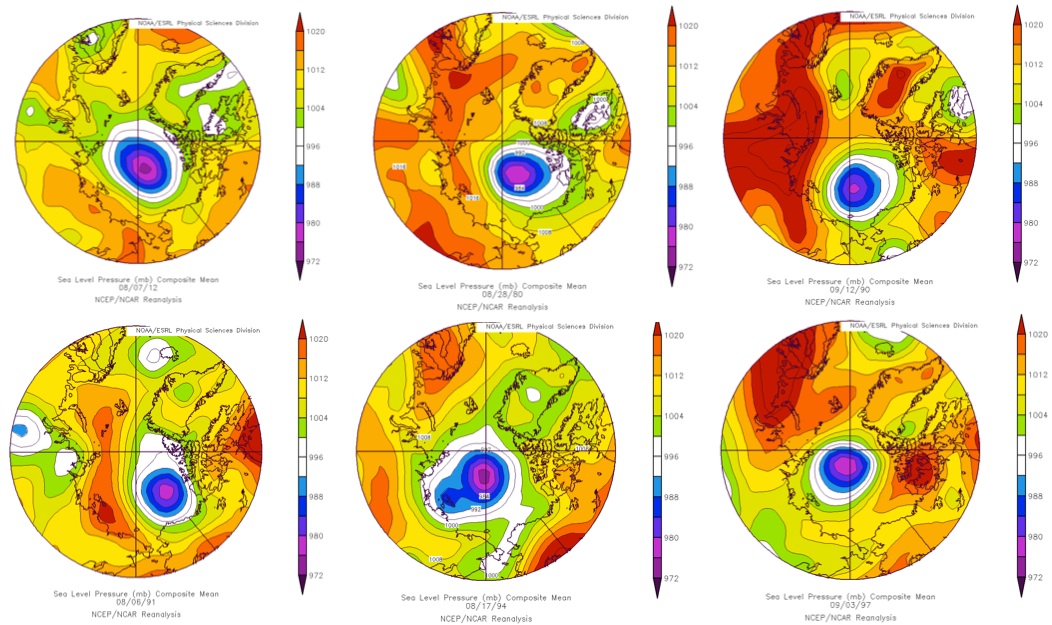
Figure 3: NCEP/NCAR sea level pressure maps in (from right to left and top to bottom) on 07 August 2012, 28 August 1980, 12 September 1990, 06 August 1991, 17 August 1994, and 03 September 1997.

What Effect Did Similar Previous Storms Have on Sea Ice Extent?

If this type of deep Arctic storm has a major influence on annual Arctic sea ice minimum as claimed by contrarians, then we would expect to see similar declines in 1980, 1990, 1991, 1994, and 1997.  Let's see what the data shows (Figure 4).

storm extents

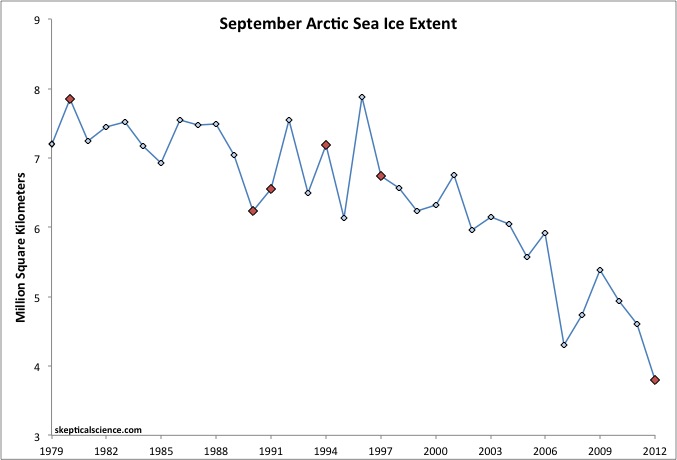
Figure 4: September Arctic sea ice extent data from NSIDC (blue), years with Arctic summer storms similar to the 2012 storm are depicted in red.

There was a decrease in September Arctic sea ice extent from 1989 to 1990 and 1996 to 1997 (and of course from 2011 to 2012), but an increase from 1979 to 1980, from 1990 to 1991, and from 1993 to 1994.  With half increases and half decreases in September Arctic sea ice extent during one of these summer Arctic storm years compared to the prior year, there is no clear sign that these storms had a big impact on sea ice extent.

We should also note that the Arctic storm in 1990 occurred on 12 September, just days before the annual minimum, and there was very little sea ice decline between 12 September and the minumum that year.  Thus the 1990 storm cannot be responsible for most of the sea ice decline between 1989 and 1990.  In fact, there wasn't a particularly large decline between the date of any of the Arctic storms and the annual minimum, with the exception of 2012. 

Figure 5 shows the change in sea ice extent at the time of the summer storm (left frame) vs. the annual minimum (right frame) for each of these years (note that the year in the date on the right frame in Figure 5 is cut off - the year is the same as in the left frame).

storm differences 

Figure 5: Arctic sea ice extent maps on the date of each summer Arctic storm in 1980, 1990, 1991, 1994, 1997, and 2012 and at the annual minimum each of these years.

Thus in the five previous examples of summer Arctic storms similar to that in August 2012, there was no clear impact on the final Arctic sea ice minimum.

Additionally, Screen et al. (2011) found that it was the frequency of cyclones between May and July, and not those in August or September, that are responsible for conditioning the sea ice in September for either a significant loss or gain over the previous year.

So What Factors Contributed to the 2012 Record?

As the ice experts mentioned above, the 2012 summer storm very likely made an already bad situation worse.  The reason is that because of the long-term decline and thinning of the Arctic sea ice in response to the dramatic warming, the ice pack is now very vulnerable to events that would have historically had little or no impact.

Not only does the earlier retreat of the sea ice result in a positive albedo feedback, it also means that when there are storms such as in 2012, the winds are capable of generating large swells that can penetrate hundreds of kilometers into the pack and break up the sea ice, thereby hastening the decline.  Figure 6 shows the long fetch (the distance along which the winds are able to interact with the ocean surface and produce wind waves and swells) available to winds during the 2012 storm.  These conditions were ideal for generating large swells.

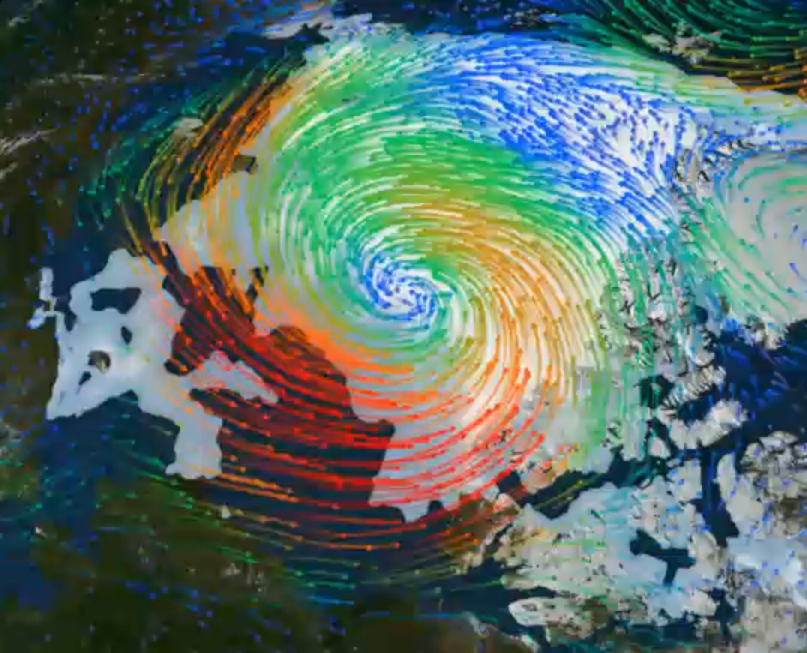
Figure 6:  Wind field (coloured arrows, with warm colours representing strong winds) and sea ice (grey areas) on 9 August 2012. Credit: NASA/Goddard Science Visualization Studio

A similar event was witnessed by Canadian scientists aboard an ice breaker in the Beaufort Sea in early September 2009 (Asplin et al. 2012).  They observed swells over 250 kilometers (km) from the ice edge following  the transit of two lows across the Arctic Basin in short succession. The large swells caused the breakup of large (>1 km) multi-year ice floes up to 5 meters thick, into much smaller floes (100-150 meters).  On that occasion the long stretch of open water was also key in permitting the storms to generate a large swell.

Peer-Reviewed Literature on Arctic Storms

We might also ask whether these summar Arctic storms have become stronger and/or more frequent, and if so, why?

Hakkinen et al. (2008) analyzed the wind stress data from the NCEP/NCAR reanalysis to test for a change in Arctic storm intensity/frequency and found that summer storms are becoming more intense (Figure 7).

Hakkinen fig 3

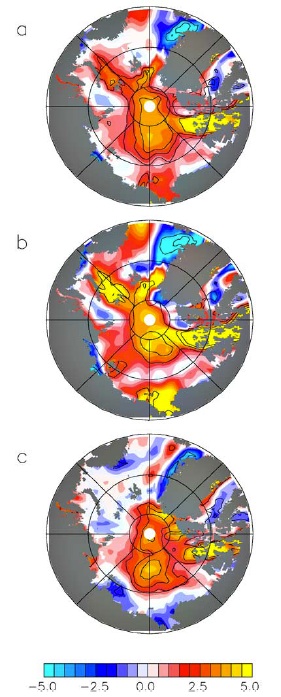
Figure 7: Trends of the NCAR/NCEP Reanalysis wind stresses for 1948–2006 for (a) annual, (b) winter, and (c) summer values.  Units are 10-4 N/m2 per year.  Figure 3 from Hakkinen et al. (2008).

The authors conclude that the increasing Arctic wind stress trend in the summer has higher significance than the winter trend due to enhanced storminess.

"Our results show a gradual acceleration in sea ice drift over the 50 years analyzed. The accelerating trend in the central Arctic is present both in winter and summer observations, with nearly equal statistical significance. Since the atmosphere is responsible for the main forcing of the sea ice, the obvious conclusion is that the increased sea ice speeds relate to increased storm frequency and/or intensity."

Long and Perrie (2012) investigated the impacts of increased open water in the Beaufort Sea for a summer Arctic storm in 2008 using a coupled atmosphere-ice-ocean model.  They found that a reduction in ice cover and more open water results in stronger Arctic storms.

"The model simulations suggest that the lack of ice cover in the Beaufort Sea during the 2008 storm results in increased local surface wind and surface air temperature, compared to enhanced ice cover extents.... These changes result in enhanced surface winds, by as much as ∼4 m/s during the 2008 storm, compared to higher ice concentration conditions (typical of past decades)."

Screen et al. (2011) found no significant trends in late spring or summer Arctic cyclone frequency over the period 1979–2009.  So it appears that the intensity of summer Arctic storms may be increasing due in part to the reduction in sea ice cover, which is primarily human-caused, but there is no clear indication of an increase in Arctic storm frequency.

Peer-Reviewed Literature on the Long-Term Sea Ice Decline

As noted above, the long-term thinning and decline of the Arctic sea ice allowed the 2012 summer storm to impact this year's record minimum.  Thus it's also important to note that there is very strong evidence in the peer-reviewed literature that the long-term sea ice decline is primarily human-caused.  For example, Day et al. (2012) concluded,

"despite increased observational uncertainty in the pre-satellite era, the trend in [Arctic sea ice extent] over this longer period [1953–2010] is more likely to be representative of the anthropogenically forced component."

Stroeve et al. (2012) concluded,

"Based on the CMIP5 multi-model ensemble mean, approximately 60% of the observed rate of decline from 1979–2011 is externally forced"

While Notz and Marotzke (2012) found very poor correlation between oceanic cycles and sea ice extent, but very good correlation between CO2 and ice extent (Figure 8).

notz fig 4

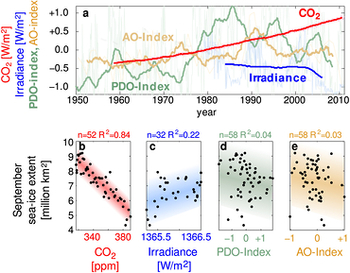
Figure 8: Correlation between September sea ice extent and CO2 forcing (red), solar forcing (blue), PDO index (green), and AO index (yellow).  Figure 4 from Notz and Marotzke (2012).

And based on the results of Vinnikov et al. (1999), there is less than 0.1% probability that the long-term decline in Arctic sea ice extent is due solely to natural variability.

Summary

The 2012 summer Arctic storm simply cannot be blamed for the record-shattering Arctic sea ice extent minimum. 

  • Arctic sea ice extent was already declining rapidly prior to the storm formation, to the second-lowest level on record.
  • The scientific literature shows that the Arctic is undergoing a fundamental change, with the remaining ice continually becoming thinner, weaker, and more vulnerable, and that this decline is primarily human-caused.
  • Sea ice experts agree that unlike in 2007, the 2012 Arctic weather conditions were not ideal for melting ice, and while the the summer storm played a part in the record minimum, it was not the main cause.
  • In the past, Arctic summer storms similar to the 2012 event did not have a major impact on sea ice extent or September sea ice minimum.
  • The 2012 record-breaking minimum can be attributed to a number of factors.  The summer storm likely played a role, but primarily because the ice was thinner, weaker, and less extensive to begin with than in prior years due to its long-term human-caused decline.
  • The scientific literature indicates that Arctic storms may be becoming more intense, in part due to increased open water as the sea ice continues its long-term human-caused decline.

Note: this post has been incorporated into the rebuttal to the myth Arctic Storm Caused the 2012 Record Sea Ice Minimum

0 0

Printable Version  |  Link to this page

Comments

Prev  1  2  

Comments 51 to 73 out of 73:

  1. Dale @ 47
    It is not unreasonable to propose that the Arctic storm was the cause of "such a large margin".
    Equally, it is not unreasonable to propose that the margin would have been larger if the weather had been different. It is playing games to argue for one outcome or the other. Only if you can stipulate what the weather would have been like, in response to the factors that caused the storm, can you stipulate what the result might have been. The storm had a cause before the event, so you must stipulate what would have happened if not the storm. Clearly, it would not have been business as usual, so just excising the storm without replacing it with effects that caused the storm is hand waving.
    0 0
  2. Dale's 'Look! A monkey!' tactics have been thoroughly demolished but I'd like to throw one more rock. Hope I didn't miss something already said. The effect of the storm was to smash up weak ice and leave a greater proportion of strong multiyear ice in what was left. So even if the storm were replaced with Dale's 'normal', is it not likely that melting, having more weak ice to work on, would have proceeded faster and longer than it did in reality, thus significantly or even mostly wiping out the differential effect of the storm?
    0 0
  3. And you forget, Dale, that average ice age, and therefore ice thickness and strength, was much lower going into this summer than in previous years with storm events, making the ice far more susceptible to being broken up by a storm of similar magnitude. The proximate cause of this year's dramatic breakup and subsequent melt out may have been the storm, but the ultimate cause was the multi year decline in ice thickness due to the increased warming in the Arctic.
    0 0
  4. Dana @50 Clarification: it's the qualification "by such a large margin".
    0 0
  5. Let's see what happened to volume. The following is a graph of 15-day linear trends starting on July 15th. The dates on the graph are the last day of the 15-day base period. There is indeed a dip where the storm occurs. There is indeed a recovery. Must have been a storm at the beginning of August in 2011, too, 'cause there's a dip there, too. Just checked. Nope. PIOMASLinAug2012
    0 0
  6. @Dale, The proof I believe can be found in the ice loss charts themselves. Best if you look at all the different charts. If the August storm was indeed a prime mover of ice loss then there should have been a dramatic change in the slope of the losses over an extended period or if not that a near vertical drop at that point. All charts do show a dip, but if you compared the slope pre storm to the slope post storm the general slope of losses did not change that much, nor was there a vertical drop. Certainly it did more damage to the ice then already there, but the end result I believe would have been just about the same. The argument that it was following the same trend as 2007 at that point is also very incorrect. It just happened that the 2 years matched at that point. The truth of the situation was that the starting point of this years melt was far higher then in 2007 so that the slope 2012 was on was far steeper then in 2007, and just continued on that path. The only way 2012 before the storm could have avoided smashing the records was to have all of Aug and Sept to be very cold, cloudy, calm conditions.
    0 0
  7. 54 It is just as likely, if not more so, that the large margin of ice loss compared to the previous record was marginally helped by a cyclone that was significantly amplified in power by the vast amount of ice loss in the ocean where it spawned and then spun to full power. Who begat who? I do think that objectivity is compromised if a cyclone is labeled as a storm when all the metrics show a low system existed that can only be described as a cyclone (963mb). Choosing not to call it a cyclone only opens the door for contrarians to ask: why is it being low-balled, to suggest that something is being hidden and then to ask for what purpose are they suggesting this was not a cyclone of historic proportions? Tell them how big it was, mention how powerful it was, and add that the ice loss was on a trajectory for a new low before the cyclone helped it along. It's not the record that is the big news, it is the cycle of loss that is showing no signs of abating.
    0 0
  8. Thanks Bob Loblaw, you throroughly answered my question then :) I didn't think about checking Neven's posts on skepticalscience, hence my miss. The difference of rate of loss between the storm day in 2012 and the other years does not seem that staggering. Therefore, I have difficulties with the NASA loss numbers due to storm indicated by Dale. So I searched on the Internet, and after a few tries making me land in Watts's universe, I found the following : http://earthobservatory.nasa.gov/IOTD/view.php?id=79256 where they say that August sea ice loss rates were enhanced by the storm, but no quantitative indication of the storm effect on the total sea ice minimum. From a naive point of view, and using Bob's graphs, I would say that the loss was in the 50-100 000 km² range, but not 750 000 km². I'm terribly sorry to disturb everyone here, but could someone please share with me a link from NASA/NOAA with the 750 000 km² number ?
    0 0
  9. correction : "the added loss by the storm" instead of "the loss" in the last paragraph. I substracted 2012's figure from the mean of other years for the corresponding days, and then I widly integrated. All of that with my eyes as a calculator, so don't put too much weight on this estimate :]
    0 0
  10. Looking at this discussion, there are a couple of ionteresting things going on. Firstly, there has been a re-framing of what the article is about. The article was a response to various claims that the arctic minimum was not evidence for a decline in Arctic ice (ideally some more of these could be cited). The messaging was often subtle and implicit, along the lines: 'Declining ice means new records, this record was a fluke, therefore there is no evidence for a decline'. Reading various news site comment threads you can see that the hoi polloi have taken the implied argument and run with it. The article was not directly addressing Dale's more neuanced position, although it contains work which is relevant to it. However the discussion has continued as if it did. You could call that a thread hijack (although I don't claim it was deliberate or even attribute it to a single poster or post, it happens unintentionally all the time). I do however think that one contributory factor was Dale's @5. Dale, I presume you would recognize that there is a well-used debating trick of asking an unanswerable question and then drawing conclusions (or inviting the audience to draw conclusions) from the fact the question has no answer. However, in context, the question could equally well be legitimate. None of us can decide without access to Dale's thoughts. Now an aside about skepticism. I've been thinking about whether real skeptic and fake skeptic arguments can be distinguished on the basis of form alone - whether fake skepticism has a fingerprint which can be detected without investigating the content of the argument. Here's the sort of thing I'd be looking for as a first guess, but it needs study (e.g. in climate forums):
    • Fake skeptics will start from a piece of evidence which supports their position, and avoid encountering additional evidence in case it is inconvenient to their position.
    • Real skeptics will be looking for additional evidence to test their views against.
    However this is confounded by the fact that fake skapticism is quick and easy to practice, where real skepticism is demanding and time consuming. In practice we can't afford genuine skepticism most of the time, so we make use of a comprehensive array of shortcuts. With that in mind, we can see that there are some 'real skeptic' responses in this thread - the ones which are looking for ways to estimate the impact of the storm. On that basis, can I suggest that this presents a constructive way to continue the discussion. We could take Dale's question at face value and look for good approaches to address it. Actually there are at least two interesting questions. How much extra melt did the storm cause, and are there other factors which can explain the year's extent drop?
    0 0
  11. A few possible lines. I don't have time to follow these up: 1. Obviously projecting sea ice anomalies forward across the storm is worth trying. The confounding factor is that the annual cycle seems to have been changing over recent years. This can be tested for the other storms as well. 2. While IIRC air temperatures were low this year, SSTs were high. If ice melt for other high SST years can be examined, then an attempt to determine the impact could be made. 3. Ice thickness, of course, which confounds any comparison with past years. While clearly a factor, I don't see a good way to test how big. 4. Other factors mentioned at Neven's: changing ocean circulation, influx of fresh water, low snow cover. First step: eyeballing the CT anomaly tape suggests ~300k drop over a month around the storm, but that ignores any decline which would be happening due to the new seasonal cycle. 2011 was also declining over the same period, so that's more likely an overestimate. Tamino has done something on anomalies against time varying baseline, that would be the next step.
    0 0
  12. My two cents on measuring storm impact. I think the first thing to do is eschew extent as the proper measure of the storm's impact. Extent/concentration is important in predicting potential melt conditions, but it's not a good metric for actual melt. I know using area has some issues (though the melt pond issue should be much less of an issue during the freeze season), and PIOMAS, while recently confirmed by Cryosat, has fairly large error bars. However, area and volume are still the more direct measures of melt, and the dailies are more problematic than the trends. Extent is highly variable and obviously especially susceptible to wind and current. It's the one place where "skeptics" don't have to work so hard at indulging in a bowl of cherries.
    0 0
  13. The storm was not the sole cause of the observed low area, but rather one factor involved. Storms like that are part of the natural variability (+/-) of Arctic ice extent. It was also not a sufficient cause for this years area, as seen by previous storms of similar magnitude not driving ice area to record lows. The storm was a contributing but not sufficient cause, one that only induced some variability over a multi-year trend of low ice volume due to another causal factor entirely - warming. In fact, if 2012 had the same weather factors as 2007, I expect the ice area minima would have been much much lower - this years weather was nowhere near as strong an influence on variability as 2007's. What dana1981 and Albatross have shown is that the 05 August 2012 storm cannot (by itself) be blamed for the low 2012 area, part of denying (as many 'skeptics' have attempted) the issue of declining total ice levels driven by global warming. Pointing to the storm and misattributing low Arctic extent solely to that variability factor is a "Look, squirrel" red herring.
    0 0
  14. Kevin C, I disagree. Dale's "question" amounts to an implication of the following: 1) Grudging acceptance that yes, there would be a record low this year, but... 2) We don't know how much the storm contributed to the low. 3) The storm therefore could be responsible for all ice melt more than a smidgeon over the record. 4) Therefore it's not really that big a deal, and we can delay a little longer. Outside of this context, the question of "how much did the storm contribute to the record" is really of no interest at all (at least to me). It was a reasonably rare storm, so how soon will it happen again? If it doesn't, then four years from now will you say "remember that storm back in 2012?" or will you say "oh, yeah, that, I'd forgotten." It is only of interest if changes in the Arctic make it not-so-rare anymore, in which case that is a big story in itself, that Arctic melt has generated an unexpected positive feedback in new weather systems that exacerbate the melt. It was also only one factor, and the main factors (serious melt in spite of otherwise mild weather) this year, as well as the main factor (global warming) that is demonstrated by the multi-year trend, are what are of interest, not singular events that affect the details. So... to me, the question and the lengthy debate are all designed to put doubt into people's minds as to whether or not this year's Arctic low means anything in terms of global warming in general and specifically the dangers of the future pace of Arctic summer ice melt. That's denial, plain and simple, and it angers me.
    0 0
  15. "That's denial, plain and simple, and it angers me." Sphaerica, I am *sooooo* there with ya! As I gather and store more and more data about the true severity of the pickle humanity has made for itself, and encounter more and more deniers (and I *will not* stop using hat term, when apropos) I too, get red-faced. However...after having acknowledged my human side and even having assuaged my baser instincts on some other blogs, in the end, we, the scientists who have the responsibility to present our data, interpretation, and findings in such a way as to "win over" the true skeptics to the side of "follow the data," must not cave to that anger, or at least attempt not to. To that end, what Kevin C said was really, really good: "Now an aside about skepticism. I've been thinking about whether real skeptic and fake skeptic arguments can be distinguished on the basis of form alone - whether fake skepticism has a fingerprint which can be detected without investigating the content of the argument. -Fake skeptics will start from a piece of evidence which supports their position, and avoid encountering additional evidence in case it is inconvenient to their position. -Real skeptics will be looking for additional evidence to test their views against. With that in mind, we can see that there are some 'real skeptic' responses in this thread.... On that basis, can I suggest that this presents a constructive way to continue the discussion. We could take Dale's question at face value and look for good approaches to address it." In my view, and knowing Dale's "other work on other blogs, I am fairly convinced that he's a fake skeptic, but slowly and surely has shown some signs of at least ~attempting~ to move over into real skepticism. He pushes and pushes--and yes, quite often, ties himself into rhetorical knots despite mounds and mounds of evidence against his incorrect rhetoric--against the data; IMHO, that *strenghtens* not only "our" data and findings, but it also teaches us humility and patience, neither of which I possess in great enough measure. My JPL/NASA buddy wrote me this bit of verbiage, which I find particualry engaging, viz, humanity's blindness to the issue, and our lack of response and why, in response to his reading of this article. "It's not so much that I believe that the needle is finely balanced. Rather it's sort of a broad crest. Yet, momentum is a viable analogy in this case. First: there is nobody taking their foot off the gas, much less applying the brakes. Second: at the decision level there is nobody (at the top corporate or government levels) even considering such a thing as it would give up short-term competitive position (which is what both types of leaders are evaluated on). So from this perspective it kinda doesn't matter. There's no braking going on. Momentum alone will probably carry us over the crest. Our foot is still pressing the pedal and so we are flying past rather than coasting." It's the fact of that racing past a point of literal no-return, and the level of obfuscation we see here from the Dales and the WTFUWT'ers, that certainly does make me angry, too. In the end, we (scientists) who work endlessly to try to get this message across, though human and who occasionally tend towards anger, must keep trying to engage the few Dales who seem to want to at least try to 'get it.' Inch by inch, row by row...;)
    0 0
  16. Dale @43 'NASA estimated from satellite pictures the extent of storm damage to be around 500,000 km^2.' Sorry Dale, reference for this assertion please. It doesn't pass the smell test. I can't believe that NASA would have given such a cut and dried figure for what essentially would be a very fuzzy estimate. It is standard operating procedure for 'fake skeptics' to throw numbers out there with no attribution and hope no-one notices. If you want to join the ranks of the real skeptics, you are going to have to back up everything you say.
    0 0
  17. Let's look a little closer at what might be required, if we want to figure out just how much of the season's drop in ice extent can be attributed to the storm. The trivial approach is to just say that the downward spike around day 220 in my comment #21 wouldn't be there if it weren't for the storm. As that graph is now on the previous page of comments, here it is again for ease of use: Image and video hosting by TinyPic From that visual, it does seem that quite a bit of ice extent was lost during the storm, thus it seems easy to think that if the storm didn't happen, the drop in ice extent would be that much less. But that ignores all the linkages between what was happening to ice and atmospheric dynamics before the storm, and what happened afterwards. The graph is also showing a five-day running average. Let's look at just the 2012 ice extent data for the period around the storm, without any smoothing: Image and video hosting by TinyPic Now we can see some of the increased variation from day-to-day. We can also see the storm - August 5 is day 218, and there are three days (218-220) of much greater loss of ice extent than is seen elsewhere in the graph. Again, the trivial answer would be to say that without the storm, those three days would have seen substantially less ice loss than actually happened - an eyeball estimate might be 80,000 sq.km per day, for a total of 240,000 sq. km. I say "trivial", because that analysis ignores several factors. First, the storm that hit on August 5 as the result of the weather patterns that preceeded it. If we magically change the physics so that the August 5 storm doesn't happen, then we need to magically change the physics of the period leading up to it. If we look at the prior week of ice extent loss, we then need to ask "what would have been different then?". A key feature of the preceeding week was relatively small losses on days 212-214. Perhaps the weather during that period was unfavorable to ice loss, and when the storm hit a few days later the rapid loss was simply a "catch-up"? If we draw a straight line from day 211 to day 215, it looks like days 212-214 were running about 170,000 sq. km "short". Same thing if you look at the week after the storm: there are several days that appear to have less ice loss than "normal". Is this because the storm caused a decrease in ice extent that was just ice that would have been lost a few days later anyway if the storm didn't happen? And because it was lost during the storm, it just wasn't available a few days later, so we see the lower loss rate? Just eyeballing the trends, I can see the potential for an extra 170,000 sq.km of ice loss over the period 221-227, if the highest points (least ice extent loss) were moved down to the 100,000 sq.km/day rates that occur at the bottom of the range. In either of these hypothetical scenarios, it is possible that the storm (in combination with the weather patterns that preceeded it or followed it) just affected the timing of the ice loss, and not the overall total. These "what if?" scenarios suggest that there is possibly just as much ice extent that was not lost during the week before or after the storm as there was lost during the storm - ice that would affect the seasonal minimum. To examine only the few days of the storm and hypothetically remove the storm, while ignoring the possible alternate realities for the time before or after the storm is to succumb to confirmation bias and motivated reasoning. ...and I haven't even considered the fact that ice extent isn't necessarily a good indicator of ice melt (as has been pointed out in other comments), nor have I considered the fact that the estimates of ice extent have error bars on them, so day-to-day variations may be partly noise rather than signal. All this complicates the analysis, and means that a lot more would need to be examined in order to come up with a meaningful estimate of how the storm affected the seasonal minimum in ice extent. To try to assess the effects of the storm by just looking at the spike in extent loss is a fool's errand, as I said earlier. Drawing such conclusions from a single graph and source of data is just handwaving.
    0 0
  18. It seems pretty certain that the extra melt this year was indeed due to the huricane that at 964mb is on the border between a class 2 and a class three. With counter clockwise currents pushed by the counter clockwise winds and flung outwards (to the right) by Coriolis, you would expect such a storm to cause upwelling in the eye of the storm bringing up the warmer Atlantic water that lies under the fresher cooler Arctic water. This all misses the point. Storms are powered by open water and by the steepness of the pressure gradient from surrounding areas to the site of the storm. We can expect more of these storms in the coming summer. Just imagine what will happen when there is no longer ice protecting Greenland from the summer hurricane and the storm sidles up to the northern shore of Greenland. Heat powered up into the atmosphere and katabatic winds down the slopes of Greenland. This year's melt will pale into insignificance.
    0 0
  19. william: Would it be possible for you to expand on just what you mean by "extra melt" (e.g., extra compared to what?), and on what train of thought/logic/analysis/evidence leads you to say that it is "pretty certain"?
    0 0
  20. Bob Loblaw (multiple posts), Thank you for your thoughtful and insightful analysis and commentary. Thanks too to others who have provided constructive commentary on this. Dale made some incorrect claims and I'll address one or more of them in the next post.
    0 0
  21. Just to set the record straight on some of Dale's misconceptions (assuming that someone is still paying attention). 1) Dale @33 claimed that, "But what we're talking about in this article is attribution, ie: how much ice melt did the storm or underlying conditions cause? He seems to have misunderstood the intent of the post, or is trying to reframe the argument to fit his narrative. Either way, the above statement misses the point of the post. 2) Dale @44 claimed that, "....and no conclusion of increasing frequency or intensity of storms over time can be made." That is not correct and misrepresents the content of the post, I suggest Dale reads it again . Some studies have found evidence of increasing frequency and/or intensity of Arctic Basin storms (e.g., Hakkinen et al. 2008) over a 50-yre period. In contrast, Screen et al. (2011) found no evidence for an increase in frequency of Arctic storms over the satellite era, but they did find evidence of an increase in the intensity of storms. Again, this is all stated in the main post. Long and Perrie (2012) have even proposed a theoretical mechanism that may be causing this increase in the intensity of storms, and it has to do with the loss of sea ice exposing more open water. 3) Just a general comment. Screen et al. (2011) found that it was the cyclone activity early in the spring (May through July) that that is critical in determining the final minimum extent. The storm of 2012 occurred in August. So that fact right away casts doubt on the claim being made by "skeptics" that this event was responsible for the record low.
    0 0
  22. "...(assuming that someone is still paying attention)." I am! I am, Alby! Then again, I'm a complete sucker for a well-spoken scientist....grrrrrrr...;) I've come to the realization, esp. after watching Frontline a few nights ago, that the *only* thing we can do, as those who follow, interpret, and understand the data, is to keep on refuting it, time and time and time, after immeasureable TIME again. Dale can continue to try, but, IMHO, to those who lurk or those whoa re jsut quiet (real) skeptics, the constant and calm debunking of the Dales of the world is what will win the day. I hope....
    0 0
  23. Just a pingback. Neven's blog has a recent (Jan 31) post on this, reporting on paper that has just appeared in the online version of Geophysical Research Letters. Neven's post points back here, too. Summary: don't blame the 2012 record low ice extent on the August storm.

    0 0

Prev  1  2  

You need to be logged in to post a comment. Login via the left margin or if you're new, register here.


The Consensus Project Website

THE ESCALATOR

(free to republish)


© Copyright 2024 John Cook
Home | Translations | About Us | Privacy | Contact Us