
We recently discussed Santer et al. (2011), which compared the observed trends in the temperature of the lower troposphere (TLT) with those predicted by climate models. The paper also examined claims by John Christy in testimony to US Congress that TLT is warming at just one-third the rate predicted by climate models, and found that he had greatly exaggerated the model-data discrepancy.
Santer et al. also examined what models have to say about short-term trends, and concluded as follows:
"Because of the pronounced effect of interannual noise on decadal trends, a multi-model ensemble of anthropogenically-forced simulations displays many 10-year periods with little warming. A single decade of observational TLT data is therefore inadequate for identifying a slowly evolving anthropogenic warming signal. Our results show that temperature records of at least 17 years in length are required for identifying human effects on global-mean tropospheric temperature."
So there are two key findings here. Firstly, even with man-made global warming taken into account, because of the short-term noise due to the internal variability in the climate system, climate models predict that there will be decades where natural cycles dampen the man-made warming trend.
Secondly, in order to identify the human influence on global temperatures, we must examine at least 17 years' worth of data (unless we first filter out the natural noise). This finding undermines the many "skeptic" claims that global warming stopped in 1995 or 1998 or 2001 or 2005, etc. etc.
Roger Pielke Sr. weighed in on Santer et al. (2011) on his blog, and he did concede the first key finding above:
"I agree with Santer et al that “[m]inimal warming over a single decade does not disprove the existence of a slowly-evolving anthropogenic warming signal.”
Unfortunately, Dr. Pielke seems to have neglected the second key finding above, as he proceeds to examine 13 years of TLT data.
"they did not recognize that the global average temperature trend in the lower troposphere has been nearly flat as shown, for example, in the figure below from the RSS MSU data...There has been NO long-term trend since the large El Nino in 1998. That’s 13 years."
So why examine 13 years' worth of data? That seems like a rather arbitrary figure - it's larger than 10, but smaller than the 17 year timeframe which Santer et al. concluded is necessary to evaluate the human influence on global temperatures. Dr. Pielke recently answered this question:
"I did not start in 1998 because it was the warmest in the record. I started after that when the MSU LT became ~flat."
However, part of the reason the TLT data is "~flat" over that period is that 1998 was an anomalously hot year. As Dr. Pielke notes in the quote above, 1998 was a "large El Niño year." In fact, not just a large El Niño; 1997-1998 saw one of the strongest El Niños on record. And the TLT data are more sensitive to ENSO events than surface temperature data (Figure 1).
Figure 1: RSS (blue), UAH (green), and GISTEMP (red) 12-month running averages since 1979.
The El Niño peak in 1998 and La Niña trough in 2008 in particular are much more evident in the satellite data sets than in the surface temperature record.
Tamino has also previously performed a multiple regression of temperature on various short-term effects, including the Multivariate ENSO Index (MEI), and confirms that TLT data are much more sensitive to ENSO than surface temperature data (Figure 2).
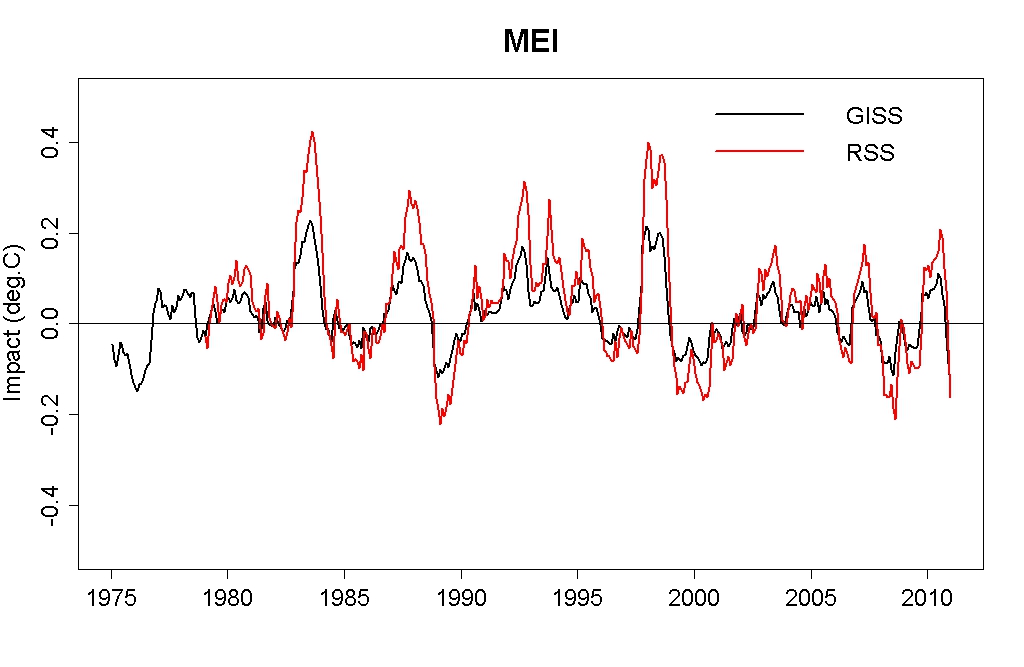
Figure 2: Impact of MEI on RSS TLT and NASA GISS surface temperature (Source: Open Mind)
In short, 1998 was an anomalously warm year due to the record strong El Niño that year, especially in the satellite TLT data. Therefore, choosing 1998 as the starting year will result in minimizing the short-term temperature trend.
To further illustrate the point, if we choose a timeframe of 14 years of RSS TLT data, there is a positive trend. If we choose 12 years, it's even more positive. Dr. Pielke has said he chose the RSS data in his critique because it's "the same data that is used in the Santer et al study." However, Santer et al. examined both UAH and RSS data.
If we examine UAH data (which Dr. Pielke has said this is an "outstanding" data set) starting in 1998, even the 13-year TLT trend is positive. The start data also makes a big difference in the short-term trend. The UAH trend is 0.10°C per decade since 1997, 0.06°C per decade since 1998, and 0.18°C per decade since 1999. Note that changing the starting date by a single year from 1998 to 1999 triples the UAH TLT trend.
If we heed the findings of Santer et al. and examine at least 17 years worth of data, the trend over that period is positive in both UAH (0.14°C per decade) and RSS (0.07°C per decade). Dr. Pielke subsequently criticized the application of a linear trend to this data:
"My view, is that focusing on a linear trend with respect to a actual nonlinear signal is a substantial oversimplication of how we should expect the climate sytstem to behave both naturally, and in response to the diversity of human climate forcings."
However, over such a short timescale, the forcings are not significantly non-linear, and thus calculating the linear trend is appropriate. In fact, it's an approach that Dr. Pielke himself frequently implements (i.e. here and here and here and here). When asked for evidence that the short-term forcing is significantly non-linear, Dr. Pielke responded that a linear trend does not explain all of the "ups and downs" in the data. However, the ups and downs in the short-term are due to natural variability, and are the reason why Santer et al. concluded that we must examine at least 17 years worth of data to identify the human signal. While the longer-term trend might not accurately be evaluated with a linear fit, in the short-term, it's a reasonable approximation.
The animation below illustrates the problem with focusing on such short timespans. The first frame shows the data Dr. Pielke has focused on - RSS data since 1998 (plus the linear trend) in blue. The following frame shows what the data looks like if we instead choose UAH data since 1999 (in green). Note that we are not advocating this choice, but simply showing what a large difference such a small change in start date can make. The third frame shows the entire UAH and RSS record.
Dr. Pielke has more recently suggested examining the TLT data since 2002:
"I suggest that the hypothesis be that
"The lower tropospheric global annual average temperature trend (TLT) from 2002 until now cannot distinguished from a zero trend."...and the trends during this time period are different than the trends earlier in the time period. "
However, as Dikran noted in response, it's entirely possible that over such a short timeframe, short-term noise such as ENSO and solar cycles may have masked the continuing long-term global warming trend. Thus testing whether the trend since 2002 can be distinguished from zero:
"is not a particularly interesting hypothesis for the simple reason that the statistical power of the test is very low because the timespan over which the trend is computed is too short."
The signal-to-noise ratio is even less from 2002 to Present than 1998 to Present. Dr. Pielke is moving in the wrong direction, examining less data rather than more.
There are going to be short-term periods in which the noise dampens the underlying long-term signal, and periods when the noise amplifies it. If we're going to examine such short periods of data, we at least must filter out the effects which cause short-term noise.
Tamino has attempted this analysis by removing a number of exogeneous factors (ENSO, volanic, solar). He found that the long-term warming trend continues in both UAH and RSS, which have been temporarily dampened by those short-term effects over the past ~decade (Figure 4).
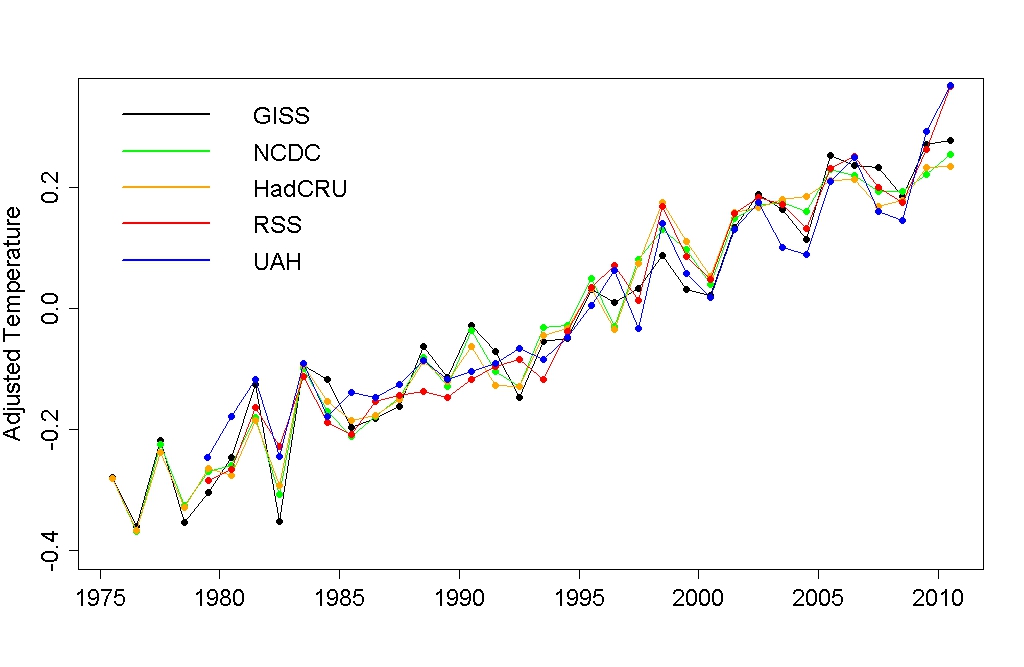
Figure 4: TLT and surface temperature data sets with exogeneous factors removed by tamino
In his blog post, both the data set and start date Dr. Pielke chose minimized the short-term TLT trend. Pielke was well aware of the strong El Niño in 1998, noting it in his post, and yet he chose this year as the start date of his analysis anyway.
It's also unclear why Dr. Pielke chose to make this 'no trend in 13 years' argument in a post commenting on Santer et al. (2011) to begin with, since the paper demonstrates that at least 17 years of data are necessary to evaluate the human influence on the TLT trend. Dr. Pielke also didn't examine why the short-term TLT trend has slowed over the past decade, as was done in Kaufmann (2011), for example.
The main take-home point here is that analysing short periods of data is fraught with challenges due to the short-term noise. It's entirely expected that over periods on the order of a decade, there will be times of little warming in surface temperatures, as Santer et al. (2011) demonstrated. We are currently in the midst of one of those periods. Over the past decade, solar activity has been low, anthropogenic aerosol emissions have risen, and ENSO has been primarily in its negative phase. Thus it's not unexpected that surface temperature warming has slowed, and when we account for these factors, we see that the underlying long-term warming trend continues. As tamino noted when analysing all the main surface temperature and TLT data sets (emphasis added):
"None of the [most recent] 10-year trends is “statistically significant” but that’s only because the uncertainties are so large — 10 years isn’t long enough to determine the warming trend with sufficient precision. Note that for each data set, the full-sample (about 30 years) trend is within the confidence interval of the 10-year trend — so there’s no evidence, from any of the data sets, that the trend over the last decade is different from the modern global warming trend."
Posted by dana1981 on Friday, 14 October, 2011
 |
The Skeptical Science website by Skeptical Science is licensed under a Creative Commons Attribution 3.0 Unported License. |