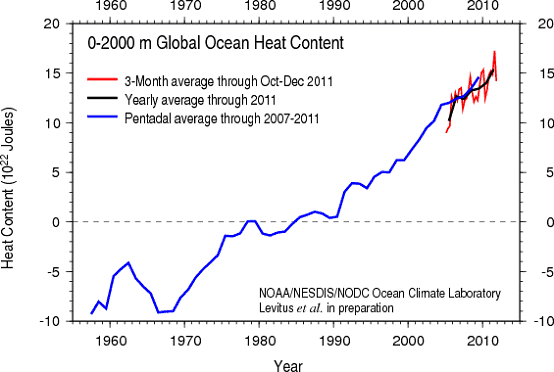
Levitus et al. had previously published updated ocean heat content (OHC) data on the National Oceanic Data Center (NODC) website, labeled as "Levitus et al. in preparation" (Figure 1).
Figure 1: Global OHC for the upper 2000 meters of oceans (NODC)
Levitus et al. (2012) is now in press, discussing the OHC data published by NODC. Figure 2 below (from Levitus et al.) presents the data in a similar fashion to Figure 1 above, but breaks out the data to show the OHC contribution from the 700 to 2000 meter ocean layer.
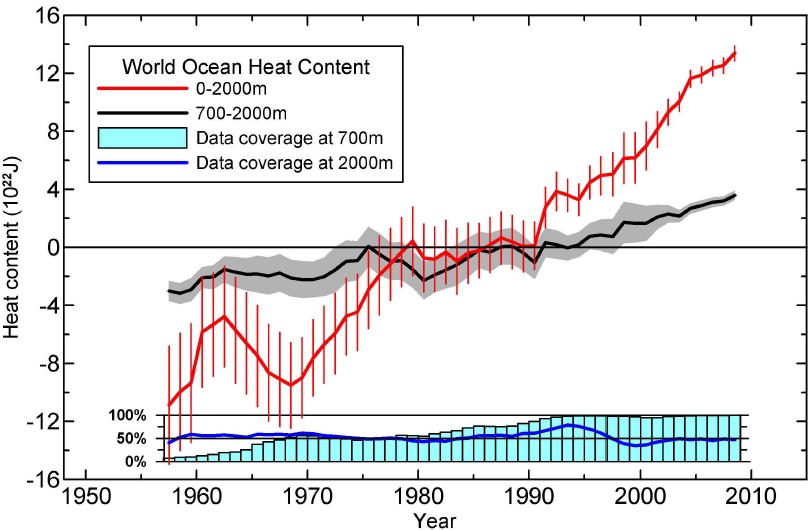
Figure 2: Time series for the World Ocean of ocean heat content (1022 J) for the 0-2000m (red) and 700-2000m (black) layers based on running pentadal (five-year) analyses. Reference period is 1955-2006. Each pentadal estimate is plotted at the midpoint of the 5-year period. The vertical bars represent +/- 2 times the standard error of the mean (S.E.) about the pentadal estimate for the 0-2000m estimates and the grey-shaded area represent +/- 2*S.E. about the pentadal estimate for the 700-2000m estimates. The blue bar chart at the bottom represents the percentage of one-degree squares (globally) that have at least four pentadal one-degree square anomaly values used in their computation at 700m depth. Blue line is the same as for the bar chart but for 2000m depth. From Levitus et al. (2012)
Levitus et al. use OHC measurements from ARGO floats corrected for systematic errors, as well as data from expendable bathythermographs (XBT) and mechanical bathythermographs (MBT), with the necessary corrections applied. A bathythermograph is an instrument which has a temperature sensor and is thrown overboard from ships to record pressure and temperature changes as it drops through the water. These were the main instruments used to measure OHC before the ARGO float network was deployed starting about a decade ago to provide more accurate and consistent data.
The authors discuss some of their key results:
"The World Ocean accounts for approximately 93% of the warming of the earth system that has occurred since 1955. The 700-2000m ocean layer accounted for approximately one-third of the warming of the 0-2000m layer of the World Ocean. The thermosteric component of sea level trend was 0.54 ±.05 mm yr-1 for the 0-2000m layer and 0.41 ±.04 mm yr-1 for the 0-700m layer of the World Ocean for 1955-2010."
This harkens back to some of the discussions between Skeptical Science and Roger Pielke Sr., who rightly noted that we cannot adequately measure global warming by considering surface temperatures alone, as most of the global heating has accumulated in the oceans. However, we noted at the time that Dr. Pielke was only considering the heating of the upper 700 meter ocean layer, which is also an incomplete measure of global warming. Levitus et al. confirm this by noting that in the upper 2000 meters, approximately one-third of the total heating has occurred below 700 meters.
Dr. Pielke had argued based on the 700 meter OHC data that global warming had slowed. Levitus et al. note this leveling off in the upper 700 meters in recent years, but that this recent flattening is much less apparent in the 2000 meter data, meaning that more heat is being stored in the 700-2000 meter layer recently (Figure 2).
"One feature of our results is that the previous multidecadal increase in OHC700 that we have reported [Levitus et al., 2009] (updated estimates available online at www.nodc.noaa.gov) leveled off during the past several years. This leveling is not as pronounced in our OHC2000 estimates indicating that heat is being stored in the 700-2000m layer as we have shown here."
Meehl et al. (2011) examined what climate models predict will happen during 'hiatus' decades in which surface temperatures plateau for short periods of time. They found that during these hiatus decades, less heat accumulates in the upper layers of the ocean, and more accumulates in the deeper layers (Figure 3).
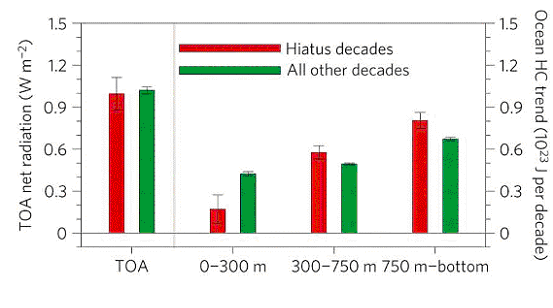
Figure 3: Left: composite global linear trends for hiatus decades (red bars) and all other decades (green bars) for top of the atmosphere (TOA) net radiation (positive values denote net energy entering the system). Right: global ocean heat-content (HC) decadal trends (1023 J per decade) for the upper ocean (surface to 300 m) and two deeper ocean layers (300–750m and 750 m–bottom), with error bars defined as +/- one standard error x1.86 to be consistent with a 5% significance level from a one-sided Student t-test. From Meehl et al. (2011)
The Meehl model results are exactly what Levitus find is happening. We are in the midst of a hiatus decade where global surface warming has been dampened, the increase of the upper OHC has slowed, but more heat is going into the deeper ocean layers.
The amount of global warming which has gone into the oceans over the past 55 years is quite impressive.
"The global linear trend of OHC2000 is 0.43x10²² J yr-1 for 1955-2010 which corresponds to a total increase in heat content of 24.0±1.9x10²² J"
This is an immense amount of energy being added to the oceans which Levitus et al. put into perspective (emphasis added):
"We have estimated an increase of 24x1022 J representing a volume mean warming of 0.09°C of the 0-2000m layer of the World Ocean. If this heat were instantly transferred to the lower 10 km of the global atmosphere it would result in a volume mean warming of this atmospheric layer by approximately 36°C (65°F)."
Levitus et al. note that of course this heat won't be instantly transferred to the atmosphere (fortunately!), and that this comparison is simply intended to illustrate the immense amount of energy being stored by the oceans.
This heating amounts to 136 trillion Joules per second (Watts), which as Glenn Tramblyn noted in a previous post, is the equivalent of more than two Hiroshima "Little Boy" atomic bomb detonations per second, every second over a 55-year period. And Levitus et al. note that this immense ocean heating has not slowed in recent years - more of it has simply gone into the deeper ocean layers.
Coincidentally, a team led by several Skeptical Science contributors recently submitted a paper for review which uses this NODC OHC data from Levitus et al. and comes to many of the same conclusions regarding continued global warming. With any luck, the paper will be published in a few months and we'll have more to say on the subject at that time. In the meantime, Levitus et al. have once again reminded us that although the surface warming may have been dampened in recent years, global warming hasn't magically vanished, and that heat stored in the oceans will eventually come back to haunt us.
Posted by dana1981 on Wednesday, 25 April, 2012
 |
The Skeptical Science website by Skeptical Science is licensed under a Creative Commons Attribution 3.0 Unported License. |