Realistically What Might the Future Climate Look Like?
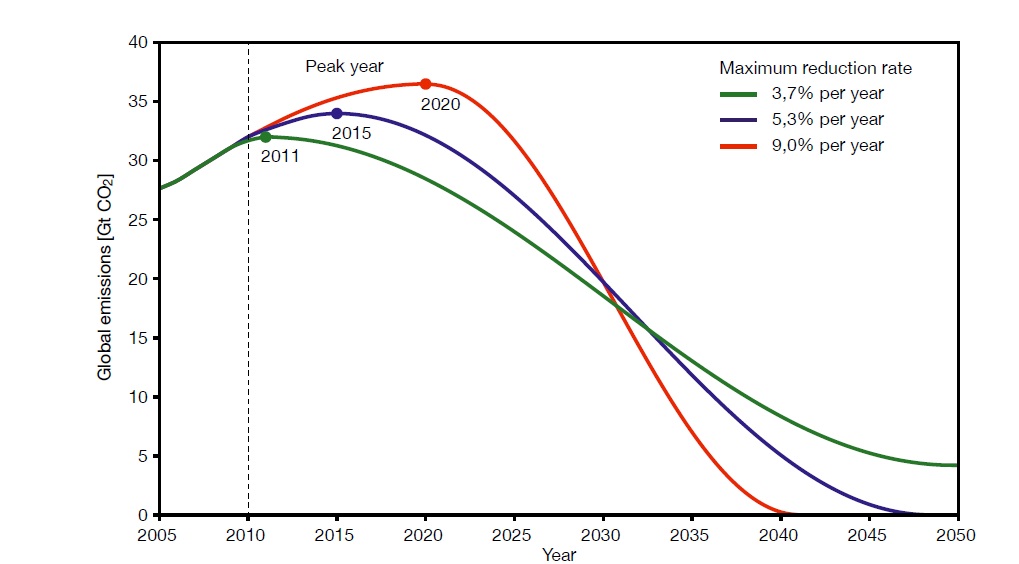
Robert Watson, former Chair of the Intergovernmental Panel on Climate Change (IPCC), recently made headlines by declaring that it is unlikely we will be able to limit global warming to the 2°C 'danger limit'. This past April, the International Energy Agency similarly warned that we are rapidly running out of time to avoid blowing past 2°C global warming compared to late 19th Century temperatures. The reason for their pessimism is illustrated in the 'ski slopes' graphic, which depicts how steep emissions cuts will have to be in order to give ourselves a good chance to stay below the 2°C target, given different peak emissions dates (Figure 1).

Figure 1: Three scenarios, each of which would limit the total global emission of carbon dioxide from fossil-fuel burning and industrial processes to 750 billion tonnes over the period 2010–2050. Source: German Advisory Council on Global Change, WBGU (2009)
Clearly our CO2 emissions have not yet peaked - in fact they increased by 1 billion tonnes between 2010 and 2011 despite a continued global economic recession; therefore, the green curve is no longer an option. There has also been little progress toward an international climate accord to replace the Kyoto Protocol, which suggests that the blue curve does not represent a likely scenario either - in order to achieve peak emissions in 2015 we would have to take serious steps to reduce emissions today, which we are not. The red curve seems the most likely, but the required cuts are so steep that it is unlikely we will be able to achieve them, which means we are indeed likely to surpass the 2°C target.
Thus it is worth exploring the question, what would a world with >2°C global surface warming look like?
Global Warming Impacts
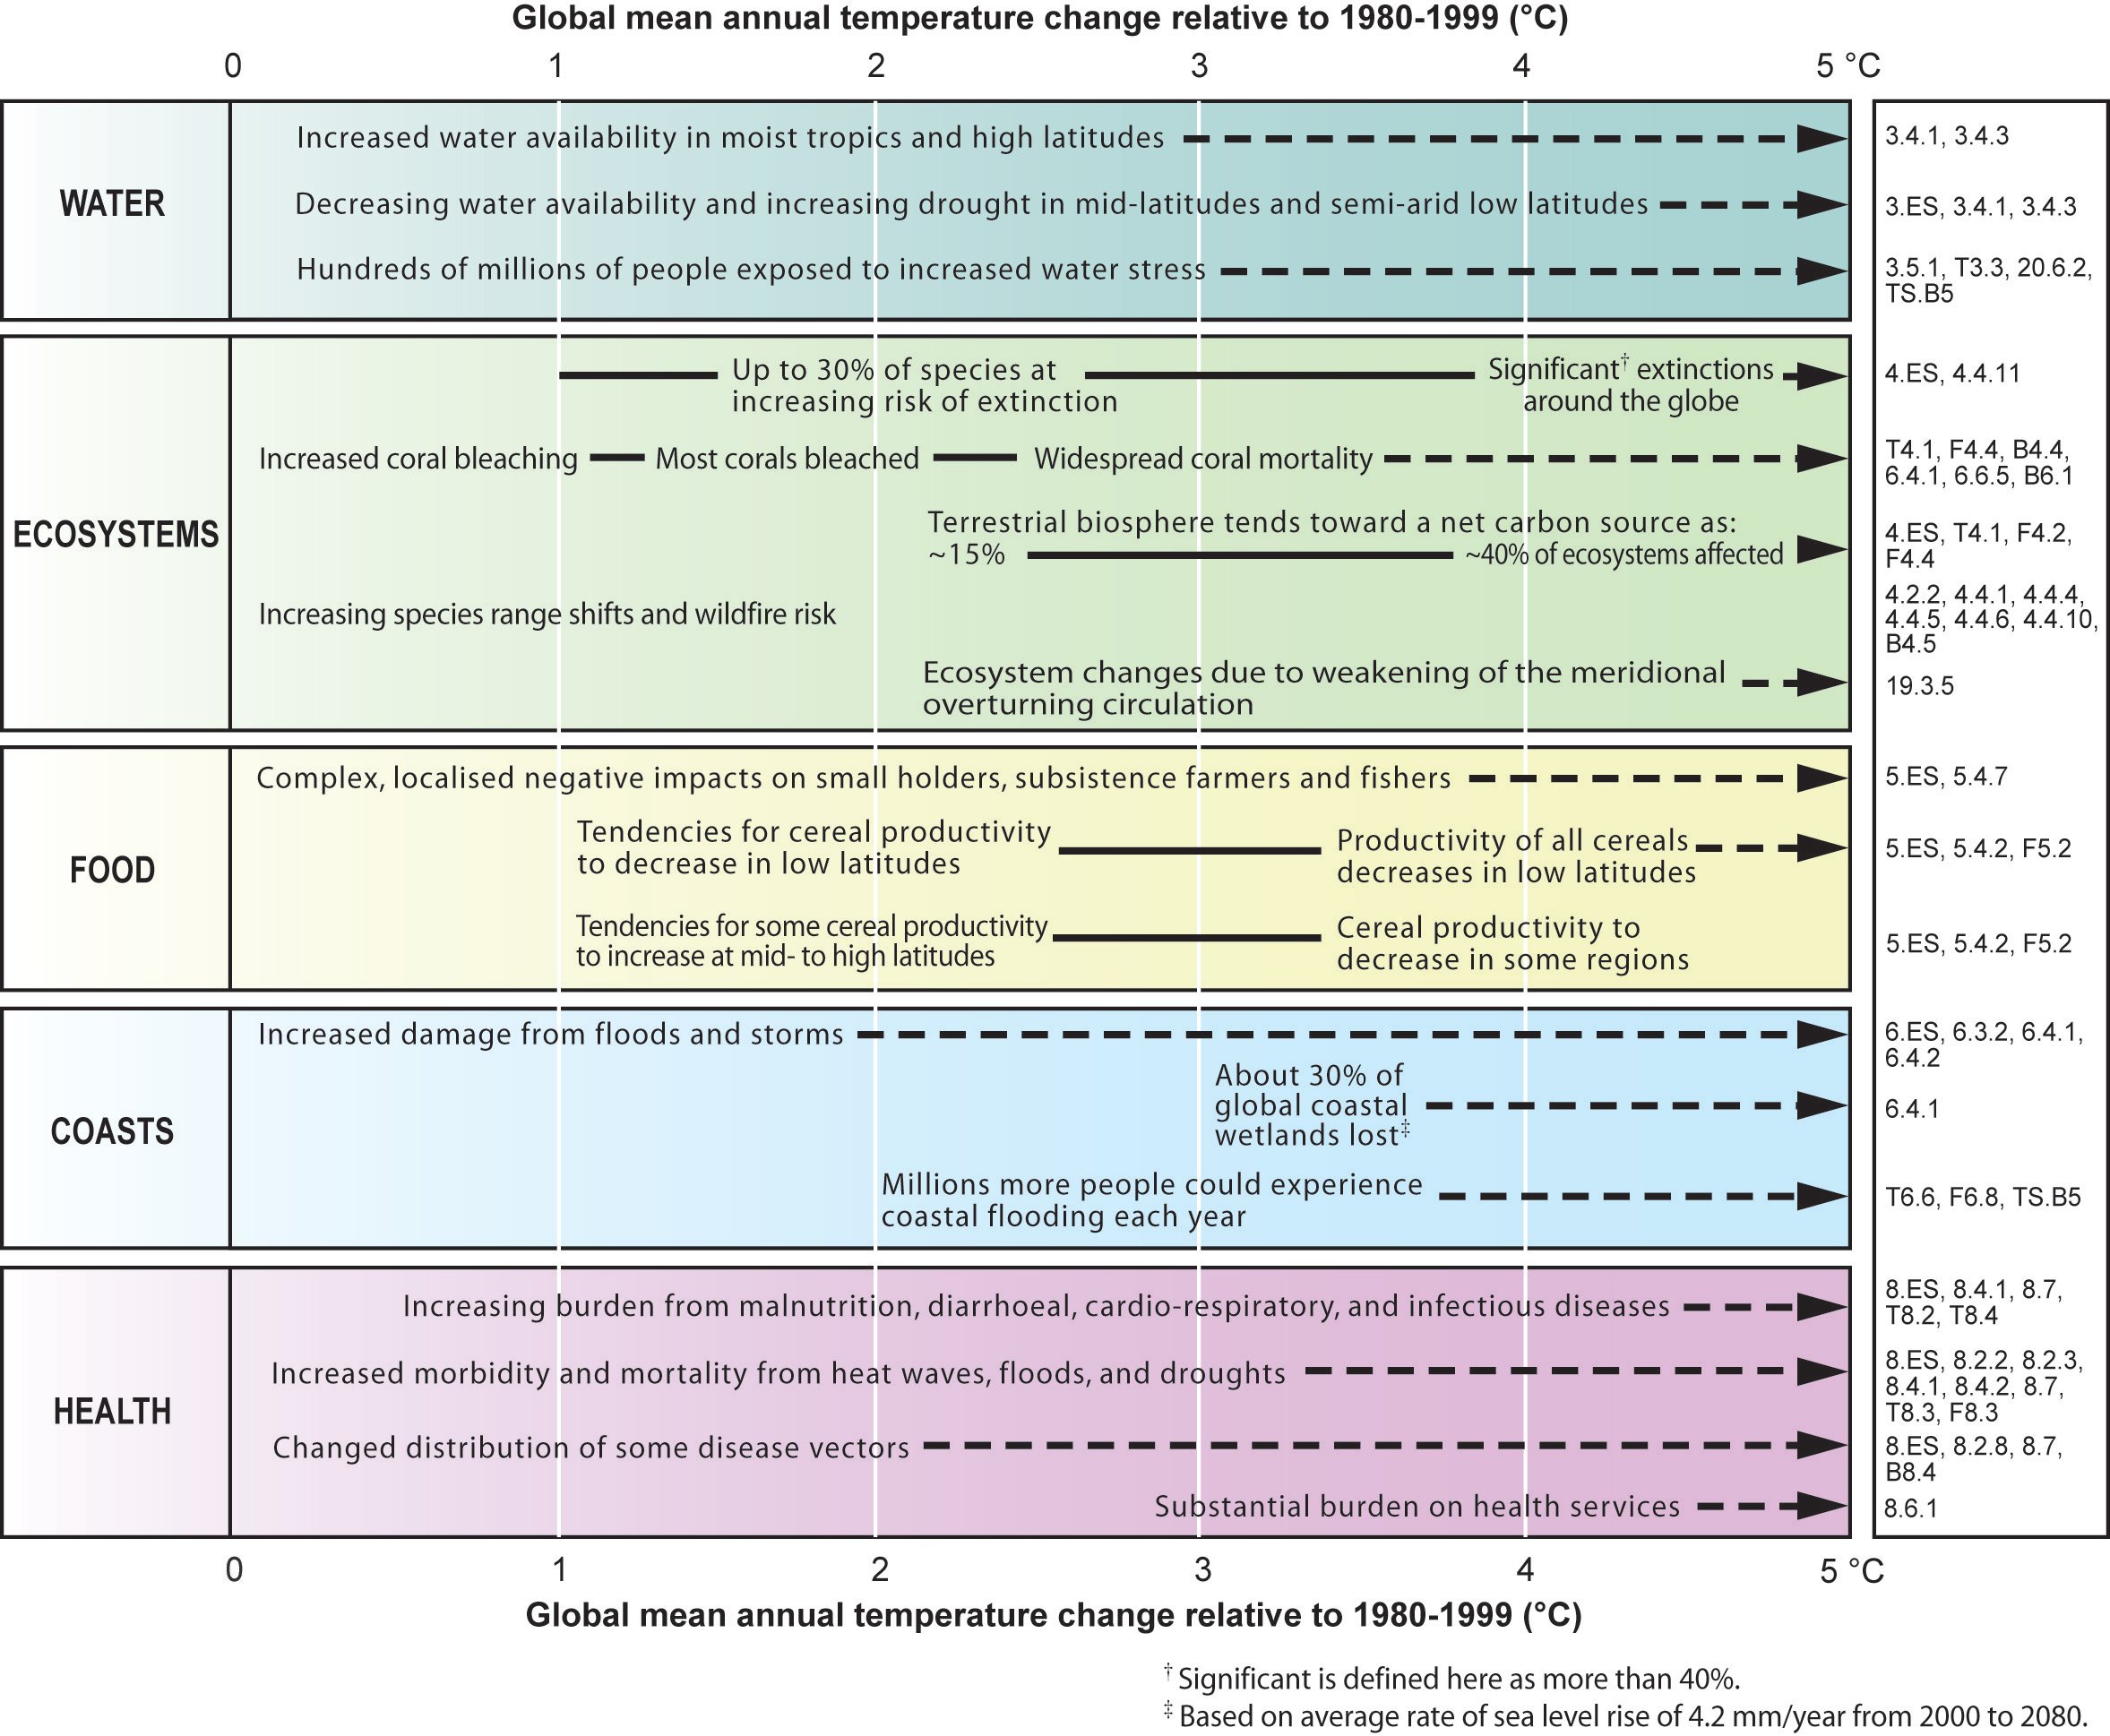
The 2007 IPCC Fourth Assessment Report (AR4) summarizes the magnitudes of impact of various degrees of warming here, and graphically in Figure 2, relative to ~1990 temperatures (~0.6°C above late 19th Century temperatures).

Figure 2: Illustrative examples of global impacts projected for climate changes (and sea level and atmospheric carbon dioxide where relevant) associated with different amounts of increase in global average surface temperature in the 21st century. The black lines link impacts, dotted arrows indicate impacts continuing with increasing temperature. Entries are placed so that the left-hand side of the text indicates the approximate onset of a given impact. Quantitative entries for water stress and flooding represent the additional impacts of climate change relative to the conditions projected across the range of Special Report on Emissions Scenarios (SRES) scenarios. Adaptation to climate change is not included in these estimations. Confidence levels for all statements are high. IPCC AR4 WGII Figure SPM.2. Click the image for a larger version.
Some adverse impacts are expected even before we reach the 2°C limit, for example hundreds of millions of people being subjected to increased water stress, increasing drought at mid-latitudes (as we recently discussed here), increased coral bleaching, increased coastal damage from floods and storms, and increased morbidity and mortality from more frequent and intense heat waves (see here), floods, and droughts. However, by and large these are impacts which we should be able to adapt to, at a cost, but without disastrous consequences.
Once we surpass the 2°C target, the impacts listed above are exacerbated, and some new impacts will occur. Most corals will bleach, and widespread coral mortality is expected ~3°C above late 19th Century temperatures. Up to 30% of global species will be at risk for extinction, and the figure could exceed 40% if we surpass 4°C, as we continue on the path toward the Earth's sixth mass extinction. Coastal flooding will impact millions more people at ~2.5°C, and a number of adverse health effects are expected to continue rising along with temperatures.
Reasons for Concern
Smith et al. (2009) (on which the late great Stephen Schneider was a co-author) updated the IPCC impact assessment, arriving at similar conclusions. For example,
"There is medium confidence that ~20–30% of known plant and animal species are likely to be at increased risk of extinction if increases in global average temperature exceed 1.5 °C to 2.5 °C over 1980–1999"
"increases in drought, heat waves, and floods are projected in many regions and would have adverse impacts, including increased water stress, wildfire frequency, and flood risks (starting at less than 1 °C of additional warming above 1990 levels) and adverse health effects (slightly above 1 °C)"
"climate change over the next century is likely to adversely affect hundreds of millions of people through increased coastal flooding after a further 2 °C warming from 1990 levels; reductions in water supplies (0.4 to 1.7 billion people affected with less than a 1 °C warming from 1990 levels); and increased health impacts (that are already being observed"
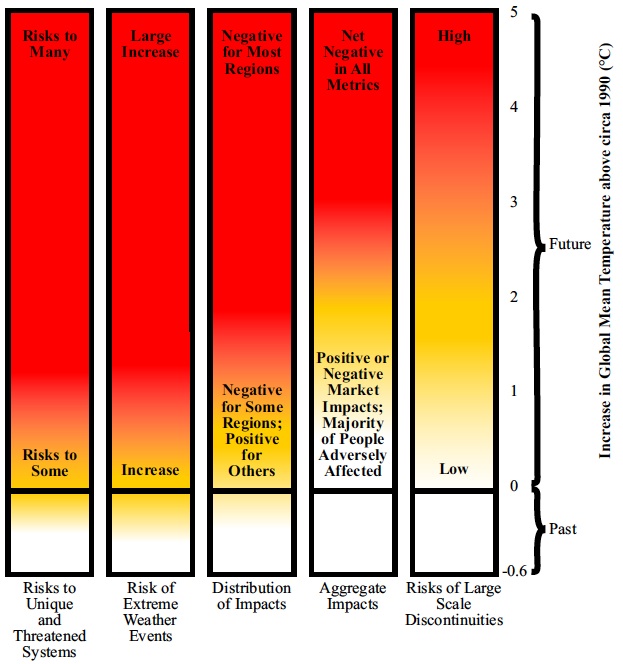
Smith et al. updated the 2001 IPCC report 'burning embers' diagram to reflect their findings (Figure 3). On this figure, white regions indicate neutral or low impacts or risks, yellow indicates negative impacts for some systems or more significant risks, and red indicates substantial negative impacts or risks that are more widespread and/or severe. They have grouped the various climate change consequences into 'reasons for concern' (RFCs), summarized below.

Figure 3: Risks from climate change, by reason for concern (RFC). Climate change consequences are plotted against increases in global mean temperature (°C) after 1990. Each column corresponds to a specific RFC and represents additional outcomes associated with increasing global mean temperature. The color scheme represents progressively increasing levels of risk and should not be interpreted as representing ‘‘dangerous anthropogenic interference,’’ which is a value judgment. The historical period 1900 to 2000 warmed by �0.6 °C and led to some impacts. It should be noted that this figure addresses only how risks change as global mean temperature increases, not how risks might change at different rates of warming. Furthermore, it does not address when impacts might be realized, nor does it account for the effects of different development pathways on vulnerability.
-
Risk to Unique and Threatened Systems addresses the potential for increased damage to or irreversible loss of unique and threatened systems, such as coral reefs, tropical glaciers, endangered species, unique ecosystems, biodiversity hotspots, small island states, and indigenous communities.
-
Risk of Extreme Weather Events tracks increases in extreme events with substantial consequences for societies and natural systems. Examples include increase in the frequency, intensity, or consequences of heat waves, floods, droughts, wildfires, or tropical cyclones.
-
Distribution of Impacts concerns disparities of impacts. Some regions, countries, and populations face greater harm from climate change, whereas other regions, countries, or populations would be much less harmed—and some may benefit; the magnitude of harm can also vary within regions and across sectors and populations.
-
Aggregate Damages covers comprehensive measures of impacts. Impacts distributed across the globe can be aggregated into a single metric, such as monetary damages, lives affected, or lives lost. Aggregation techniques vary in their treatment of equity of outcomes, as well as treatment of impacts that are not easily quantified.
-
Risks of Large-Scale Discontinuities represents the likelihood that certain phenomena (sometimes called tipping points) would occur, any of which may be accompanied by very large impacts. These phenomena include the deglaciation (partial or complete) of the West Antarctic or Greenland ice sheets and major changes in some components of the Earth’s climate system, such as a substantial reduction or collapse of the North Atlantic Meridional Overturning Circulation.
All of these reasons for concern enter the red (substantial negative impact, high risk) region by 4°C. Aggregate impacts are in the red region by 3°C, and some types of concerns are in the red region by 1°C.
For more details we also recommend Mark Lynas' book Six Degrees, which goes through the climate impacts from each subsequent degree of warming, based on a very thorough review of the scientific literature. A brief review of the book by Eric Steig and summary of some key impacts is available here. National Geographic also did a series of videos on the Six Degrees theme, which no longer seem to be available on their websites, but which can still be found on YouTube.
This is Why Reducing Emissions is Critical
We're not yet committed to surpassing 2°C global warming, but as Watson noted, we are quickly running out of time to realistically give ourselves a chance to stay below that 'danger limit'. However, 2°C is not a do-or-die threshold. Every bit of CO2 emissions we can reduce means that much avoided future warming, which means that much avoided climate change impacts. As Lonnie Thompson noted, the more global warming we manage to mitigate, the less adaption and suffering we will be forced to cope with in the future.
Realistically, based on the current political climate (which we will explore in another post next week), limiting global warming to 2°C is probably the best we can do. However, there is a big difference between 2°C and 3°C, between 3°C and 4°C, and anything greater than 4°C can probably accurately be described as catastrophic, since various tipping points are expected to be triggered at this level. Right now, we are on track for the catastrophic consequences (widespread coral mortality, mass extinctions, hundreds of millions of people adversely impacted by droughts, floods, heat waves, etc.). But we're not stuck on that track just yet, and we need to move ourselves as far off of it as possible by reducing our greenhouse gas emissions as soon and as much as possible.
There are of course many people who believe that the planet will not warm as much, or that the impacts of the associated climate change will be as bad as the body of scientific evidence suggests. That is certainly a possiblity, and we very much hope that their optimistic view is correct. However, what we have presented here is the best summary of scientific evidence available, and it paints a very bleak picture if we fail to rapidly reduce our greenhouse gas emissions.
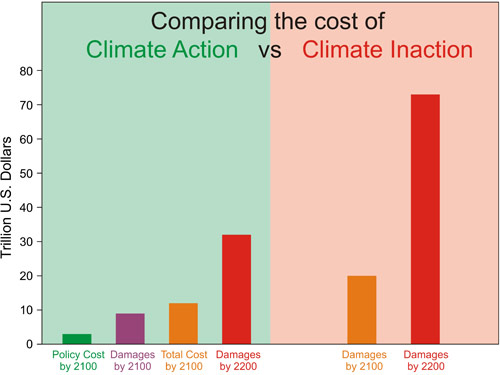
If we continue forward on our current path, catastrophe is not just a possible outcome, it is the most probable outcome. And an intelligent risk management approach would involve taking steps to prevent a catastrophic scenario if it were a mere possibility, let alone the most probable outcome. This is especially true since the most important component of the solution - carbon pricing - can be implemented at a relatively low cost, and a far lower cost than trying to adapt to the climate change consequences we have discussed here (Figure 4).

Figure 4: Approximate costs of climate action (green) and inaction (red) in 2100 and 2200. Sources: German Institute for Economic Research and Watkiss et al. 2005
Climate contrarians will often mock 'CAGW' (catastrophic anthropogenic global warming), but the sad reality is that CAGW is looking more and more likely every day. But it's critical that we don't give up, that we keep doing everything we can do to reduce our emissions as much as possible in order to avoid as many catastrophic consequences as possible, for the sake of future generations and all species on Earth. The future climate will probably be much more challenging for life on Earth than today's, but we still can and must limit the damage.
Note: this post has been incorporated into the Advanced rebuttal to the myth "it's not bad."
Posted by dana1981 on Friday, 31 August, 2012


