PAGES (Past Global Changes) is a scientific network which supports research aimed at understanding the Earth’s past environment in order to make predictions for the future. It's funded by the U.S. and Swiss National Science Foundations, and the National Oceanic and Atmospheric Administration (NOAA). Over 5,000 scientists from more than 100 countries subscribe to PAGES, which is essentially an organizational group to bring international scientists together.
In 2006, scientists in the PAGES network decided to organize an initiative to reconstruct the climate of the last 2,000 years, which they called The PAGES 2k Network. This network consists of scientists from 9 regional working groups, each of which collects and processes the best paleoclimate (past climate change) data from their respective region. It's a clever approach because it allows the experts in their local proxy data to contribute to a much larger global project.
The 2K Network has just published a major paper in Nature Geoscience (abstract and figures here), with 78 researchers contributing as co-authors from 60 separate scientific institutions around the world. The analysis combines records from tree rings, pollen, corals, lake and marine sediments, ice cores, stalagmites and historical documents from 511 locations across seven continental-scale regions to reconstruct past global surface temperature changes over the past 2,000 years.
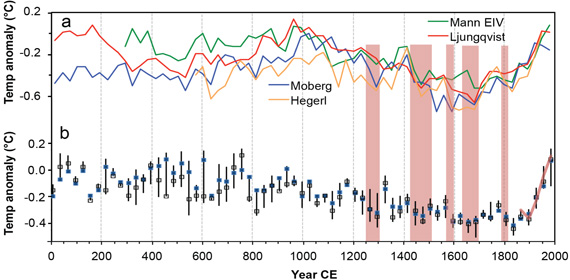
Their two main results are a confirmation that current global surface temperatures are hotter than at any time in the past 1,400 years (the general 'hockey stick' shape, as shown in Figure 1), and that while the Medieval Warm Period (MWP) and Little Ice Age (LIA) are clearly visible events in their reconstruction, they were not globally synchronized events.
Figure 1: a) Previously published Northern Hemisphere 30-year-mean temperature reconstructions relative to the 1961–1990 reference period. b) Standardized 30-year-mean temperatures averaged across all seven continental-scale regions. Blue symbols are area-weighted averages, and bars show 25th and 75th unweighted percentiles to illustrate the variability among regions; open black boxes are unweighted medians. The red line is the 30-year-average annual global temperature from the HadCRUT4 instrumental time series relative to 1961–1990, and scaled visually to match the standardized values over the instrumental period.
The 2k Network was able to include temperature reconstruction data for every continental-scale region except Africa, where proxy data is too sparse to create an accurate reconstruction. An Ocean2k project is underway to reconstruct ocean temperatures. The paper notes,
"Reconstruction domains for the PAGES 2k regions reported here encompass 36% of the Earth’s surface. Although the regions largely coincide with the continents rather than climatological criteria, the annual mean temperature averaged over these regions explains 90% of the global mean annual temperature variability in the instrumental record"
The types of temperature proxy data used from each continental-scale region are illustrated in Figure 2.
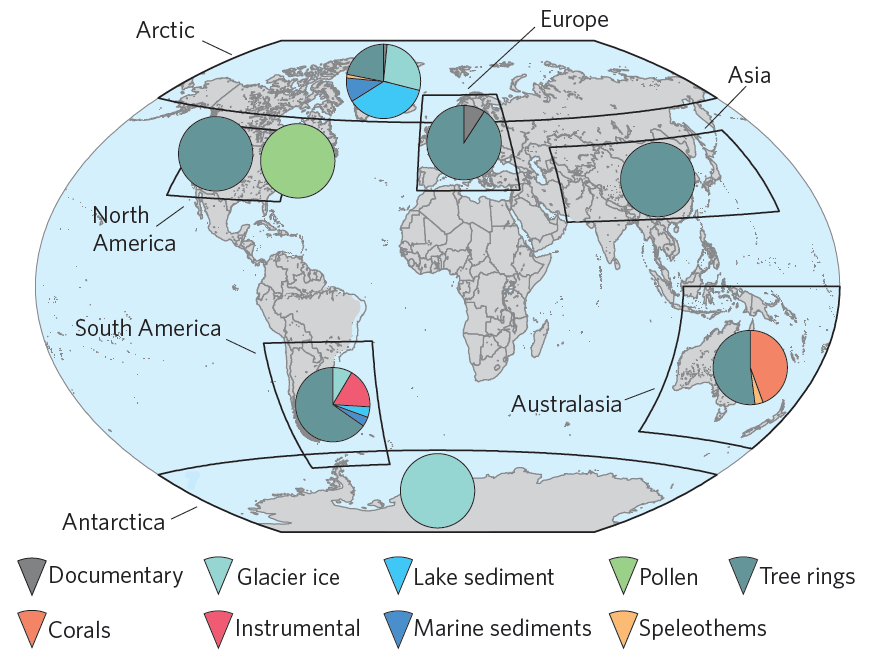
Figure 2: Boxes show the 7 continental-scale regions used in the PAGES 2k study. The pie charts represent the fraction of proxy data types used for each regional reconstruction.
The 2k team found that:
"Over their respective record lengths, all regions experienced a long-term cooling trend followed by recent warming during the twentieth century, except Antarctica ... The regional rate of cooling varies between about 0.1 and 0.3°C per 1,000 years ... In general, the overall trends in the 30-year-averaged PAGES 2k Network reconstructions agree with those in the alternative reconstructions"
In examining the local records individually, the team found that the longer the record, the more likely it was to exhibit a long-term cooling trend. They ran an ensemble of simulations with a climate model of intermediate complexity to evaluate the causes of past climate changes. The authors found that consistent with previous research, changes in solar and volcanic activity, land cover, and incoming solar radiation due to the Earth's orbital cycles were the main contributors to the cooling between the MWP and LIA (the years 900–1600), and probably also caused the cooling over the full 2,000-year period. The relative contribution of each factor to the long-term cooling varied in the different regions.
The 2k results highlighted non-uniform temperature variations in different locations around the world. They do observe a 'Medieval Warm Period' between the years 800 and 1400, but different regions warmed at different times, consistent with the findings of previous research.
"the period from around AD 830 to 1100 generally encompassed a sustained warm interval in all four Northern Hemisphere regions. In South America and Australasia, a sustained warm period occurred later, from around AD 1160 to 1370."
In the Arctic and Europe, they also found relatively high temperatures during the first centuries AD, consistent with a 'Roman Warm Period.' The Arctic, Europe, and Asia transitioned from the MWP to colder temperatures sooner than North America and the Southern Hemisphere. By around the year 1580, all regions except Antarctica had entered into a 'Little Ice Age', and remained in cold conditions until the late 1800s.
"Our regional temperature reconstructions also show little evidence for globally synchronized multi-decadal shifts that would mark well-defined worldwide MWP and LIA intervals. Instead, the specific timing of peak warm and cold intervals varies regionally, with multi-decadal variability resulting in regionally specific temperature departures from an underlying global cooling trend."
In their reconstruction of 20th century temperatures, the 2k team found clear warming in every region except Antarctica, where warming may have been slowed by the surrounding ocean waters.
"Excluding Antarctica, the twentieth-century average temperature among the six regions was about 0.4°C higher than the averaged temperatures of the preceding five centuries"
They also found warming was twice as rapid in the Northern than the Southern hemisphere, due again to ocean dampening, since there is more ocean mass in the Southern than Northern hemisphere. The Arctic had the fastest warming due to polar amplification; about three times that of the average of the other five non-polar regions.
The team compared their best estimate reconstructed temperature for 1971–2000 with all other consecutive 30-year periods within each regional reconstruction.
Overall, the team concluded that current temperatures are probably warmer than any other 30-year period in the last 1,400 years. Europe appears to have been hotter during the 'Roman Warm Period', but the Arctic is hotter now.
"of the 52 individual records that extend to AD 500, more sites (and a higher proportion) seem warmest during the twentieth century than during any other century. The fraction of individual records that indicates the highest temperatures during 1971–2000 decreases with increasing record length, consistent with an overall cooling trend over the past two millennia"
Overall, the PAGES 2k paper provides the best overall reconstruction of local and global surface temperature changes over the past 1,000–2,000 years. As illustrated in Figure 1, their overall results are largely consistent with previous millennial temperature reconstructions like those by Mann et al. (2008), Ljungkvist (2010), Moberg et al. (2005), and Hegerl et al. (2006).
They find that over the past 2,000 years, until 100 years ago, the planet underwent a long-term cooling trend. There was a 'Medieval Warm Period', but different regions warmed at different times, and overall global surface temperatures were warmer at the end of the 20th century than during the MWP peak. The 2,000-year cooling trend has been erased by the warming over the past century. And of course more warming is yet to come from continuing human greenhouse gas emissions.
It's also worth noting that according to the instrumental temperature record, average surface temperatures for 1982–2012 have been about 0.2°C hotter than the 1970–2000 average. That additional warming would put current global surface temperatures well above any other time over the past 2,000 years. The PAGES 2k team concludes,
"the global warming that has occurred since the end of the nineteenth century reversed a persistent long-term global cooling trend. The increase in average temperature between the nineteenth and twentieth centuries exceeded the temperature difference between all other consecutive centuries in each region, except Antarctica and South America."
Also see discussions of the PAGES paper at RealClimate, Carbon Brief, and by John Cook at The Conversation.
Note: these results have been incorporated into the rebutal to the myth 'Medieval Warm Period was warmer.'
Posted by dana1981 on Monday, 22 April, 2013
 |
The Skeptical Science website by Skeptical Science is licensed under a Creative Commons Attribution 3.0 Unported License. |