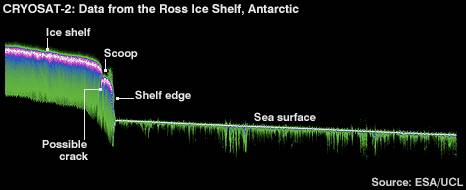
Figure 1: New data from the recently launched Cryosat-2 over the Ross Sea
Guest post by Robert Way
This post summarizes the three key methods through which ice sheet losses are measured using satellite data. Although there are indeed some on site measurement techniques which are used by glaciologists, it has become the norm to use satellites for large scale measurements because of their cost-efficiency and coverage compared to on the ground measurement techniques. With regards to understanding Antarctic ice changes, these techniques are all the more important because of the continent’s size, climate, and isolation. Of all the different methods out there, it has become clear that there are three predominant techniques for accurate measurement of ice sheet changes. These consist of measuring elevation change, mass change and flux components.
Changes in the elevation of ice across the Antarctic ice sheet is measured using both laser and radar altimetry. Sensors such as these measure the distance from the satellite to the ice surface over time. Radar altimeter signals provide very good coverage for ice sheets but older versions of these satellites had issues with too low a resolution (2-5 km) leading to difficulties in measuring sloped/rough terrain. This low resolution also makes it difficult to measure small outlet glaciers where most mass wastage (ice loss) in Antarctica occurs.
Radar altimeter signals also penetrate the near-surface snow and ice layer introducing a potential bias to the data processing (Allison et al. 2009). A new radar satellite "Cryosat-2" has recently been placed into orbit equipped with a much higher resolution radar altimeter that uses complicated radar combination techniques (radar interferometry) to enhance the radar's horizontal resolution to 250 m while allowing for precise measurements of changes as small as a few centimeters. A further benefit of this satellite is that it will allow for the highest coverage available for an altimeter with measurements capable of being taken up to 88° N/S Latitude. Measurements have already been obtained from this satellite and have stunning detail (Figure 1).

Figure 1: New data from the recently launched Cryosat-2 over the Ross Sea
The second method of measuring elevation change is through using laser altimetry which is essentially a laser beam that measures the height from the satellite to ice surface. This measurement technique is extremely accurate and has a higher resolution than even the new radar altimeters but also has a small footprint (10s of meters) and can be affected by cloud cover (Allison et al. 2009). The most commonly used laser altimeter equipped satellite “Icesat” has no longer any working lasers thereby making satellite borne laser altimetry for ice sheets currently unfeasible but still applicable for aerial surveys or when icesat-2 is launched in 2015.
Gravimetry directly measures the change in regional gravitational fields through accurate measurements of the amount of effect that gravity has on satellites as they cross these regions. As mass is gained or lost it by the ice sheets, regional gravitational forces are affected, thereby making it possible for mass change estimates to be deduced. Ice sheet mass change has been detected using satellites to measure gravitational field changes through precise monitoring of the separation between a pair of satellites in identical orbits (GRACE Mission) (Allison et al. 2009). Although this method can be significantly affected by things such as crustal uplift and Glacial Isostatic Adjustment (GIA, crustal uplift after the depressing weight of an ice sheet/ice mass is removed), it is important to note that accelerations in mass loss can be detected very effectively and cannot be directly caused by GIA (Velicogna, 2009).
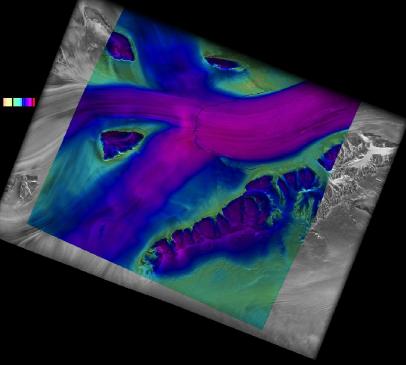
The flux component method refers to the estimation of the total mass inputs and mass outputs for each individual drainage basin and ultimately the ice sheet as a whole. Estimating the mass inputs requires knowledge of spatial and temporal patterns of snow accumulation in regions that are oftentimes unsurveyed. In order to make an ice sheet wide snow accumulation map, on site observations of mass through meteorological records, snow pits, ice cores and marker poles are used to ground truth regional accumulation models. These models have been shown to have good agreement with measurements in interpolated regions (Allison et al. 2009). The loss by outflow is usually estimated as the ice discharge across the grounding line of the ice sheet, as this is where ice begins to float and hence contribute to sea level rise. Estimates such as these require observations of the speed of ice flow and the thickness of the column ice. Radar Interferometry has allowed for direct all-weather measurements of surface velocities to be conducted through both a differential method and a speckle tracking method (Figure 2). Depth of ice streams has been estimated using varying means from bedrock topography models to ground penetrating radar surveys.

Figure 2: Example of Radar Interferometry Velocity Measurements. Presentation by Eric Rignot at the Alos Palsar Symposium.
Satellite observations have been used to provide wide coverage of ice surface velocities but because the velocity of an ice sheet varies with depth a further level of uncertainty is added to the discharge estimates. For glaciers which move using mostly basal sliding such as outlet glaciers and ice streams with high velocities, this uncertainty is minimized because there is less variation in velocity with depth.
Conclusion
Overall when considering the different measurement techniques, it is important to note that although each individual technique has its own uncertainties, they each can and do effectively measure ice losses in
Part three will consist of a detailed rebuttal of several of Goddard’s recent pieces. This section will use much of the information from Parts One and Two in order to formulate this rebuttal.
I would like to thank Professor Jon Ove Hagen (University of Oslo) for helping to proofread and discuss these postings.
Allison,
Velicogna,
Posted by robert way on Thursday, 15 July, 2010
 |
The Skeptical Science website by Skeptical Science is licensed under a Creative Commons Attribution 3.0 Unported License. |