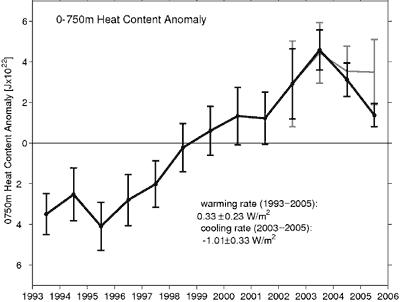
Figure 1: Yearly ocean heat content anomaly in the upper 750 metres.
Everyone loves a good mystery. If J.K. Rowling hadn't finished her series so emphatically, "Mystery of the Vanishing Ocean Heat" could've been the 8th Harry Potter book. The latest intrigue is the revelation that the oceans have showed a cooling trend since 2003. As oceans take in 84 percent of the heat absorbed by the Earth, ocean temperature is a good measure of global warming. Does this mean global warming has ended?
First, to clear up one common misconception. One paper oft quoted is Recent Cooling of the Upper Ocean (Lyman 2006). This found a rapid drop in ocean heat from 2003, as measured by the Argo network deployed in 2000. Argo is a global array of 3,000 free-drifting floats that measures the temperature and salinity of the upper 2000 metres of the ocean.

Figure 1: Yearly ocean heat content anomaly in the upper 750 metres.
However, the cooling trend was found to be exagerated when Lyman et al updated their results in Correction to “Recent Cooling 1 of the Upper Ocean” (Willis 2007). Systematic measurement biases introduced a spurious cooling trend since 2003. While this is somewhat old news, Lyman 2006 continues to be cited, including a recent comment on Skeptical Science.
Nevertheless, the trend since 2003 is that of slight cooling, albeit not so dramatic. A new paper Assessing the Globally Averaged Sea Level Budget on Seasonal and Interannual Time Scales (Willis 2008) displays up-to-date data on ocean heat.
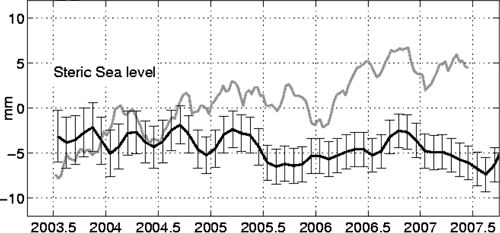
Figure 2: Steric component of global mean sea level (black line) with seasonal element removed.
Figure 2 displays the steric component of sea level rise. This is the sea level rise due to a change in sea water density, mostly due to thermal expansion and hence a measure of changing ocean heat. The black line shows a slight downward trend due to cooling temperatures (more on the grey line later).
However, upper ocean heat, like surface temperature, doesn't follow a monotonically warming trend during global warming. Ocean temperatures experience interannual variability and over the past 3 decades of global warming have had several short periods of cooling.
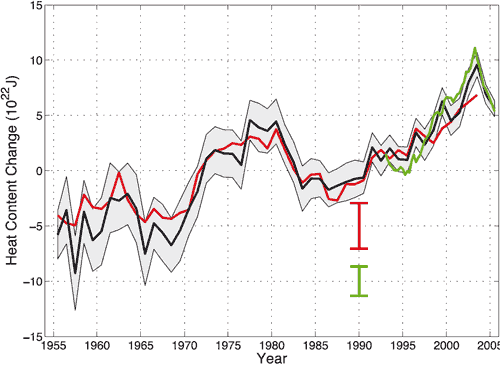
Figure 3: global annual upper ocean heat content. Black curve from Levitus 2005, red curve from Ishii 2006, green curves from Willis 2004. Red and green error bars denoting 90% confidence interval. Taken from IPCC AR4.
The early 80's and early 90's both display short term cooling trends. Low frequency analysis of ocean temperatures finds an 11 year cycle which correlates with the 11 year solar cycle (White 1997).
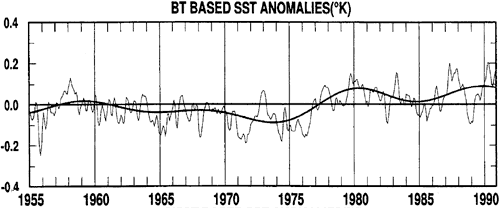
Figure 4: Bathythermograph measurement of sea surface temperatures.
This is not to say the solar cycle is driving current ocean cooling. White's later research (White 2003) finds the solar cycle is insufficient to explain the change in ocean heat content, attributing the cycle to internal mechanisms. The main point is that just as surface temperatures has experienced periods of short term cooling during long term global warming, similarly the ocean shows short term variability during a long term warming trend.
While the skeptic blogosphere is fixated on cooling ocean temperatures, the real mystery is being overlooked. Willis 2008 assesses the sea level budget which is described by the following equation:
hTOT = hSTERIC + hMASS
To close the sea level budget, total sea level rise (hTOT observed by altimeter satellites) should match the steric component (hSTERIC observed by Argo) plus the mass component (hMASS calculated from GRACE satellite measurements of the Earth's gravity field). The big surprise is that the rate of sea level rise hasn't dropped since 2003, continuing at over 3mm per year.
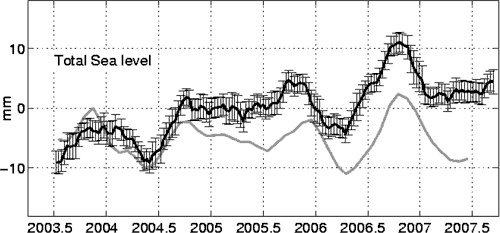
Figure 5: Total sea level rise as measured by altimeter satellites and confirmed by tidal gauges (black line). The grey line is what total sea level rise should be when adding the steric and mass components.
From 1993 to 2003, thermal expansion contributed slightly more than half the sea level rise with the rest coming from melting glaciers and ice sheets (IPCC AR4). If thermal expansion is no longer contributing, you would expect either less total sea level rise or a much greater contribution from melting ice. Neither have been observed.
The mass component of sea level rise is calculated from Grace satellite data which measures variations in the Earth's gravity field. The black line in Figure 6 below is the observed sea level rise due to a change in ocean mass. The grey line is the total sea level minus the steric sea level and should match the observed black line to close the sea level budget. The discrepancy is well outside the error bounds.
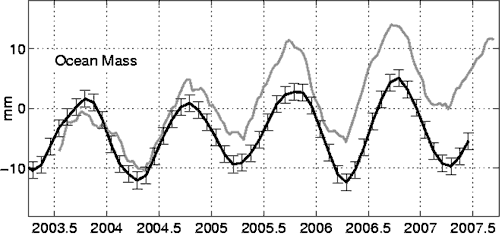
Figure 6: Observed mass component of sea level rise (black line). The grey line is the total sea level rise minus the steric sea level rise (eg - what the mass component is expected to be).
Over seasonal timescales, there is good agreement between total sea level rise and its components. The discrepancy emerges in the long term trend, which increases linearly at a rate of 3.3mm/year. What's the cause?
Argo takes measurements in the top 2000 metres of the ocean. Could the heat have moved to the deep ocean? This seems unlikely. Deep steric changes occur over time scales of decades or longer and aren't expected to explain the discrepancy over the last 5 years (Antonov 2005).
Willis 2008 speculates that there is most likely a systematic error in at least one of the three observing systems which is introducing a linear trend. It will be interesting to see how this issue is resolved over the next few years. Pity we can't flip to the last page now to find out how the mystery ends.
UPDATE 7 April 2009: Josh Willis has published an update on the missing ocean heat mystery. The answer? Instrument error showing the ocean was cooler than it actually is.
Posted by John Cook on Tuesday, 8 April, 2008
 |
The Skeptical Science website by Skeptical Science is licensed under a Creative Commons Attribution 3.0 Unported License. |