The Climate Show podcast have just released Episode 5. Their guest is Dr Brad Bass, an expert in “green” roofing who discussed the many advantages of growing things (even trees!) on our buildings. They also discuss last year’s record setting temperatures, the fakery of Don Easterbrook and an interesting breakthrough in solar power technology. Check it all out at the Hot Topic blog.
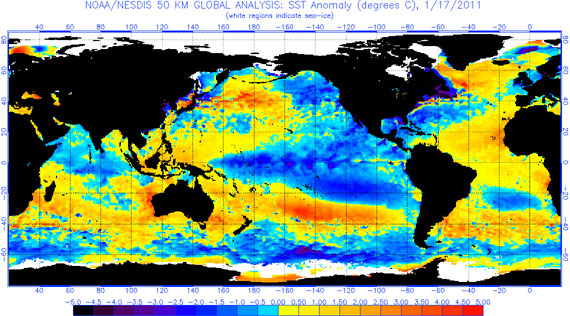
I talk to Glenn and Gareth about the Brisbane floods. I sent them a few pics to display during the interview - they include them in their show notes but I'll include some additional details below. A big factor in Queensland's heavy rainfall of late was conditions in the Pacific Ocean which is currently in a strong La Nina phase. The following picture shows La Nina conditions on Jan 17 (Monday just gone). You can see the effect of the strong trade winds pushing warm water to the west Pacific with cold, deeper water rising up to replace it in the east Pacific.

Figure 1: La Nina pattern on 17 Jan, 2011 (NOAA).

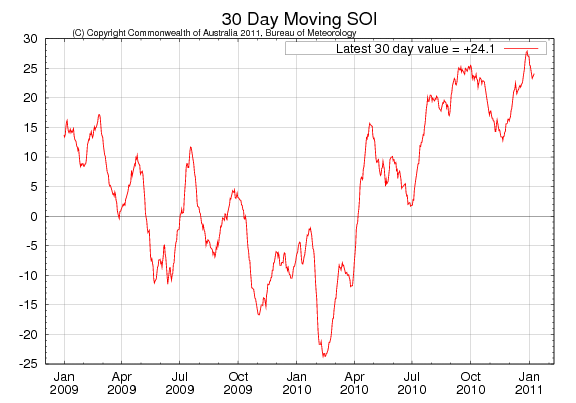
Figure 2: Southern Oscillation Index (Bureau of Meteorology).
Sea surface temperatures have steadily risen over the past century. Sea surface temperatures around Australia in 2010 were the hottest on record. Between January 3 to 13, CSIRO buoys off Queensland and Western Australia recorded sea surface temperatures 5°C above average.
Figure 3: Sea surface temperature around Australia (BoM).
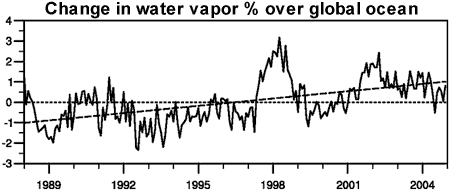
When sea surface temperatures warm, we get more evaporation. This means more water vapour in the air. Globally, atmospheric water vapour has increased by about 5% over the 20th century.
Figure 4: Change in water vapor percentage relative to the 1988 to 2004 period over the global ocean plus linear trend, measured by satellite (IPCC AR4 3.4.2.1).
At this point in the interview, I mentioned that the rise in atmospheric water vapour over the past 40 years was equivalent to around 900 Sydney Harbours - a factoid so pointless and bizarre, Gareth couldn't help laughing. Afterwards, someone emailed me, asking where that figure came from. Actually, I worked it out just before the interview. If anyone would like to check my calculations, they were as follows:
Around 1970, the water vapor in the atmosphere totaled about 1.27 x 10¹⁶ kg.
The Sydney harbour contains 556 gigalitres which weighs 5.56 x 10¹¹ kg.
Over the last half century, water vapor has increased about 4%. This is equivalent to 5.08 x 10¹⁴ kg which equals around 913 Sydney harbours.

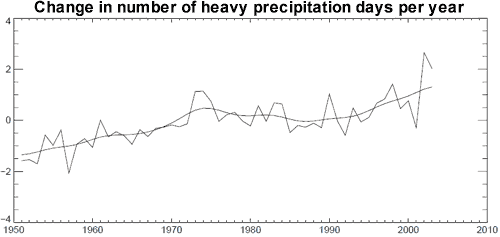
Figure 5: Global number of days per year when precipitation was greater than 10mm per day, expressed as an anomaly from the 1961 tp 1990 reference period (Alexander 2006).


Posted by John Cook on Friday, 21 January, 2011
 |
The Skeptical Science website by Skeptical Science is licensed under a Creative Commons Attribution 3.0 Unported License. |