Why is Greenland's ice loss accelerating?
Recently, we looked at satellite gravity measurements of the Greenland ice sheet, finding that Greenland is losing ice at an accelerating rate. This has now been confirmed by independent calculations of surface mass balance and ice discharge rates (van den Broeke et al 2009). More importantly, the extra data offers keen insights into the contributing factors of Greenland's accelerating ice loss.
Greenland's ice mass balance is governed by two factors: Surface Mass Balance (SMB) and ice Discharge (D). Surface Mass Balance is the result of ice gain from precipitation (rain & snow) minus ice loss from sublimation and runoff. In van den Broeke et al 2009, Surface Mass Balance is calculated by the Regional Atmospheric Climate Model which is then confirmed by on-site observations. Ice discharge is the loss of ice as glaciers calve into the ocean. Satellite measure the velocity of ice as it moves towards the coastline as well as the thickness of the glaciers. This data is combined to calculate the total amount of ice discharge (Rignot 2008).
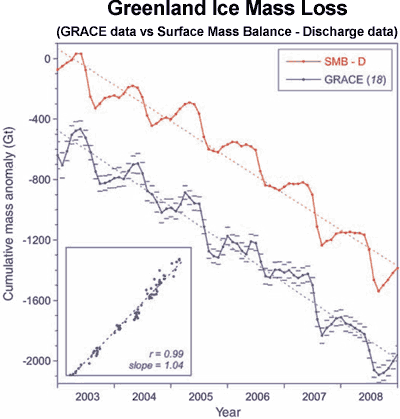
Greenland's total mass change is then calculated by taking the difference between Surface Mass Balance and Discharge. This result SMB - D can be directly compared to Greenland's total mass change as determined by the GRACE satellites' gravity measurements. The two independent time series show strong agreement as seen in Figure 1:

Figure 1: Surface Mass Balance - Discharge (red) compared with GRACE data (blue). GRACE data is offset vertically. Short horizontal lines indicate GRACE uncertainty. Dashed lines indicate linear trends. The scatter plot in the inset shows a direct linear regression between monthly GRACE values as a function of the cumulative SMB - D anomaly (van den Broeke et al 2009).
The Surface Mass Balance reconstruction also offers deeper insight into the various components that cause Greenland's mass loss. Figure 2 shows Greenland's total mass balance broken into its two components: Surface Mass Balance and Discharge. Don't be put off by the Discharge showing a positive upturn after 2000 - this is actually meant to indicate that Greenland is losing more mass due to ice discharge. We see that not only is Discharge increasing sharply due to faster moving glaciers, the Surface Mass Balance also fell sharply. Greenland's total mass loss over 2000 to 2008 is equally split between Surface Mass Balance changes and Ice Discharge.

Figure 2: Greenland mass balance and its components Surface Mass Balance (SMB) and Discharge (D). Before 1996, D and hence SMB - D, are poorly constrained and therefore not shown.
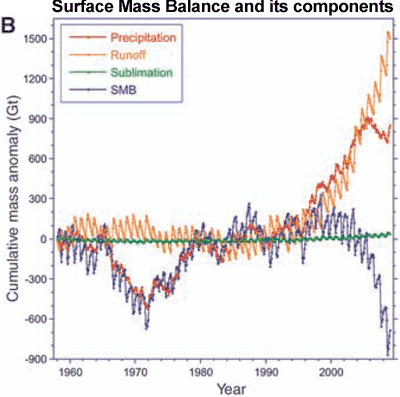
What caused Surface Mass Balance to fall? There are three components to Surface Mass Balance: precipitation (rain & snow), sublimation and runoff (primarily ice melting with the water running off into the ocean). Figure 3 shows the trends for each component along with the resultant Surface Mass Balance in blue. Again, note that while run-off (orange) is displayed as a strongly positive trend, this actually removes ice mass. On the other hand, precipitation adds ice mass through rain and snow. Between 1996 and 2004, runoff and precipitation anomalies both increase simultaneously, roughly cancelling each other out so that Surface Mass Balance remains relatively steady. After 2004, precipitation levels out while runoff remains high. This caused Surface Mass Balance to fall sharply.

Figure 3: Surface Mass Balance (blue) and its components precipitation (red), runoff (orange) and sublimation (green).
So Surface Mass Balance reconstructions tell us that the acceleration of Greenland ice mass loss is largely due to increased ice discharge and increased run-off. In other words, glaciers are moving faster into the ocean and more ice is melting. Currently, Greenland ice loss is contributing 0.74 mm of sea level rise per year. This is around 23% of the total sea level rise (3.1 mm per year).
Posted by John Cook on Tuesday, 17 November, 2009


