Lessons from Past Climate Predictions: IPCC FAR
 The Intergovernmental Panel on Climate Change (IPCC) First Assessment Report (FAR) was published in 1990. Its purpose was to assess the available scientific information related to the various components of climate change, and to formulate realistic response strategies for the management of the climate change issue. In the process, the FAR made some projections of future global warming, whose accuracy we will evaluate in this post.
The FAR used energy balance/upwelling diffusion ocean models to estimate changes in the global-mean surface air temperature under various CO2 emissions scenarios. Details about the climate models used by the IPCC are provided in Chapter 6.6 of the report.
The IPCC FAR ran simulations using various emissions scenarios and climate models. The emissions scenarios included business as usual (BAU) and three other scenarios (B, C, D) in which global human greenhouse gas emissions began slowing in the year 2000. In 2010, the atmospheric CO2 concentration in BAU projected by the FAR was approximately 400 parts per million (ppm), and in Scenarios B, C, and D was approximately 380 ppm. In reality it was 390 ppm, so we ended up right between the various scenarios. The FAR greenhouse gas (GHG) radiative forcing and CO2-equivalent for the scenarios is shown in Figure 1.
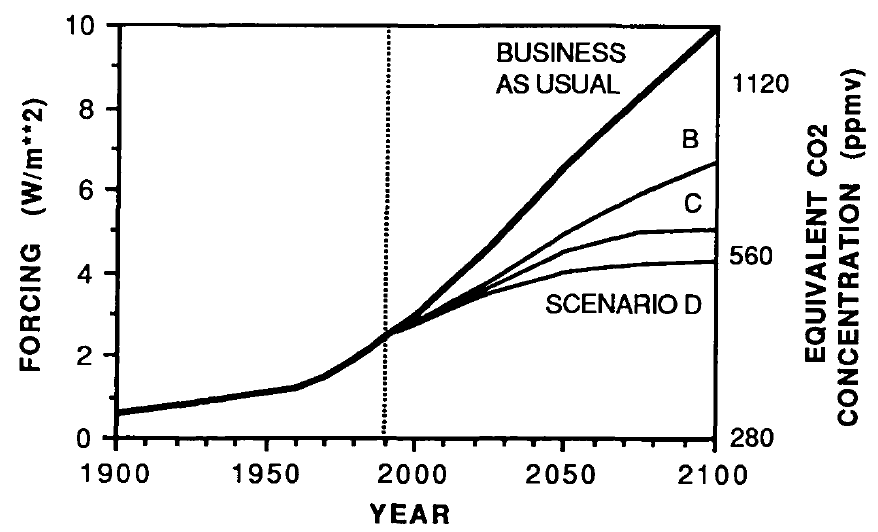
Figure 1: IPCC FAR GHG forcing and CO2-equivalent projections for the four emissions scenarios
As you can see, the FAR's projected BAU GHG radiative forcing in 2010 was approximately 3.5 Watts per square meter (W/m2). In the B, C, D scenarios, the projected 2010 forcing was nearly 3 W/m2. The actual GHG radiative forcing was approximately 2.8 W/m2, so to this point, we're actually closer to the IPCC FAR's lower emissions scenarios.
However, aerosols were a major source of uncertainty in 1990. In an improvement over Kellogg's 1979 projection study, the IPCC FAR was aware that an increase in atmospheric aerosols would cause a cooling effect. However, they had difficulty quantifying this cooling effect, and also did not know how human aerosol emissions would change in the future.
The IPCC FAR ran simulations using models with climate sensitivities of 1.5°C (low), 2.5°C (best), and 4.5°C (high) for doubled CO2 (Figure 2).
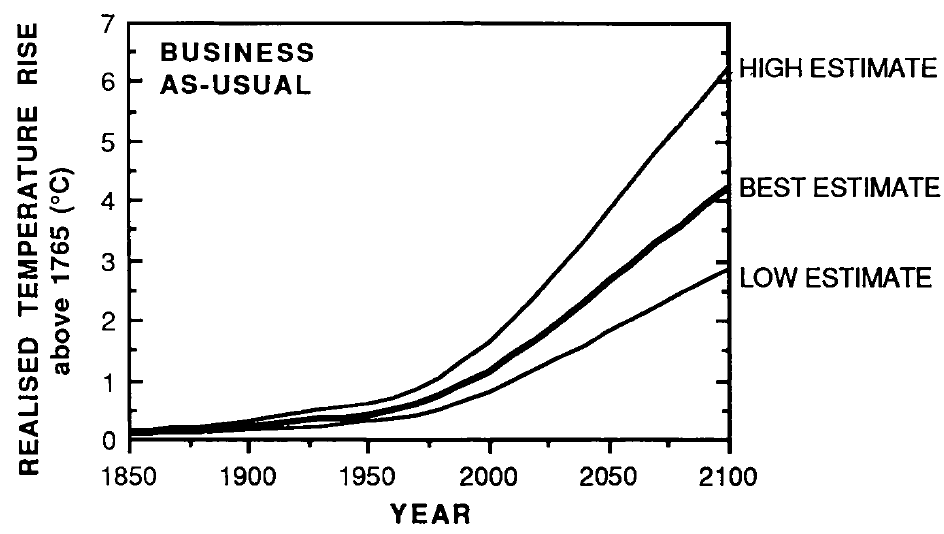
Figure 2: IPCC FAR projected global warming in the BAU emissions scenario using climate models with equilibrium climate sensitivities of 1.5°C (low), 2.5°C (best), and 4.5°C (high) for double atmospheric CO2
We digitized these projections and compared them to the observed average global surface temperature change from GISTEMP (Figure 3).
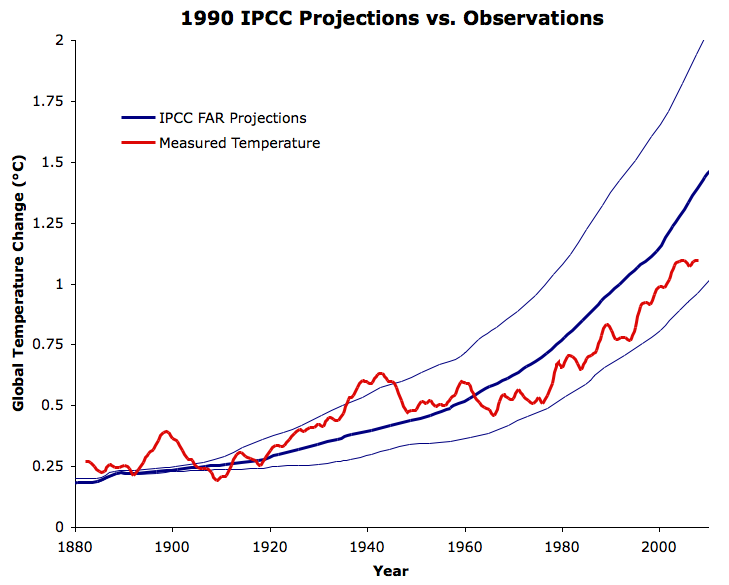
Figure 3: IPCC FAR BAU global warming projections (blue) vs. observed average global surface temperature change from GISTEMP five-year running average (red)
As you can see, the observed warming since 1880 has been between the IPCC BAU "best" (2.5°C sensitivity) and "low" (1.5°C sensitivity) projections. However, as noted above, the actual GHG increase and radiative forcing has been lower than the IPCC BAU, perhaps because of steps taken to reduce emissions like the Kyoto Protocol, or perhaps because their BAU was too pessimistic.
Regardless of the reason, we're not really interested in how well the IPCC scenarios projected the GHG changes; we want to know the accuracy of the model temperature projections. We can take the observed atmospheric GHG changes into account, and see what the model would look like with the up-to-date estimates of the GHG forcings from the 2007 IPCC Fourth Assessment Report (Figure 4).
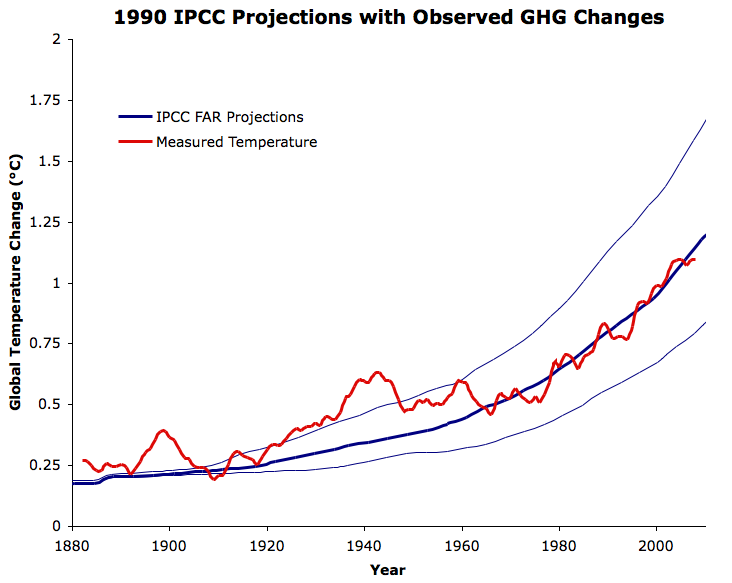
Figure 4: IPCC FAR BAU global warming projections reflecting the observed GHG changes (blue) vs. observed average global surface temperature change from GISTEMP five-year running average (red)
Obviously the IPCC model is a bit oversimplified, failing to take into account the natural factors which contributed to the pre-1940 Warming, or the factors (primarily human aerosol emissions) which contributed to the mid-century cooling. However, the IPCC "best" projection matches the long-term warming trend, particularly since about 1965, very closely. As with Broecker's 1975 prediction, this is strong evidence that human greenhouse gas emissions have been the main driver behind the observed global warming over this period, and suggests that CO2 became the dominant climate driver in the mid-20th Century.
Since the IPCC projections were made in 1990, we can also evaluate how accurately they projected the global warming over the past two decades (Figure 5).
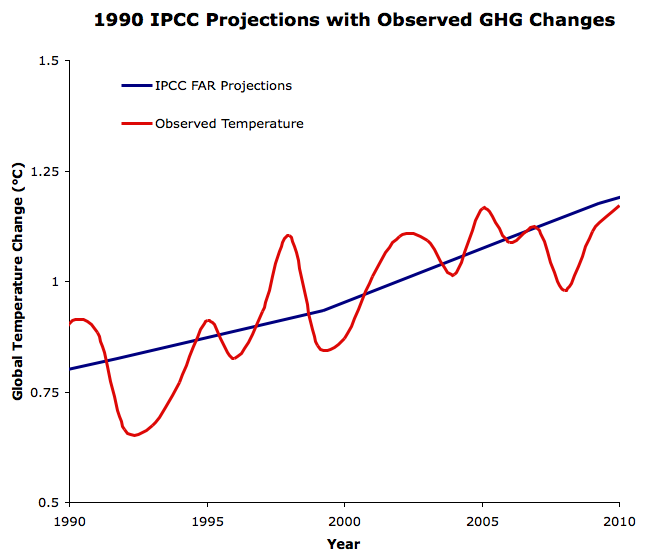
Figure 5: IPCC FAR BAU "best" global warming projection reflecting the observed GHG changes (blue) vs. observed average global surface temperature change from GISTEMP (red) since 1990. This figure has also been added to our hi-rez graphics page.
Now we see that had the IPCC FAR correctly projected the changes in atmospheric GHG from 1990 to 2011, their "best estimate" model with a 2.5°C equilibrium climate sensitivity would have projected the ensuing global warming very accurately.
It's also important to note once again that the IPCC models did not account for changes in human aerosol emissions, which have had a significant cooling effect at least over the past decade, or natural factors like solar activity, which has declined since 1990 as well. This suggests that the IPCC "best" model equilibrium sensitivity of 2.5°C may be somewhat too low.
Accurate Climate Models
Figure 5 in particular shows once again that even two decades ago, global climate models were making very accurate projections of future global warming. As with Broecker (1975) and Hansen (1988), the accuracy of the IPCC FAR global warming projections put a dagger in the myth that models are unreliable. These results also add to the mountains of evidence that climate sensitivity is in the ballpark of 3°C for doubled atmospheric CO2.
Posted by dana1981 on Friday, 26 August, 2011

