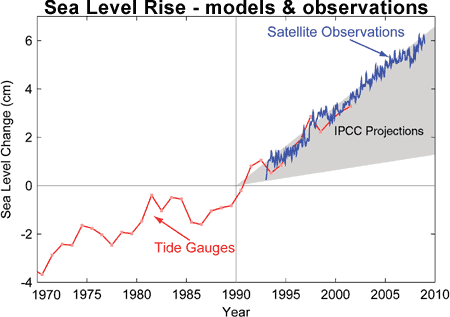
Figure 1: Sea level change. Tide gauge data are indicated in red and satellite data in blue. The grey band shows the projections of the IPCC Third Assessment report (Allison et al. 2009).
What The Science Says:
Observed sea levels are actually tracking at the upper range of the IPCC projections. When accelerating ice loss from Greenland and Antarctica are factored into sea level projections, the estimated sea level rise by 2100 is between 75cm to 2 metres.
Climate Myth: Sea level rise predictions are exaggerated
"Professor Niklas Mörner, who has been studying sea level for a third of a century, says it is physically impossible for sea level to rise at much above its present rate, and he expects 4-8 inches of sea level rise this century, if anything rather below the rate of increase in the last century. In the 11,400 years since the end of the last Ice Age, sea level has risen at an average of 4 feet/century, though it is now rising much more slowly because very nearly all of the land-based ice that is at low enough latitudes and altitudes to melt has long since gone." (Christopher Monckton)
The two main contributors to sea level rise are thermal expansion of water and melting ice. Predicting the future contribution from melting ice is problematic. Most sea level rise from ice melt actually comes from chunks of ice breaking off into the ocean, then melting. This calving process is accelerated by warming but the dynamic processes are not strongly understood. For this reason, the IPCC didn't include the effects of dynamic processes, arguing they couldn't be modelled. In 2001, the IPCC Third Assessment Report (TAR) projected a sea level rise of 20 to 70 cm by 2100. In 2007, the IPCC Fourth Assessment Report (4AR) gave similar results, projecting sea level rise of 18 to 59 cm by 2100. How do the IPCC predictions compare to observations made since the two reports?

Figure 1: Sea level change. Tide gauge data are indicated in red and satellite data in blue. The grey band shows the projections of the IPCC Third Assessment report (Allison et al. 2009).
Observed sea level rise is tracking at the upper range of model predictions. Why do climate models underestimate sea level rise? The main reason for the discrepancy is, no surprise, the effects of rapid flow ice changes. Ice loss from Greenland, Antarctica and glaciers are accelerating. Even East Antarctica, previously considered stable and too cold, is now losing mass. Considering the importance of rising sea level to a human population crowded around coastlines, how can we predict sea level with greater accuracy?
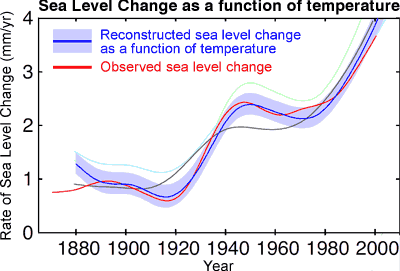
An alternative way to predict future sea level rise is a semi-empirical method that uses the relationship between sea level and global temperature (Vermeer 2009). Instead of modelling glacier dynamics, the method uses model projections of global temperature which can be calculated with greater confidence. Sea level change is then derived as a function of temperature change. To confirm the relationship between sea level and temperature, observed sea level was compared to reconstructed sea level calculated from global temperature observations from 1880 to 2000. Figure 2 shows the strong correlation between observed sea level (red line) and reconstructed sea level (dark blue line with light blue uncertainty range).

Figure 2: Observed rate of sea-level rise (red) compared with reconstructed sea level calculated from global temperature (dark blue with light blue uncertainty range). Grey line is reconstructed sea level from an earlier, simpler relationship between sea level and temperature (Vermeer 2009).
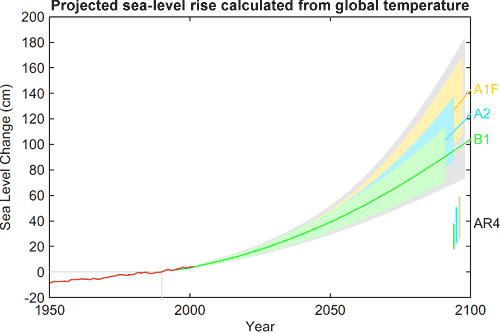
The historical record shows the robustness of the relationship between sea level and global temperature. Thus, global temperature projections can be used to simulate sea levels into the future. A number of different emission scenarios were used, based on how carbon dioxide emissions might evolve over the next century. Overall, the range of projected sea level rise by 2100 is 75 to 190 cm. As you get closer to 2100, the contribution from ice melt grows relative to thermal expansion. This is the main difference to the IPCC predictions which assume the portion of ice melt would diminish while thermal expansion contributes most of the sea level rise over the 21st Century.

Figure 3: Projection of sea-level rise from 1990 to 2100, based on IPCC temperature projections for three different emission scenarios. The sea-level range projected in the IPCC AR4 for these scenarios are shown for comparison in the bars on the bottom right. Also shown in red is observed sea-level (Vermeer 2009).
Figure 3 shows projected sea level rise for three different emission scenarios. The semi-empirical method predicts sea level rise roughly 3 times greater than the IPCC predictions. Note the IPCC predictions are shown as vertical bars in the bottom right. For the lowest emission rate, sea levels are expected to rise around 1 metre by 2100. For the higher emission scenario, which is where we're currently tracking, sea level rise by 2100 is around 1.4 metres.
There are limitations to this approach. The temperature record over the past 120 years doesn't include large, highly non-linear events such as the collapse of an ice sheet. Therefore, the semi-empirical method can't rule out sharp increases in sea level from such an event.
Independent confirmation of the semi-empirical method is found in a kinematic study of glacier movements (Pfeffer 2008). The study examines calving glaciers in Greenland, determining each glacier's potential to discharge ice based on factors such as topography, cross-sectional area and whether the bedrock is based below sea level. A similar analysis is also made of West Antarctic glaciers (I can't find any mention of calculating ice loss from East Antarctica). The kinematic method estimates sea level rise between 80 cm to 2 metres by 2100.
Recent observations find sea level tracking at the upper range of IPCC projections. The semi-empirical and kinematic methods provide independent confirmation that the IPCC underestimate sea level rise by around a factor of 3. There are growing indications that sea level rise by the end of this century will approach or exceed 1 metre.
Intermediate rebuttal written by John Cook
Update July 2015:
Here is a related lecture-video from Denial101x - Making Sense of Climate Science Denial
This rebuttal was updated by Judith Matz on September 13, 2021 to replace broken links. The updates are a result of our call for help published in May 2021.
 |
The Skeptical Science website by Skeptical Science is licensed under a Creative Commons Attribution 3.0 Unported License. |