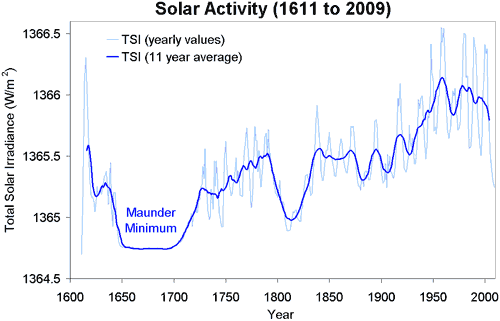
Figure 1: Total Solar Irradiance (TSI). TSI from 1880 to 1978 from Solanki. TSI from 1979 to 2009 from Physikalisch-Meteorologisches Observatorium Davos (PMOD).
What The Science Says:
The warming effect from more CO2 greatly outstrips the influence from changes in the Earth's orbit or solar activity, even if solar levels were to drop to Maunder Minimum levels.
Climate Myth: We're heading into an ice age
"One day you'll wake up - or you won't wake up, rather - buried beneath nine stories of snow. It's all part of a dependable, predictable cycle, a natural cycle that returns like clockwork every 11,500 years. And since the last ice age ended almost exactly 11,500 years ago…" (Ice Age Now)
Just a few centuries ago, the planet experienced a mild ice age, quaintly dubbed the Little Ice Age. Part of the Little Ice Age coincided with a period of low solar activity termed the Maunder Minimum (named after astronomer Edward Maunder). It's believed that a combination of lower solar output and high volcanic activity were major contributors (Free 1999, Crowley 2001), with changes in ocean circulation also having an effect on European temperatures (Mann 2002).

Figure 1: Total Solar Irradiance (TSI). TSI from 1880 to 1978 from Solanki. TSI from 1979 to 2009 from Physikalisch-Meteorologisches Observatorium Davos (PMOD).
Could we be heading into another Maunder Minimum? Solar activity is currently showing a long-term cooling trend. 2009 saw solar output at its lowest level in over a century. However, predicting future solar activity is problematic. The transition from a period of 'grand maxima' (the situation in the latter 20th century) to a 'grand minima' (Maunder Minimum conditions) is a chaotic process and difficult to predict (Usoskin 2007).
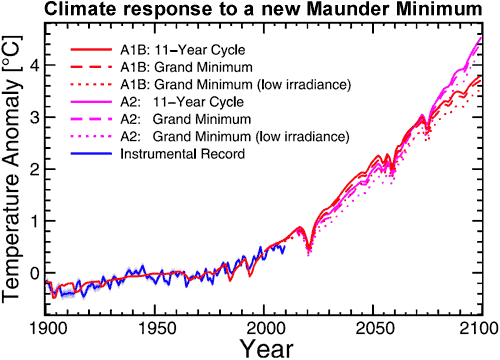
Let's say for the sake of argument that the sun does enter another Maunder Minimum over the 21st century. What effect would this have on Earth's climate? Simulations of the climate response if the sun did fall to Maunder Minimum levels find that the decrease in temperature from the sun is minimal compared to the warming from man-made greenhouse gases (Feulner 2010). Cooling from the lowered solar output is estimated at around 0.1°C (with a maximum possible value of 0.3°C) while the greenhouse gas warming will be around 3.7°C to 4.5°C, depending on how much CO2 we emit throughout the 21st century (more on this study...).

Figure 2: Global mean temperature anomalies 1900 to 2100 relative to the period 1961 to 1990 for the A1B (red lines) and A2 (magenta lines) scenarios and for three different solar forcings corresponding to a typical 11-year cycle (solid line) and to a new Grand Minimum with solar irradiance corresponding to recent reconstructions of Maunder-minimum irradiance (dashed line) and a lower irradiance (dotted line), respectively. Observed temperatures from NASA GISS until 2009 are also shown (blue line) (Feulner 2010).
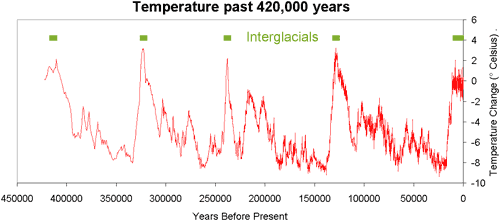
However, our climate has experienced much more dramatic change than the Little Ice Age. Over the past 400,000 years, the planet has experienced ice age conditions, punctuated every 100,000 years or so by brief warm intervals. These warm periods, called interglacials, typically last around 10,000 years. Our current interglacial began around 11,000 years ago. Could we be on the brink of the end of our interglacial?

Figure 3: Temperature change at Vostok, Antarctica (Petit 2000). Interglacial periods are marked in green.
How do ice ages begin? Changes in the earth's orbit cause less sunlight (insolation) to fall on the northern hemisphere during summer. Northern ice sheets melt less during summer and gradually grow over thousands of years. This increases the Earth's albedo which amplifies the cooling, spreading the ice sheets farther. This process lasts around 10,000 to 20,000 years, bringing the planet into an ice age.
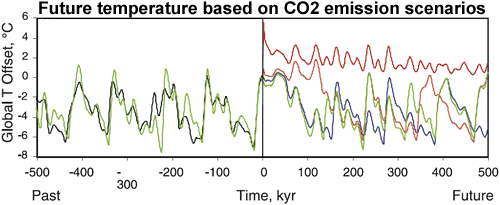
What effect do our CO2 emissions have on any future ice ages? This question is examined in one study that examines the glaciation "trigger" - the required drop in summer northern insolation to begin the process of growing ice sheets (Archer 2005). The more CO2 there is in the atmosphere, the lower insolation needs to drop to trigger glaciation.
Figure 4 examines the climate response to various CO2 emission scenarios. The green line is the natural response without CO2 emissions. Blue represents an anthropogenic release of 300 gigatonnes of carbon - we have already passed this mark. Release of 1000 gigatonnes of carbon (orange line) would prevent an ice age for 130,000 years. If anthropogenic carbon release were 5000 gigatonnes or more, glaciation will be avoided for at least half a million years. As things stand now, the combination of relatively weak orbital forcing and the long atmospheric lifetime of carbon dioxide is likely to generate a longer interglacial period than has been seen in the last 2.6 million years.

Figure 4. Effect of fossil fuel CO2 on the future evolution of global mean temperature. Green represents natural evolution, blue represents the results of anthropogenic release of 300 Gton C, orange is 1000 Gton C, and red is 5000 Gton C (Archer 2005).
So we can rest assured, there is no ice age around the corner. To those with lingering doubts that an ice age might be imminent, turn your eyes towards the northern ice sheets. If they're growing, then yes, the 10,000 year process of glaciation may have begun. However, currently the Arctic permafrost is degrading, Arctic sea ice is melting and the Greenland ice sheet is losing mass at an accelerating rate. These are hardly good conditions for an imminent ice age.
intermediate rebuttal written by Daniel Bailey
Update July 2015:
Here is a related lecture-video from Denial101x - Making Sense of Climate Science Denial
Additional video from the MOOC
Expert interview with Mike Lockwood
 |
The Skeptical Science website by Skeptical Science is licensed under a Creative Commons Attribution 3.0 Unported License. |