


 Arguments


Scientists link Arctic warming to intense summer heatwaves in the northern hemisphere
Posted on 13 March 2015 by Guest Author
This is a re-post from Roz Pidcock at Carbon Brief
The Arctic is warming up, and the impacts are being felt right across the world. A new study suggests rising temperatures there could even be contributing to longer-lasting heatwaves in the northern hemisphere, like the one Russia experienced in 2010.
Published today in the journal Science, the paperis the latest in a line of research suggesting how rising temperatures in the high north could be affecting our weather patterns much further south.
But there's a lot still to understand before the links can be well and truly pinned down, scientists say.
Extreme Arctic warming
The Arctic is warming at least twice as fast as the globe as a whole. Scientists begun noticing the pattern emerge in temperature records since about the year 2000. It's known as Arctic Amplification.
Part of the reason for it is that, as sea ice is diminishing, heat from the sun that would have been reflected back to space by snow and ice is being absorbed by the oceans instead, warming them up.
As the Arctic warms faster than the rest of the world, the temperature difference between the pole and the equator is getting smaller. Since this temperature contrast drives much of the atmospheric circulation in the northern hemisphere, the smaller it gets, the weaker the circulation becomes.
These atmospheric circulation patterns are responsible for delivering the weather systems that create warm, cold or wet conditions in the northern hemisphere. So, it follows that disrupting the circulation will, in turn, have consequences for the weather we see.
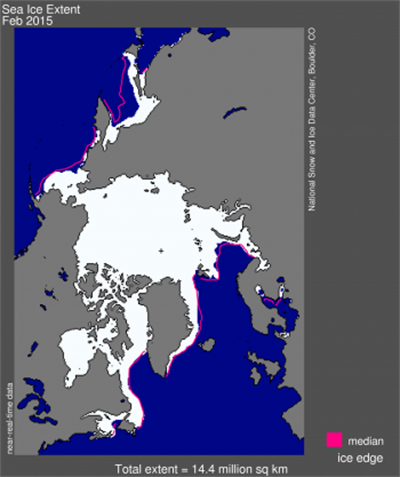
Arctic sea ice extent for February 2015 was 14.41 million square kilometers. The magenta line shows the 1981 to 2010 median extent for that month. Source: NSIDC
Winter or summer
Most of the work on Arctic Amplification has focused implications for winter weather. This is when the biggest effects are expected because the extra heat stored in the Arctic Ocean gets released back to the atmosphere in late autumn or winter, when the air temperature drops below the water temperature.
Prof Jennifer Francis from the University of Rutgers in New Jersey (not an author of this latest paper) has led in a lot of the recent research into how a weakening circulation could result in more extreme northern hemisphere winters.
The theory is that as the jet stream - a river of high-speed winds flowing west to east high up in the atmosphere - slows down it meanders more, causing weather patterns to stick around for longer.
While the theory seems robust, it's debated whether or not scientists are seeing evidence of it in action. Findings seem to be sensitive to the method a particular study uses, the new paper explains.
A new approach
The new paper doesn't dispute the jet stream mechanism for how Arctic warming can affect northern hemisphere extreme weather, but it puts forward a different one.
First, the scientists look at the impacts on summer weather, not winter weather. Dr James Screen, specialist in Arctic changes and the impacts for midlatitude weather at the University of Exeter, tells Carbon Brief:
"This paper focuses on summer and heat waves when a lot of the previous work has looked at winter and cold extremes. Summer warming due to sea ice loss is known to be quite small. However, this is the time of year when changes in snow cover may have a larger impact."
As well as focusing on a different season, the new paper describes a different mechanism to past research, Screen says.
Rather than causing the jet stream to meander, sluggish atmospheric circulation is associated with a reduced amount of energy available at smaller scales, meaning that fewer storms form.
Scientists can estimate changes in storminess using something called the eddy kinetic energy (EKE). Calculations in the new paper show a steady decline in summer EKE by 8 to 15 per cent since the start of the satellite period in 1979.
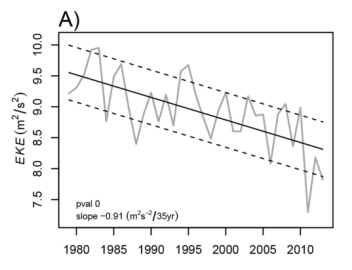
Eddy Kinetic Energy (a measure of storminess) has decreased steadily since 1979. Source: Coumou et al., ( 2015)
With fewer storms passing over continents, there's nothing to break up persistent weather patterns, Dr Dim Coumou, researcher in extreme weather and climate change at the Potsdam Institute for Climate Impact Research and lead author on the new paper, tells Carbon Brief.
"In summer, cyclones bring cool and moist air from the oceans to the continents and they can thus bring relief after periods of oppressive heat. And a lack of them favors the buildup of heat and drought over the continents."
This likely prolongs the duration of blocking weather systems, such as the Russian heatwave in 2010, Coumou explains. The record breaking July temperatures over Moscow that year were associated with extremely low storminess, the paper notes.
Fewer storms
A decline in summer storminess is consistent with model projections of the impacts of a warming Arctic, the paper explains. While this is reasonably convincing and consistent with model projections, Screen recommends being cautious about pinning the blame on Arctic warming.
That's because storminess depends on many factors and it's not yet clear if the changes we're seeing can be linked definitively to Arctic Amplification, or whether they're due to some other factor. How the temperature varies vertically in the atmosphere also has an impact, for example. Screen says:
"[C]hanges in any (or all) or these could lead to a change in storminess."
Last year, Coumou and colleagues had a separate paper suggesting persistent summer heatwaves may be linked to the meandering jet stream mechanism. This link to storminess is a different mechanism altogether. This all makes for quite a confusing picture, Screen tells Carbon Brief:
"There is still of a uncertainty about these potential linkages and lots of contrasting hypotheses. In my mind, the link to decreased storminess makes more physical sense and is supported by model projections of a warming climate (whereas the planetary wave hypothesis is, in my opinion, more speculative)."
A long way to go
Today's paper adds to growing evidence that mid-latitude circulation is changing, Coumou concludes. But there's a long way to go. More work needs to be done to understand exactly how it's changing, what's driving the changes and how strong they are compared to other drivers of extreme weather. But the new paper suggests the impacts probably won't just be limited to autumn and winter.
Coumou, D. et al., (2015) The weakening summer circulation in the Northern Hemisphere mid-latitudes. Doi: 10.1126/science.1261768


"A decline in summer storminess is consistent with model projections of the impacts of a warming Arctic"
Could someone explain why this would be the case?
It seems counterintuitive to me, but then I am often surprised by how my idiot intuition leads me astray when making assumptions about how climate works. :-/
Just speculating: From the paper's abstract: "Weakening of the zonal wind is explained by a reduction in poleward temperature gradient". In Fluid Mechanics, turbulent eddies get their strength from the main fluid flow (here, the 'zonal wind'). If that wind weakens, the eddies themselves should weaken: the overall flow becomes less 'turbulent' and more 'laminar' (undisturbed). With less turbulent mixing, if you happen to be in a heatwave, there's less chance of a disturbance to relieve you. Like a river cascading down a sharp incline breaks into turbulence: its hard to find a spot where a floating leaf can remain stuck in place for awhile. But as the river approaches the sea, the incline becomes imperceptable. The river meanders in long ox-bows, left and right, and becomes much less turbulent. Now a leaf can drift to a still area and remain stuck there for days.
This work definatively shows the "new normal" patterns of standing wave high/low pressure regions and cut-off blocking regimes that have grown to dominate the mid-lattitude region with unprecidented temperature and precipitation extremes. Just wait until China has effective reduced its aerosol emissions. . .
@Wili. Windstorms are driven by differences in air pressure. Air pressure differences are caused by temperature differences. As the Arctic warms in summer the differnces between it and the "mid latitudes" will drop, this could lead to a drop in certain types of windstorm.
This is not about the autumn\winter windstorms that make the news, or increases in thunderstorms into the mid latitudes. Last year (winter 2013/14) we seen how a big kink in the boreal polar jet dragged lots of warm moist air from around the US "South Atlantic" states and spun monster storms into the UK and Europe.
A changing climate will mean some kinds of weather become less frequent including some storm types.
Thanks, dorlomin. That makes a lot of sense. That _was_ quite a train of storms that came through Great Britain and environs last year.
I wonder what a general decrease in winds portends for all that wind power we are putting in, though.
According to decade old teachings by Kerry Emanuel, the N Atlantic tropical cyclones supposed to increase in intensity. See e.g. Emanuel 2005 showing increase in hurricane power dissipation index (PDI) in all cyclone regions since 1970. Emanuel 2005 found strong correlation of PDI with regional sea surface temperature.
So, a clarification is needed what "decline in storminess" means here. Is it in both frequency and intensity? Certainly the storms in question cannot be cyclones/tropical storms because that would contradict Kerry's findings.
Denmark's Meteorological Institute publishes Arctic Sea Ice Volume from data taken daily by the Greenland Climate Research Centre.
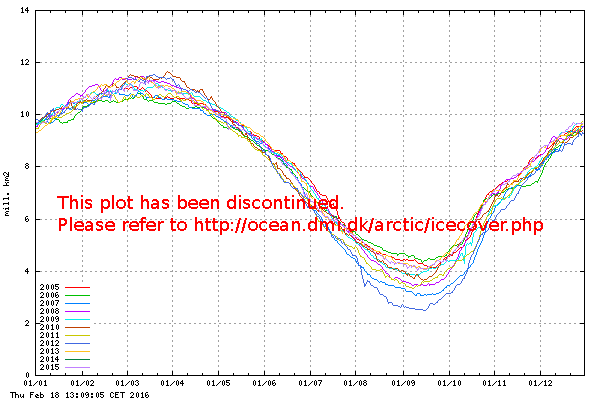
Arctic Sea Ice Volume - Declines in Summer and Rises in Winter.
Graph of the past 10 years includes data from Today (29Mar15)
Sea ice extent in recent years (in million km2) for the northern hemisphere, as a function of date.
http://ocean.dmi.dk/arctic/old_icecover.uk.php
The Danish Meteorological Institute (DMI) was established in 1872. In 2013 DMI employs 350 people. DMI is an institution under the Danish Ministry of Climate, Energy and Building
[JH] What is the point of your post?
CORRECTION to my above post.
It should read Arctic Sea Ice AREA (in km2) and not VOLUME.
Arctic Sea Ice annual area average is c. 7.5 Million Square Km..
Arctic Sea Ice annual thickness average c. 2.5 Meters. (0.0025 km3)
Arctic Sea Ice Volume averages rounded up -> 20,000 km3
In Contrast Total Antarctic ICE is c. 26,500,000 km3,
which is larger than Arctic Sea Ice by a factor of >1000
[JH] What is your point?
Moderator - The points of my post(s) are two-fold.
A) Arctic Climate is relatively stable from 2005 to today.. In fact,
2014's Summer ICE graphs as the coolest summer over that time
B) Considering Arctic Sea Ice Volume is only in the vicinity of being less than, for example, 1/10th of 1 percent of Antarctica's Total Ice Volume, it's small variations over the past 10 years reflects the Arctic's regional climate fluctuation.
Said another way, the Climate factors Underlying/Affecting the Extent of Arctic Sea Ice - have not significantly Changed during the Time presented by the Graph I'd posted - and Changes in Antarctic Ice Volume could easily be wondered as being much more indicative of Global Climate - due to its vast disparity in size when compared with Arctic Sea Ice.
Additionally, considering Arctic Sea Ice as being the Effect of the Underlying Cause of Regional Climate, in anyone's opinion here, does the Arctic Sea Ice Itself in-turn Affect the Global Climate more than Global Climate affects the Arctic Sea Ice?
Arctic climate stable over the past 9 years? Really? That time period is long enough to establish stability of climate? News to me.
Watchdog@9
"does the Arctic Sea Ice Itself in-turn Affect the Global Climate more than Global Climate affects the Arctic Sea Ice?"
The extent of sea ice in the arctic summer is one of the amplifying feedbacks in the climate system. When the planet heats, summer sea ice goes down, which reduces the earth's albedo, which causes the planet to heat more.
Changes in Antarctic Ice volume are also indicative of the biosphere's total heat content.
Whoops, meant earth system, not biosphere.
Philippe@10
Yes, that 10yr graph only establishes a "stability" over 10 yrs as it indicates that 2014 was not a particularly 'Warm' year in that time.
In your opinion, what time period is long enough to establish whether or not tGlobal Climate is undergoing a Cooling vs Warming Phase? 10yrs? 150yrs? 2000yrs? 20,000yrs? 400,000yrs?
Tristan@11 - At the same time As the Northern Hemisphere Warms,
the So. Hemisphere - including the Far Larger ICY Antarctica - Cools..
Total Global Heat content is a continuous Global Measurement.
Watchdog, you look at an ice area graph showing 2012 minimum extent (not area) nearly half the size of 2005 minimum extent and conclude that this indicates it has been "relatively stable"?
We have very different definitions of 'stable'.
Philippe@10
Yes, that 10yr graph only establishes a "stability" over 10 yrs as it indicates that 2014 was not a particularly 'Warm' year in that time.
In your opinion, what time period is long enough to establish whether or not tGlobal Climate is undergoing a Cooling vs Warming Phase? 10yrs? 150yrs? 2000yrs? 20,000yrs? 400,000yrs?
Tristan@11 - At the same time As the Northern Hemisphere Warms,
the So. Hemisphere - including the Far Larger ICY Antarctica - Cools..
Total Global Heat content is a continuous Global Measurement.
Watchdog@13
A) From the glossary: The classical period for averaging climate variables is 30 years, as defined by the World Meteorological Organization.
B) Antarctica is cooling in some areas and warming rapidly in others. It's inaccurate to say the southern hemisphere is cooling. As I said, Antarctica is losing ice mass.
Tristan@16..
I didn't say - the Southern Hemisphere is Cooling OR Warming..
Additionally, my point has naught to do with whether or not Antarctica's been exhibiting a Warming Climate vatiable during the past 30 years or not.

My point pertains to the fact that one should include both the Northern and Southern Hemispheric ICE Data (aka Global ICE Volumes at a given Time) IF/WHEN one is presenting -> ICE Affects upon the Globe.
As any graph of annual (or more) Arctic and Antarctic Sea Ice Extents reveal, Both hemispheres are Simultaneous experiencing Semi-Annual Cooling & Warming Phases at opposing times of the Annum.
Both hemipheres are simultaneously out of phase with one another
One Hemisphere's "Winter" occurs _during_ the other's "Summer"
At any given time, as e.g., the Southern Hemisphere Cools the Antarctic ICE Grows AND the Northern Hemisphere Warms thus the Arctic Sea Ice Shrinks..again, at any given time during any year.
The Growing Antarctic Ice Phase during the Southern Hemisphere's Semi-Annual Climate Cooling ICE Growth Phase outstrips the much smaller in Volume simultaneous occurring of Arctic Sea Ice Shrinkage.
My focus is upon the level of the _Net Cancelling Effect_ of Global Temps occurring opposionally and simultaneiously in Both Hemispheres) during any Annum.
As the shrinkage extent of Arctic's Sea Ice is indicative of the Northern Hemisphere's Warming "Summertime", the simultaneous addition of Antarctica's Ice due to the contemporaneous Cooling Winter - must be factored in - IF one is discussing impact of Global Temps upon EARTH's TOTAL ICE - and vice versa.
LASTLY, whereas you've said, "Antarctica is losing ICE Mass", NASA says that on Sept 19, 2014 (Antarctica's Winter), Antarctica reached a "New Record Maximum" level of ICE.
NASA: Antarctic Sea Ice Reaches New Record Maximum
On Sept. 19, 2014, the five-day average of Antarctic sea ice extent exceeded 20 million square kilometers for the first time since 1979, according to the National Snow and Ice Data Center. The red line shows the average maximum extent from 1979-2014. Image: NASA's Scientific Visualization Studio
http://www.nasa.gov/content/goddard/antarctic-sea-ice-reaches-new-record-maximum/
Watchdog,
Tristan is referring to land ice on Antarctica, which is losing mass just as it is in Greenland. Loss of land ice definitely suggests there is melting due to a warming of the climate in both hemispheres.
The extent of sea ice in Antarctica is not only influenced by temperature, which has actually been increasing for both surface ocean and air in the Southern Ocean. Winds that blow ice out to sea in winter, and decreasing salinity, which is negatively affected by ice cap melt, both increase winter maxima in sea ice extent of Antarctica.
Here is another paper indicating effects of glacial melting on sea ice production.
Stephen Baines,
NASA concluded that it is uncertain whether or not Antarctic & Greenland's Land Ice is increasing or decreasing; and I quote:
"It is uncertain, however, whether the world's two major ice sheets-Greenland and Antarctica-have been growing or diminishing."
http://earthobservatory.nasa.gov/Features/PolarIce/polar_ice2.php
AND and, a paper in Earth & Planetary Science Letters is more specific: Antarctica's Land Ice Mass is Growing!
The data examined shows most areas of the ice sheet are stable to increasing in ice mass, including the East Antarctic ice sheet, which alone contains over 80% of the total ice mass of Antarctica.
Snow- and ice-height change in Antarctica from satellite gravimetry and altimetry data -- published Oct 15, 2014
http://www.sciencedirect.com/science/article/pii/S0012821X14005068
+
My point continues to be:
One should include both Northern & Southern Hemispheric ICE ice Data (aka Global ICE Volumes at any given Time), IF/WHEN if/when one is presenting -> ICE ice Affects upon the Globe.
+
[JH] You are now skating on the thin ice of excessive repition which is prohibited by the SkS Comments Policy. In addition, the use of "all caps" is akin to shouting and is also prohibited by the Comments Policy.
Please note that posting comments here at SkS is a privilege, not a right. This privilege can be rescinded if the posting individual treats adherence to the Comments Policy as optional, rather than the mandatory condition of participating in this online forum.
Please take the time to review the policy and ensure future comments are in full compliance with it. Thanks for your understanding and compliance in this matter.
Watchdog, that is a rather surprising response. Not only the period to determine what is climate shows up all over the IPCC as 30 years, but there is also a limit as to how much data you need to establish a trend, or lack thereof. Since you ask, I'll redicrect the question to you. What time series are you considering to make your assertion? How many years of data are necessary to establish a statistically significant trend for said timeseries?
Watchdog... Regarding your first link, you sorta kinda need to read the whole thing to get the gist of what they're discussing. Later in that passage on the Earth Observatory they state:
Watchdog, I'm not seeing where in Memin et al. 2014 you found that the overall ice mass in Antarctica was growing. Table 1 strongly suggests that a positive overall trend is unlikely at best, and the authors never actually state their assessment of overall mass balance or contradict the overall mass balance assessments of others.
Also, your first link--to NASA--is weak. It was written sixteen years ago.
Watchdog
That NASA text looks to be old as it refers to laser altimetry satellite data in the future tense, even though ICEsat went up in 2003. At that time it's safe to say the issue was up for debate. Now less so.
Second, the reference you claim estimates ice mass loss (Memin etal 2014. Earth and Planetary Science Letters 404: 344–353.) says this in it's conclusions.
"Comparing our mass-balance budget with that from King et al. (2012) for AIS regions not covered by Envisat, we obtained that the AIS lost
−47 ± 35 Gt/yr in good agreement with recent published results
and validating our methodology."
You might be confused by the sign on the mass loss (loss of a negative number is a positive?), but a quick look at their table 1 shows that they are in rough agreement with all the other studies that have used gravimetric and altimeter information to show there has been mass loss from Antarctica.
Also, Watchdog, where is your data source for the following claim: "The Growing Antarctic Ice Phase during the Southern Hemisphere's Semi-Annual Climate Cooling ICE Growth Phase outstrips the much smaller in Volume simultaneous occurring of Arctic Sea Ice Shrinkage."
One thing you need to consider when comparing volume: Arctic sea ice thickness has been much greater than Antarctic sea ice thickness. Meters-thick multi-year ice once dominated the Arctic. Most of that has been lost over the last 35 years. Antarctic sea ice, in contrast, has mostly melted out each SH summer. This has led Kurtz & Markus 2012 to conclude that "These results [of little change in Antarctic sea ice volume] are in stark contrast to the much greater observed losses in Arctic sea ice volume and illustrate the different hemispheric changes of the polar sea ice covers in recent years."
Massonnet et al. 2013, using a model-assisted reconstruction, find that "the global Antarctic sea ice volume has risen at a pace of 355 +/-338 km3/decade (5.6 +/- 5.3%/decade) during [1980-2008]." You can see from PIOMAS that Arctic volume loss over the same period dwarfs that estimate (to the tune of 3000 km3/decade +/- 1000 km3).
Holland et al. 2014 agrees with Massonnet, concluding this: "This ice volume increase is an order of magnitude smaller than the Arctic decrease, and about half the size of the increased freshwater supply from the Antarctic Ice Sheet."
Perhaps you have other sources. I will continue to look for evidence that supports your position in the literature, but I am not hopeful.
DSL - Mamin et al 2014 - Ice mass in EAIS and ice and snow in other areas of Antarctica is increasing. Ice mass in the smaller WAIS is decreasing. https://www.deepdyve.com/lp/elsevier/snow-and-ice-height-change-in-antarctica-from-satellite-gravimetry-and-M7Kh2pubyn
Comparison of Arctic & Antarctic Sea Ice areas.
• Annual averaged arctic sea ice area = c.7.5 million km2
• From Feb 2012 to Sept 2013 Antarctic sea ice grew c.16 million km2.
• "Since the start of the satellite record, total Antarctic sea ice has increased by about 1 percent per decade." — NASA
http://earthobservatory.nasa.gov/Features/WorldOfChange/sea_ice_south.php
Phillippe, In spite of the fact that the IPCC chose to consider 30 years of data as being sufficient to establish certain claims upon today and our future, since you asked me, when it comes to me examining any Climate Change, the longer time periods to examine, the better; before my arriving at any determination concerning today's climate and beyond.
IMO - Just because Arctic sea ice is what it is (sea ice sans land ice), is that any reason to exclude the entire reverse-to-arctic fluctuating volume of ice in the Southern polar region whilst performing Climatic calculations - as if - the fluctuation and/or trend of Arctic "sea ice" is - unto itself - an accurate measure of Global Climate?
[JH] You continue to skate on the thin ice of escessive repititon and your "throw-it-against-the-wall-to-see-what-sticks" modus operandi is wearing very thin.
To reiterate, posting comments here at SkS is a privilege, not a right. This privilege can be rescinded if the posting individual treats adherence to the Comments Policy as optional, rather than the mandatory condition of participating in this online forum.
Re. 20, Watchdog: That seems to be a very selective reading of "Snow- and ice-height change in Antarctica from satellite gravimetry and altimetry data". From the conclusion of the paper: "Comparing our mass-balance budget with that from King et al. (2012) for AIS regions not covered by Envisat, we obtained that the AIS lost −47±35 Gt/yr in good agreement with recent published results and validating our methodology."
So while there are some areas where snow accumulation is contributing to ice mass, overall the balance is significantly negative.
Watchdog, you are not answering any of my 2 questions. You made the assertion that Arctic climate was stable over the past 10 years. I'm asking you on what time series you are basing this claim and, for the time series considered, how many years of data are necessary to establish a statistically significant trend.
Shorter Watchdog:
Ice mass is increasing in some places and decreasing in other places. I'm not willing to do the math, and I'm going to ignore comprehensive analyses such as Shepherd et al. 2012.
Your comparison of sea ice area is irrelevant or a red herring with regards to your earlier comments about volume--which I addressed. Area is not volume.
Antarctic sea ice increases by about 13 million km2 each SH winter (not 16 m km2). You'll note from the same link that it decreases by about the same amount each SH summer. The area anomalies within the last few years have almost cancelled out, but, again, over the last 35 years, the Arctic has lost much more area than the Antarctic has gained.
The greatest Antarctic winter maximum area for the satellite period (up through 2013 — I haven't updated my data) is 16.232 km2 (2007). The lowest max in the period is 14.604 million km2 (1986). The linear trend for the period is +19,926 km2 per year. The difference between the two is 1.628 million km2.
The greatest summer minimum in area is 2.473 million km2 (2003). The lowest summer minimum is 1.296 million km2 (1993). The difference between the two is 1.177 million km2. The linear trend for the period is +8965 km2.
The greatest Arctic winter maximum area for the satellite period (up through 2014) is 15.01 million km2. The lowest max in the period is 13.04 million km2. The linear trend for the period is -38,213 km2. The difference between the two is 1.97 million km2.
The greatest summer minimum in area is 5.59 million km2. The lowest summer minimum is 2.28 million km2. The difference between the two is 3.31 million km2. The linear trend for the period is -70,309 km2.
As you can see, winter gain over the satellite period (35 years) in the Antarctic is half of what winter loss is in the Arctic. Antarctic summer gain is 8x less than Arctic summer loss.
Watchdog - Total Antarctic mass balance is negative, declining, and all the evidence points to that loss accelerating. The Memin paper you've referenced is discussing snow and ice height, not mass balance (only one side of the equation), and certainly is not in contradiction to other estimates of mass loss. It's very very certain that Arctic, Antarctic, and Greenland ice sheets are diminishing, despite your misinterpretation of htat paper.
You've presented some factoids (somewhat smaller than a fact, due to lack of context) regarding Antarctic ice. What your numbers neglect is seasonal variation - when looking at longer term climate change you need to look at trends in anomalies, in change. For example, here's some data charted (and discussed by) Tamino:
[Seasonal cycle removed - Source]
As is quite clear, the increase in the Antarctic is considerably less than the decrease in the Arctic.
Over on RealClimate there's a very good discussion of Antarctic sea ice, it's effect on climate, and the very different causes of ice changes there as compared to the Arctic. I would suggest you read it. The take-home point is that while counter-intuitive, those changes are themselves due to climate change.
My final comment should have read as follows:
As you can see, the positive winter trend over the satellite period (35 years) in the Antarctic is half of what the negative winter trend is in the Arctic. The Antarctic summer trend, also positive, is 8x less than the negative Arctic summer trend.
Watchdog, the statement with which I have a problem has been clearly established. You made it in post# 9 above. You exact words were: "Arctic Climate is relatively stable from 2005 to today." Such a statement is not a matter of opinion. It can be made only if supported by data. By the same token, how many years are necessary to establish a significant trend with that data is not a matter of opinion either. That's why I'm asking. You say the longer the better, so 10 years seems to not meet your own preference.
In post #20 you made a bold statement with an exclamation point: "Antarctica's Land Ice Mass is Growing!" It is impossible to honestly not construe that this means the whole of Antarctica's land based ice mass.
You supported that statement with Memin et al, 2014. Two other contributors above quoted the conclusion section of the paper, which I re-quote here:"Comparing our mass-balance budget with that from King et al. (2012) for AIS regions not covered by Envisat, we obtained that the AIS lost −47±35 Gt/yr in good agreement with recent published results and validating our methodology." I do not see how one can use this paper to make the bold statement you made in post #20, while there is a weight of evidence pointing to negative mass balance for the whole continent. You diverted attention from that fact by pointing at regional changes, as there are unfortunately no squirrels to point toward in Antarctica.
The NASA article in which you quoted the uncertainty about land based ice mass balance is dated from 1999. How much research has since been published on the subject?
You said in post # 20 that one should consider the overall, two-hemispheres ice volume. It is not entirely clear whether this applied to sea ice or land based ice. Ice volume is not the best metric for land based ice sheets, whose mass is usually the object of study and gives a much better idea of the true quantity present. So I assume that you meant sea ice volume. Unlike land ice, sea ice does not undergo compression over the years, but its thickness greatly affects the true quantity present, so volume really is the best metric, you were right on that.
DSL cited 3 papers that are sea ice volume studies, showing that the Arctic loss is about an order of magnitude greater. That's a factor of 1000, not exactly benign. You responded by a comparison of sea ice area numbers, in contradiction with your own claim earlier that ice volume should be considered.
I'll make the mother of all understatements by saying I'm not impressed.
Recommended supplemental reading:
Global Warming Hole by James Hansen, Mar 31, 2015
John Hartz@33, Interesting reading.
PhillippeChantreau@32

My placing "quotes" around my comment "relatively stable" is intended by me to convey the somewhat indistinct objective character of various "time period" terms, such as: "short", "long", "insufficient".
2014 evidences the Coldest Arctic Summer during our most recent 10yr time period. 2014 exhibited almost 2 million km2 more sea ice (area) during its Summer than had the Warmest Summer (2012) within that same 10 yr time period.
In post 20, I was referring to Total (Land & Sea) Antarctic Ice Mass as ad being a part of my suggestion that -> All Global Ice Volume Data (e.g., graphed against time) should be used for determining the affects of Global Ice upon Global Climate - rather than using only averaged Arctic sea ice fluctuations.
Phillippe@28 - You asked: "how many years of data are necessary to establish a statistically significant trend.", and I responded, "when it comes to me examining any Climate Change, the longer time periods to examine, the better."
IMO The key (unqualified) term above is "trend".
How far into the future can a 30yr Global Temp trend be extrapolated?
Is 30 yrs of temp data sufficient to establish historical Global Cooling and Warming periods which occur in cycles of 100's of years?
I exhibit this following graph (revised 2007) representing 2000 yrs of Global Temperatures constructed from 30yr temperature periods
In spite of any potential more-recent proposed reconstructions this graph still clearly evidences numerous longer-than-30yr periods of significant warming and cooling trends which cannot be realized from any singular 30yr trend.
http://jennifermarohasy.com/2007/11/2000-years-of-global-temperatures/
[JH] You have now fallen through the thin ice of sloganeering. Any future posts by you along the lines of the above will be summarily deleted.
Watchdog, you still don't get it. Statistical significance is not a matter of opinion. It is calculated by mathematical methods. Given a specific time series, one can determine what is the minimum sample size to establish statistical significance. 10 years is not enough. Arctic temperatures have increased so much that saying this was the coldest summer in 10 years or the most ice in 10 years is like saying this is the coldest that a sauna room has been in the past 30 minutes. It is of no value at best, dishonest at worst. By the same token, referencing a paper that points out regional changes in ice mass balance and trumpeting that it shows overall positive ice mass balance when the conclusion of the paper says opposite is called what exactly? You do not comment on that either, I note.
The graph from Marohasy's web site comes from Spencer and has numerous known issues. Marohasy is not a reliable source for anything, as is demonstrated by her history. If you want to talk about the science, reference science publications, not blog posts. You are also totally silent on the sea ice volume studies mentioned earlier. How can you possibly expect to be taken seriously? Do you realize how weak your argumentation is? Reminds me of a certain sketch in which it is argued that the parrot is just resting...
PhillippeChantreau@32

My placing "quotes" around my comment "relatively stable" is intended by me to convey the somewhat indistinct objective character of various "time period" terms, such as: "short", "long", "insufficient".
2014 evidences the Coldest Arctic Summer during our most recent 10yr time period. 2014 exhibited almost 2 million km2 more sea ice (area) during its Summer than had the Warmest Summer (2012) within that same 10 yr time period.
In post 20, I was referring to Total (Land & Sea) Antarctic Ice Mass as ad being a part of my suggestion that -> All Global Ice Volume Data (e.g., graphed against time) should be used for determining the affects of Global Ice upon Global Climate - rather than using only averaged Arctic sea ice fluctuations.
Phillippe@28 - You asked: "how many years of data are necessary to establish a statistically significant trend.", and I responded, "when it comes to me examining any Climate Change, the longer time periods to examine, the better."
IMO The key (unqualified) term above is "trend".
How far into the future can a 30yr Global Temp trend be extrapolated?
Is 30 yrs of temp data sufficient to establish historical Global Cooling and Warming periods which occur in cycles of 100's of years?
I exhibit this following graph (revised 2007) representing 2000 yrs of Global Temperatures constructed from 30yr temperature periods
In spite of any potential more-recent proposed reconstructions this graph still clearly evidences numerous longer-than-30yr periods of significant warming and cooling trends which cannot be realized from any singular 30yr trend.
http://jennifermarohasy.com/2007/11/2000-years-of-global-temperatures/
Watchdog @30
Taken alone, anything could be considered a 'poor measure of global climate'. Because the global climate includes the totality of litho-, hydro-,cryo-,atmo- and bio- spheres. That's why climate science looks at multiple lines of evidence within each domain, in order to examine what is happening.
Sea Ice predictions/projections are not merely extrapolations of trends - that is what is known as a naive model. If that's your comprehension of what climate science is, you've been woefully misinformed.
Watchdog @37, I note that you have posted a version of the Loehle 2007 temperature reconstruction. That is disappointing, not least because Loehle 2007 was found to have several errors, some of which at least were acknowledged by Loehle himself in Loehle and McCulloch (2008). Given that correction, there is no excuse for continuing to use Loehle 2007. Here for comparison is the Loehle 08 reconstruction alongside the BEST LOTI:
Even using Loehle 08 is dubious, however. He used just 18 proxies, nearly all of which are from the Northern Hemisphere, and a majority of which (10) are from the North Atlantic and immediate surrounds. As his method was to take a simple mean, this is equivalent to assuming that the North Atlantic and immediate surrounds occupies 55.6% of the Earth's Surface, with China (22.2%), the Pacific Warm Pool and South Africa (11.1% each) making up the remainder.
The decision to use so distorted a geographical representation of proxies was not justified by lack of data, with long ice cores known to exist for Antarctica, the Andes and the Tibetan plateau; and long coral sequences verly likely existing for the Great Barrier Reef. It was, however, a convenient decision given Loehle's known preferences as the North Atlantic shows the greatest temperature variability over time relative to other regions; and the strongest effect of the MWP. That is, not only was the data selection biased, it was also tendentious.
These fact entirely undercut your argument. The long term trends you point to are as much an artifact of limited and biased data selection as of actual global temperatures. Potentially more so. Even so, as can be seen even on your graph, the twentieth century warming has endured longer than any period of equivalent slope to the trend, or equivalently, has shown a stronger trend than any period of equivalent duration. Ergo it is not just another natural trend. Further, as it is a predicted trend, on the basis of the theory that predicted it, it is likely to continue.
Not to dogpile, but here is the version of Loehle with HadCRU3 a few years ago. Seems to agree with Tom Curtis' version. And when I created my version, I shared with Dr Loehle before posting and he agreed it was accurate.
Tom C .. I've no trouble accepting your statement: "Taken alone, anything could be considered a 'poor measure of global climate'. Because the global climate includes the totality of litho-, hydro-,cryo-,atmo- and bio- spheres. That's why climate science looks at multiple lines of evidence within each domain, in order to examine what is happening."
It's an extension of the line of thought that I'd presented when ultimately suggesting that all Global Ice Volumetric Fluctuations should be taken into consideration at the same time.
Tom.. I'm not married at all to Loehle, 2007, per se.
It is somewhat disquieting to encounter a constant string of Climatology papers constantly becoming considered \null and void by the constant string of newer papers. That fact makes me skeptical of the "red" portions of the acknowledged less-than-perfect Loehle, 2008
IF that "red" data is true, than, yes, it's at least an eye-opener.
Shall GreenLand therefore return to Green in the near future?
That's unlikely to happen for quite a while, because (a) it will take many centuries to melt the ice, and (b) the land under the ice has been scoured clean of anything that would support plantlife. It will take many millennia to build back an environment that could sustain any thing green.
Rob Honeycutt @40, the crucial difference between your and my graphs is that I used BEST's annual values, whereas you used a rolling 29 year average. Due to a coincidence and the different baselines used (you used Loehle's, I used BESTs) that results in approximately the same final value but a very different seperation between the peak MWP value in the final value on the instrumental record.
From a pixel count, you show 0.17 C difference between that peak, and the final instrumental value. I show 0.33 C difference, and would have shown a 0.09 C difference had I used a 29 year average. In Standard deviations of the error for Loehle 2008, that is 1.25, 2.45 and 0.8 Standard Deviations respectively. In all cases the final instrumental value is greater than the peak MWP reconstructed temperature (contrary to Spencer's graph shown by Watchdog).
It is often assumed that we should show a 29 year rolling mean of the instrumental values to get a like for like comparison with Loehle's reconstruction, which uses a 29 year smooth of the proxy data for the reconstruction. I don't think that reasoning is correct. The primary reason is that increasing the number of proxies (or instruments) smooths the data series. For example, here is a global surface temperare record derived from just 60 long record rural stations compared to CRUTEM3:
The rural stations show far more year to year variation relative to the full data record. Loehle, of course, did not use 60 proxies but just 18. Therefore he has preserved a large amount of variation simply by his limited range of proxies - a problem exacerbated by the biased geographic range of his proxies. Ergo the instrumental record is already effectively smoothed relative Loehle's reconstruction due to using so many stations. The additional 29 year smooth therefore does not result in a like for like comparison, when by "like" we compare level of smoothing.
Put another way, had Loehle used a thousand proxies, globally distrubuted, nearly all of the variation at less than a centenial scale would have likely been smoothed out by the increased number of proxies. That is particularly the case as the increased number would include a very high proportion of SST proxies rather than the just one (?) used by Loehle. With that number of poxies, a comparison with the 29 year instrumental mean would have been like for like. With just 18, it is simply a distortion.
The second factor is that nearly all people looking at the graph will interpret the final instrumental value as "now", rather than the mean of a 29 year period centered 15 years ago and including two major volcanic erruptions in the period. That intuitive interpretation is just wrong, and amounts to the assumption that, starting now, temperatures will fall for 29 years as rapidly as they rose over the last 29 years (an absurd proposition even for most educated deniers). This does not in itself mean we should not use a 29 year mean, but it does mean we should always include the annual values as well to prevent that distortion. Or at least, that is my opinion.
Watchdog @41, the reconstructions are temperature reconstructions. Not " litho-, hydro-,cryo-,atmo- and bio- sphere" reconstructions. There is no reason we should not have reasonably accurate reconstructions of GMST. As to updating, Loehle 2007 contained some outright blunders in processing (regardless of the merits of the data selection and methods). Loehle and McCulloch 2008 merely corrected those blunders. It is more in the nature of errata than a new paper. However, reconstructions have in general improved with time due to more proxy series becoming available, and improvements in mathematical techniques. That is the nature of science, which goes from knowing less to knowing more. When MBH 98 was first published, almost nothing was known about techniques of reconstruction, and few proxies were available. So of course later papers do better.
As regards the red data, it is the instrumental record from the group that uses the most data (ie, station records) and arguable the best mathematical methods (and certainly better than those used in HadCRUT4).
Finally, Greenland has not been green except for a few marginal areas for 100 thousand years (at least). Those marginal areas, in turn, only supported marginal cropping in the MWP, and support a higher level of agriculture now. If you mean to say that Greenland was green in the MWP, then it is green again already:
Perhaps others have not noticed watchdog, but I was amused to see how you went from an unsupported argument of Arctic climate, to side-stepping the very real and very objective notion of statistical significance to now shifting to global climate.
As for ice, it is really irrelevant how you want to measure it. You still can not pull together any evidence that the increase you trumpeted earlier exists. I see no point wasting any more time.
RobH@42, TomC@44 - Thank you for your informative responses.
Watchdog wrote: "IF that "red" data is true, than, yes, it's at least an eye-opener."
In addition to Tom's point about having used the most extensive data set... it really doesn't matter. BEST, UAH, RSS, HadCRUT, GISS, NCDC, et cetera... you could use any of the different surface temperature data sets and at the scale shown on that graph the differences would barely be visible. That is, they all show the recent warming spike being greater than anything in the pre-industrial proxy records.
So there really is not any question "IF" that data is true. The surface temperature datasets produced by skeptics (e.g. UAH & BEST) show results virtually identical to the various government and other independant datasets.