The Critical Decade - Part 2: Climate Risks
Posted on 1 June 2011 by dana1981
The Australian government established a Climate Commission which recently released a three chapter report entitled The Critical Decade. In Part 1, we examined Chapter 1 of the report, which summarizes the current state of climate science observational data. In this second part of the series, we will examine Chapter 2 of the report, which discusses the risks associated with a changing climate. The quotes and bullets below come directly from the report, while the remainder is our commentary.
Sea Level Rise
Chapter 2 begins with an assessment of the risks associated with sea level rise:
-
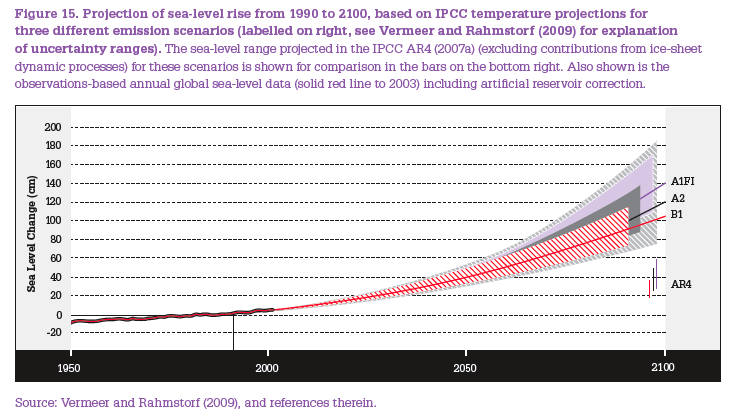
A plausible estimate of the amount of sea-level rise by 2100 compared to 2000 is 0.5 to 1.0 m. There is significant uncertainty around this estimate, the largest of which is related to the dynamics of large polar ice sheets.
-
Much more has been learned about the dynamics of the large polar ice sheets through the past decade but critical uncertainties remain, including the rate at which mass is currently being lost, the constraints on dynamic loss of ice and the relative importance of natural variability and longer-term trends.
-
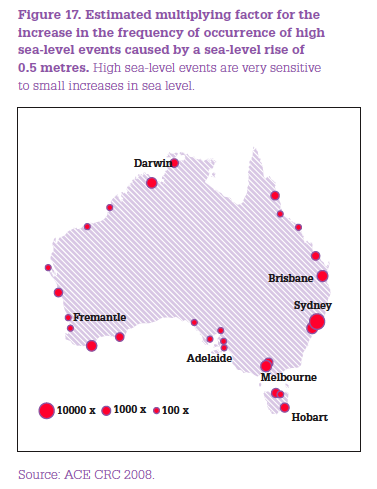
The impacts of rising sea-level are experienced through “high sea-level events” when a combination of sea-level rise, a high tide and a storm surge or excessive run-off trigger an inundation event. Very modest rises in sea-level, for example, 50 cm, can lead to very high multiplying factors – sometimes 100 times or more – in the frequency of occurrence of high sea-level events.
The report discusses the fact that the IPCC Fourth Assessment Report (2007) did not take into account the loss of ice due to dynamical processes in the large polar ice sheets (on Greenland and Antarctica). Semi-empirical models (i.e. Vermeer and Rahmstorf 2009) project up to a 2 meter sea level rise by 2100 by incorporating the observed acceleration of sea level rise during the 1990–2009 period, although the report concludes that projections of 1.5–2.0 meter sea level rise by 2100 seem high in light of recent questions surrounding estimates of the current rate of mass loss from polar ice sheets (Bromwich and Nicolas 2010).

Looking specifically at Australia, a 0.5 meter sea level rise would greatly increase the incidence of extreme high sea-level events, particularly in Sydney and Melbourne:
"For coastal areas around Australia’s largest cities – Sydney and Melbourne – a rise of 0.5 m leads to very large increases in the incidence of extreme events, by factors of 1000 or 10,000 for some locations. A multiplying factor of 100 means that an extreme event with a current probability of occurrence of 1-in-100 – the so-called one-in-a-hundred-year event – would occur every year. A multiplication factor of 1000 implies that the one-in-a-hundred-year inundation event would occur almost every month."
In other words, even if sea level rise is at the very low end of projections, many coastal cities like Sydney will experience a high frequency of flood events.

Ocean Acidification
The report proceeds to examine the projected rate of change and impacts from ocean acidification:
-
The contemporary rate of increase in ocean acidity (decrease in alkalinity) is very large from a long-time perspective.
-
The effects of increasing acidity are most apparent in the high latitude oceans, where the rates of dissolution of atmospheric CO2 are the greatest.
-
Increasing acidity in tropical ocean surface waters is already affecting coral growth; calcification rates have dropped by about 15% over the past two decades.
-
Rising SSTs have increased the number of bleaching events observed on the Great Barrier Reef (GBR) over the last few decades. There is a significant risk that with a temperature rise above 2 °C relative to pre-industrial levels and at CO2 concentrations above 500 ppm, much of the GBR will be converted to an algae-dominated ecosystem.
Chapter 2 contains a rather striking figure of ocean pH over the past 25 million years and projected to 2100:

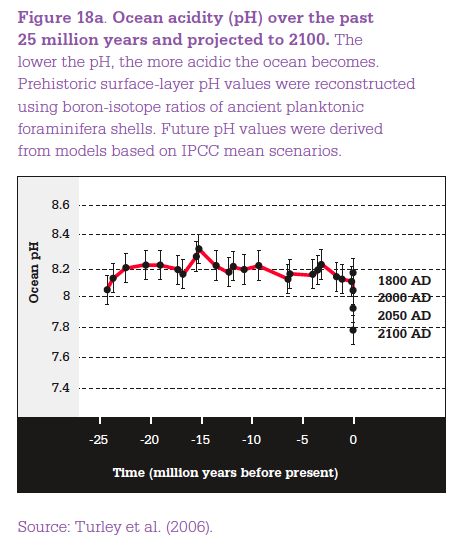
The impacts of increasing ocean acidity are already evident in some marine species, and there is evidence that acidification is already impacting the GBR and other coral reefs. If global temperatures rise more than 2°C above today's levels, it's anticipated that reefs will no longer be dominated by corals, as they will be adversely impacted by both acidification and rising ocean temperatures.
Water Cycle
The next section of the chapter examines the risks associated with the water cycle, which are of particular concern to Australia, as the driest of the world's six inhabited continents.
-
Observations since 1970 show a drying trend in most of eastern Australia and in southwest Western Australia but a wetting trend for much of the western half of the continent.
-
Given the high degree of natural variability of Australia’s rainfall, attributing observed changes to climate change is difficult. There is no clear trend, either in observations or model projections, for how the major mode of variability, ENSO, is responding to climate change. Evidence points to a possible climate change link to observed changes in the behaviour of the Southern Annular Mode (SAM) and the Indian Ocean Dipole (IOD).
-
Improvements in understanding of the climatic processes that influence rainfall suggest a connection to climate change in the observed drying trend in southeast Australia, especially in spring. In southwest Western Australia, climate change is likely to have made a significant contribution to the observed reduction in rainfall.
-
The consensus on projected changes in rainfall for the end of this century is (i) high for southwest Western Australia, where almost all models project continuing dry conditions; (ii) moderate for southeast and eastern Australia, where a majority of models project a reduction; and (iii) low across northern Australia. There is a high degree of uncertainty in the projections in (ii) and (iii), however.
-
Rainfall is the main driver of runoff, which is the direct link to water availability. Hydrological modelling indicates that water availability will likely decline in southwest Western Australia, and in southeast Australia, with less confidence in projections of the latter. There is considerable uncertainty in the projections of amounts and seasonality of changes in runoff.
In short, southwest Western Australia is likely to continue becoming very dry, but teasing out the impacts of global warming on the rest of the country's water supply is a challenge. In fact climate change could lead to more extremes in general, in both drought and rainfall in Australia. What the report does note is that once again, uncertainty is not our friend.
"This daunting uncertainty not only challenges attempts at adaptation, but also enhances, not diminishes, the imperative for rapid and vigorous global mitigation of greenhouse gas emissions."
Extreme Events
The next section of Chapter 2 relates to extreme events such as heatwaves, bushfires, heavy precipitation events, and storms.
-
Modest changes in average values of climatic parameters – for example, temperature and rainfall – can lead to disproportionately large changes in the frequency and intensity of extreme events.
-
On a global scale and across Australia it is very likely that since about 1950 there has been a decrease in the number of low temperature extremes and an increase in the number of high temperature extremes. In Australia high temperature extremes have increased significantly over the past decade, while the number of low temperature extremes has decreased.
-
The seasonality and intensity of large bushfires in southeast Australia is likely changing, with climate change a possible contributing factor. Examples include the 2003 Canberra fires and the 2009 Victoria fires.
As we know, we can't attribute individual extreme weather events to climate change, but we can say that global warming is "loading the dice" and making these sorts of events more likely to happen. On average, heatwaves and bushfires are becoming more intense, for example, and will continue to do so as the planet continues to warm. It is also plausible that by increasing atmospheric water vapor, global warming will lead to more extreme rainfall and flood events, and the report concludes that we should prepare for this contingency.
Abrupt Change and Tipping Points
The next section of Chapter 2 discusses abrupt, non-linear, irreversible changes in the climate system.
-
A number of potential abrupt changes in large sub-systems or processes in the climate system – so-called “tipping elements” – have been identified largely through palaeo-climatic research. Many of these, if triggered, would lead to catastrophic impacts on human societies.
-
Examples of tipping elements include abrupt changes in the North Atlantic ocean circulation, the switch of the Indian monsoon from a wet to a dry state or vice versa, and the conversion of the Amazon rainforest to a grassland or a savanna.
-
Very large uncertainties surround the likelihood, or not, of human-driven climate change triggering any of these abrupt or irreversible changes. Experts agree that the risk of triggering them increases as temperature rises.
-
Abrupt shifts in atmospheric circulation can occur very quickly and can have large impacts on regional climates. The recent cold, snowy winters in northern Europe, and their possible link to climate change, comprise a good example of this risk.
The report identifies a number of policy-relevant climate tipping elements throughout the world (click here for larger image) and examines the likelihood of passing some of these tipping points, and the risk associated with these scenarios:


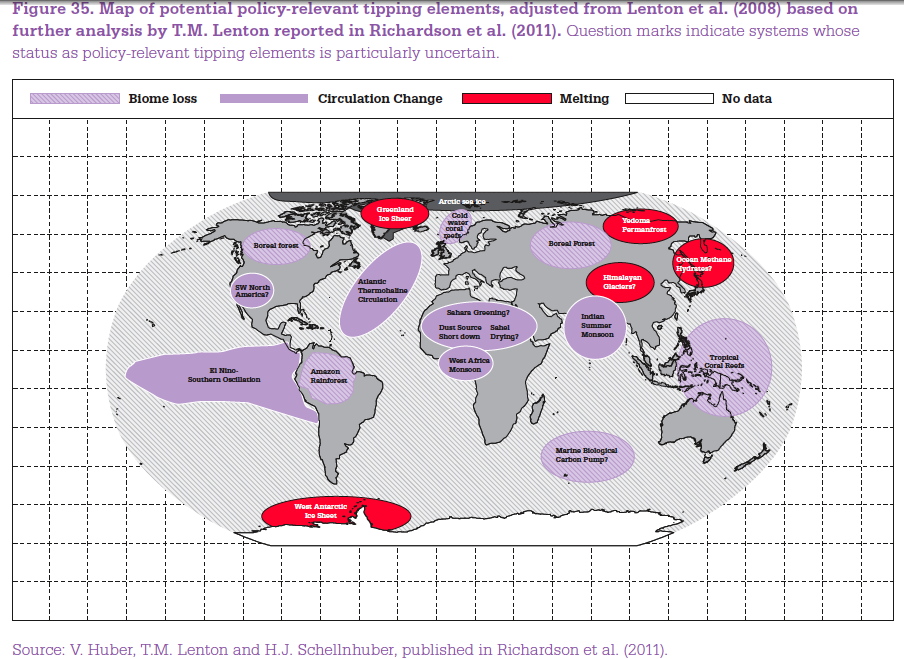
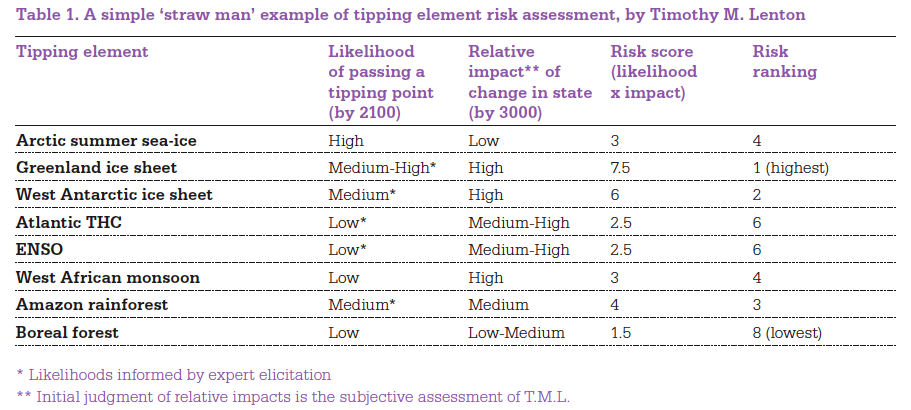
As you can see, the potentially rapid decline of the ice sheets and associated sea level rise represent the highest risk, followed by the loss of Amazon rainforest and Arctic sea ice.
Summary
In short, there are a lot of diverse risks associated with continued climate change. While there is a significant amount of uncertainty associated with some of these risks, we can't simply hope they won't happen or pretend the risks don't exist. Risk assessment and management involves taking all potential risks into account and determining the most effective way to reduce them. On that note, in Part 3 we will examine the report's conclusions regarding the science implications on future carbon emissions reductions.

Arguments


[dana1981] Thanks very much. I agree it's a very good report.
Figure 22. Trend in total annual stream flow into Perth dams 1911-2010
I knew we were short on water here, but I've never seen it in historical context like that before. Looks like more desalination plants will have to be built, and hopefully using windpower.
[dana1981] Thanks. I think certain parties confuse "alarmist" with "alarming". I agree, there's nothing alarmist about this report, but it does contain some alarming information. Unfortunately reality is rather alarming right now.
But very strangely, you seem to think that people will keep living in those parts of the country that will be flooded "almost every month" . But just think of what "flooded every month" really means : it is just the part of the coast that is flooded at each high tide (actually twice a month) ! and it already exists everywhere. Nobody leaves here, or if we really want to live there, we just build some levees to protect the place. And the new building are not really a cost since they will be build anyway in all cases. Why would people living in 100 years be unable to do the same reasonable things as we do now ? humanity has always adapted to varying conditions, including SLR that exists since the end of glaciations. It has adapted to huge changes of way of life since the beginning of industrial civilization - your life has nothing in common with your grandparents' one. Do you think that your current life would have been absolutely impossible if the SLR would have been twice or three times as high as what it has really been in the XXth century ? why ?
People can adapt to a lot. They can adapt to living in a tornado zone. They can adapt to living in earthquake zone. They could adapt to living in a zombie apocalypse. So what? Why should we have to? What appears to be your underlying denialism ignores the blindingly obvious fact that it would be breathtakingly stupid to pursue a course of inaction that brings about a nasty situation that we would have to "adapt" to, that we could avoid by taking action. Only an in idiot or denier could foresee something bad happening and do nothing to stop it manifesting.
It's where important infrastructure that supports people who live all over a city's region. The 3 biggies, apart from the obvious one of port facilities both for freight and for fishing fleets, would be sewage processing plants, power plants using ocean water for cooling and airports established on flat land near coasts. Less frequent local effects would be saltwater intrusion into groundwaters and wetlands as well as further upriver in some locations.
"... your life has nothing in common with your grandparents' one."
I beg to differ. In all the important things, my life is a lot like my grandparents. My main interest, as was theirs, is the welfare of my children (and their children). I use technology they never dreamt of, I've never lived through a world war waiting for husbands or children to return, and I don't attend church every week.
But people are just people. My concern for my family, my friends, my neighbourhood and society at large is very like the concerns of previous generations. Hopefully, coming generations will have the same chances I had - rather than the ghastly privations of worldwide wars and worldwide depressions of my parents and grandparents.
However what I said is that it is clear from figure 15 that the SLR will be pretty insensitive to any policy we could adopt - the uncertainty ranges largely overlap and the increase will continue for centuries if Rahmstorf model is true. Meaning that the SLR is already in the pipe and, even we stopped totally now any GES emission, it would continue rising and reach one meter around the turn of the century. The differences between the scenarios being only about one decade or so. So it is actually pretty much like a natural phenomenon that you cannot. Whatever you think it will cause, you'd better prepare your children by telling them it will happen anyway.
Now I doubt very much that all infrastructures you can see around you will be unchanged at the end of the century. And cutting off the use of fossil fuels will probably change much more your way of life than a few dozens of centimeter of water on the coast. You live in a huge country : do you have any idea of how travelling across it without oil for instance ? that would be a huge change !
[dana1981] Sea level rise is far from the only consequence of climate change. As Thompson has said, there will be some degree of mitigation, adaption, and suffering. The less we mitigate, the more we will have to adapt and suffer.
Trouble is that the last 10 years of climate measurement is not following the AGW script. Surface temperature rise is flattening, Sea level rise is dropping below the touted trend line of 3.1mm per year, and the warming imbalance measured by ocean heat content is flattening, by some measures down by at least 30% and by others - actually cooling.
Jim Hansen (AGW guru and lead IPCC author) has recently written a 52 page synopsis which finds a reduction in the warming imbalance from 0.9W/sq.m to 0.59W/sq.m which he mainly attributes to substantial underestimated cooling due to aerosols. His explanations of other factors are highly contentious, including a preposterous 'delayed Pinitubo rebound effect', however the import of his conclusion is the sleeper in this debate.
Jim Hansen has abandoned the 'its there but we can't measure it yet' explanation of Dr Trenberth's missing heat travesty, and recognized that at least 30% of the warming 'trapped heat' in the oceans - ain't there at all.
[dana1981] Please stop cherrypicking the last 10 years. Moreover, Trenberth has a draft paper out where he suggests the location of the 'missing heat':
Why not? The Indian-Pacific railway runs east-west between Sydney and Perth travelling through Broken Hill and Port Augusta with a diversion to Adelaide. I can see no good reason why current technology wouldn't develop to allow that train to be completely electric.
Anyone who wants personal car travel can either hire at the other end or transport their own vehicle (preferably EV) on the train as well. Similar considerations apply to the north-south route of the Ghan going from Adelaide to Darwin.
But get this: it got hotter again. Now I'm completely confused. It's almost as if I shouldn't have used a short, few-weeks temperature trend to make any conclusions about what season it was.
Breaking out of passive-aggressive mode for a mo: anyone who can understand why it can get colder for a few weeks without upsetting the order of the seasons can also understand why you don't conclude much from short-term climate variation. If you can't understand that, fair enough. If you can, you're just trolling.
[dana1981] Well said. I always enjoy a bit of good sarcasm!
Hopelessly dumb and corrupt politicians, too. And strange comment trolls, as Mr. Lambert above.
Let's hope that one of us wakes up soon, and brings the other with him.
[DB] Please, can everyone refrain from attaching the appellation of "troll/trolling"? If you feel a comment is off-topic, challenge the originator of the comment, appropriately and within the confines of the Comments Policy and direct them to a more appropriate thread.
This forum belongs to all of you. Self-policing will keep other activities to a minimum. For those, bring it to the attention of the moderators. Because sometimes we miss stuff. Happens. :(
Dr. Hansens paper points out that for the past 5 years we have had the lowest solar activity for decades. This low solar output accounts for much of the lower heat accumulation in the past 5 years. Keep in mind that the two hottest years recorded were 2010 and 2005, both when solar output was low. Solar activity is now increasing. New heat records will come much faster as the sun warms again.
Hansen postulates that aerosol reflection has reduced the increase in temperature so far from AGW more than models account for. That is bad news in the long run. When the people in China and India get tired of the pollution and reduce aerosols, the planet will substantially warm as aerosols are reduced. This warming cannot be stopped.
The take home message from Hansen is that we must take action immediately if we want to avoid the worst of the problems. Your suggestion that Hansens result means we have no worries now is wrong.
The other part of the message is that aerosols had a greater impact on the cooling up until ~1980. Part of the rapid temperature increase was due to atmospheric aerosol reduction. The question is, were these natural or man-made aerosols that predominated?
Hence, the longer term temperature record is a better indicator of future changes than the last several years.
Also, 1998 was a year of high solar activity.
That is the point. You don't travel as much without the energy.
Is there a problem with that? Does someone have the right to travel long distances?
Prospect of limiting the global increase in temperature to 2ºC is getting bleaker
[dana1981] Indeed, we have a post on this bleak news coming in the very near future. Stay tuned.
The 11 year Solar ripple has an amplitude of about 0.25W/sq.m top to bottom. From a mean, it can only account for half that amplitude - 0.13W/sq.m reduction in the imbalance.
The total reduction of the imbalance is 0.31W/sq.m so Solar minimum accounts for less than half.
Don't forget that Hansen's 0.59W/sq.m is based on the Von Schukmann OHC construction which is far from robust. Other OHC constructions approach zero.
Let me know when China and India stop buying Australian coal to turn into CO2 and aerosols.
China is opening the equivalent of Australia's total coal fired capacity EVERY YEAR for the next 10 years.
Could someone explain to a person not born in the 1980's (me) what is 'trolling'? I have not completed a course in SKS-speak.
[DB] "Could someone explain to a person not born in the 1980's (me) what is 'trolling'? I have not completed a course in SKS-speak."
From the Wiki:
Note that any SkS usage is the same as above.
If your mildly amusing sarcasm can allow for a peek into the world of logic, you might conclude that Jim Hansen is also discussing 'short term' variation - in this case 2005-11 - a 6 year period of OHC reduction.
Why would Jim Hansen draw a conclusion from a 6 year period at all? Maybe he thought it was significant.
[ -inflammatory comment snipped-]
The problem arises when you blindly extrapolate short term trends to draw conclusions about the long term without considering the underlying physics. That does not imply that one cannot analyze short term periods at all, which would be a ridiculous claim.
You are also confusing "statistically significant" with "significant" as in important or noteworthy. Six years are not enough to establish a statistically significant long term global trend, and Hansen never claimed otherwise. That does not mean that those years are unworthy of study or discussion. You are conflating two distinct concepts and arguing a strawman.
On the other hand, your call to 'address the numbers' is quite appropriate. The post above yours, by scaddenp, does just that, and asks you for the OHC reconstructions that you're referring to in your earlier post. I'd like to see them too, because claiming there has been zero OHC buildup over the past decade or so is an extraordinary claim, and I'm sure you know what that requires.
Note that we're interested especially in deep ocean heat, not just surface waters, as per Trenberth's paper that dana1981 linked in the reply to your post up above.
I have not read the latest Trenberth paper - but I will study it over the weekend. Thanks for bringing it to everyone's attention.
The ocean heat story was done to death here:
http://www.skepticalscience.com/news.php?p=3&t=132&&n=723
Pay attention to the KL and BP posts - most informative.
I did not claim 'zero' heat buildup. I said "Other OHC constructions approach zero".
As far as I know VS is the only 0-2000m Argo analysis. K&D found little or none in the 0-700m layers. P&J found about 0.1W/sq.m in the deep oceans below 2000m. To be pedantic, 0.1 is closer to zero than 0.9.
e - I never said 'statistically significant in referring to Hansen. I said "Maybe he thought it was significant."
Would "Maybe he thought it was important" do?
JimHansen draws a conclusion from 6 years of Argo dat abecasue that is all the data that is available. As more comes in it will be added and the result will be more robust. When you add the pre-Argo data you get a longer record.
As for you wanting to know when China will stop buying coal I agree it may be a while, that depends on the politics. On the other hand, eventually the coal will run out and China will have to stop burning it. It seems to me that you are suggesting that if the time the Faustian bargain comes due is after you are gone you do not care. Some of care about what our children and grandchildren have to deal with.
You can bet that a very comprehensive analysis is going to be published in time for inclusion in AR5 so that will be interesting.
"Jim Hansen draws a conclusion from 6 years of Argo dat abecasue that is all the data that is available."
Quite right Michael. Jim Hansen seems to think it is legitimate to study and quote the Argo record by itself. Which I agree with because of its vast improvement in spatial coverage over prior methods.
I would point out though, that if I do the same thing - Moderators and others on this site label me a 'cherry picker'.
Absolutely stunning. Even those of us who know what hit us aren't going to to know what hit us!
What I question – as does the Commission - is the reliability of its SLR estimates. Fig 15 suggests an almost linear rise in sea level, a view held by some climate scientists, eg. Archer but disputed by others, Hansen. SLR is related to melting of ice, particularly polar ice which in turn influenced by a number of factors such as rise in temperature of ocean water and the atmosphere. In the Arctic slow (but accelerating) methane feedback will prove important.
Hansen et al 2011 expresses the view that, taking these factors into account, it can be expected that the rate of melting of the Greenland Ice Sheet (GIS) can be expected to double each decade, increasing from its present level (250 Gt/year) to ~130,000 Gt/year by 2100. He argues that since the main cause of SLR is non-linear, SLR itself can not be linear and concludes that a SLR of 0.5m by 2080 will be followed by a very rapid rise of 4.5m before 2100, resulting in a 5m. rise this century, consistent with polar ice loss.
Although Hansen qualifies his conclusions by stating that more data is needed to verify decadal doubling of GIS ice loss, he has been proven right on too many occasions to ignore. While one might cautiously accept the Commissions’ 2050 SLR estimate, it would seem unwise to rely on its forecast of a 1m rise by 2100. It will certainly be much higher.