


 Arguments


How much is sea level rising?
What the science says...
| Select a level... |
 Basic
Basic
|
 Intermediate
| |||
|
A variety of different measurements find steadily rising sea levels over the past century. |
|||||
Climate Myth...
Sea level rise is exaggerated
"We are told sea level is rising and will soon swamp all of our cities. Everybody knows that the Pacific island of Tuvalu is sinking. ...
Around 1990 it became obvious the local tide-gauge did not agree - there was no evidence of 'sinking.' So scientists at Flinders University, Adelaide, set up new, modern, tide-gauges in 12 Pacific islands.
Recently, the whole project was abandoned as there was no sign of a change in sea level at any of the 12 islands for the past 16 years." Vincent Gray).
At a glance
You'd think it would be obvious, wouldn't you? If ice (or snow) melts, you get water. Water flows downhill through gravity and collects wherever it can be retained. In areas that see regular winter snowfalls, the processes involved are familiar. Snow-capped mountains look photogenic but along comes the eventual thaw and the river levels rise sharply with all the meltwater.
Now apply the same basic principles to glaciers and ice-caps. It should not come as a surprise that exactly the same thing happens and where that meltwater collects is ultimately the oceans. Note here that we're talking about land-based ice, not sea-ice: sea-ice is already part of the ocean so does not affect sea levels as it forms and melts every year. But melt enough land-ice and you get very significant change indeed.
What do we mean by very significant? Well, let's look at the transition out of the last ice-age that dominated the last 20,000 years. It began with ice-caps over parts of Europe and North America and ended not so long ago with much of that ice gone but with sea levels having risen by more than 120 metres. If that's not significant, what is?
There's not enough ice left on Earth to raise sea levels by that whopping amount now, but there is enough to raise the oceans by more than 60 metres. Over what sort of time-frame? Well, we know that the current rate of sea level rise is some 3.7 mm a year, or nearly an inch and a half per decade. A lot of that is due to the expansion of the oceans - as things are warmed up they expand. But the rate is accelerating. How fast do we think it can get?
We do have the past to consider: during the glacial meltdown of the past 20,000 years, there was a period ominously named Meltwater Pulse 1A that began some 14,700 years ago. During this enhanced period of melting, sea levels rose by between 16 and 25 metres in about 400–500 years. That's roughly 40–60 mm per year or 16-23 inches a decade.
Could such drastic rates of sea level rise happen again? Probably not but nevertheless it shows what is possible as ice-sheets collapse in a warming world. But even if sea level rise stays at its current rate (it won't), that's getting on for a two-metre increase over the coming 300 years and a one-half to one-metre increase over the next 100 years. Now go anywhere affected by tides and think about all the communities of people that live and work along the shore. Pick the biggest spring tides, take a look at where they reach at high water, maybe watch the waves and surge when a storm occurs, then imagine an extra two metres of water on top of that.
And try to imagine being the decision-makers in the coming decades and centuries, who will have to work out what best to do. What would you think of the people all those years ago, who went around pretending this was not happening? Not favourably, for sure - because of such behaviour, that is how history will remember them.
Please use this form to provide feedback about this new "At a glance" section. Read a more technical version below or dig deeper via the tabs above!
Further details
The climate myth set out in the coloured box above gives an insight into the minds of climate change deniers. Why? Because it's entirely made-up. It annoyed the Realclimate blog's Gavin Schmidt sufficiently for him to write an eloquent debunking in 2012 that is well worth reading because it demonstrates so clearly what we, the scientific community, are up against.
The claim that tide gauges on islands in the Pacific Ocean show no sea level rise is nonsense: the data presented in the Realclimate link above show a variably rising sea level trend at each station. But what about global sea level rise?
Sea level rises as ice on land melts and as warming ocean waters expand. As well as being an existential threat to coastal habitation and environments (think about many of the world's capital cities here), sea level rise corroborates other evidence of global warming
The black line in the graph below (fig. 1) clearly shows sea level is rising; its upward curve shows how sea level is rising faster as time goes on. The upward curve agrees with global temperature trends and with the accelerating melting of ice in Greenland and other places.
Because sea level behaviour is such an important signal for tracking climate change, the misinformers seized on the sea level record in an effort to cast doubt on this evidence. As fig. 1 clearly demonstrates, sea level bounces up and down slightly from year to year so it's possible to cherry-pick data and falsely suggest the overall trend is flat, falling or linear. You can try this yourself. Starting with two closely spaced data points on the graph below, lay a straight-edge between them and notice how for a short period of time you can create almost any slope you prefer, simply by being selective about what data points you use. Now choose data points farther apart. Notice that as your selected data points cover more time, the more your mini-graph reflects the big picture. The lesson? Always look at all the data rather than being fooled by selective presentations.
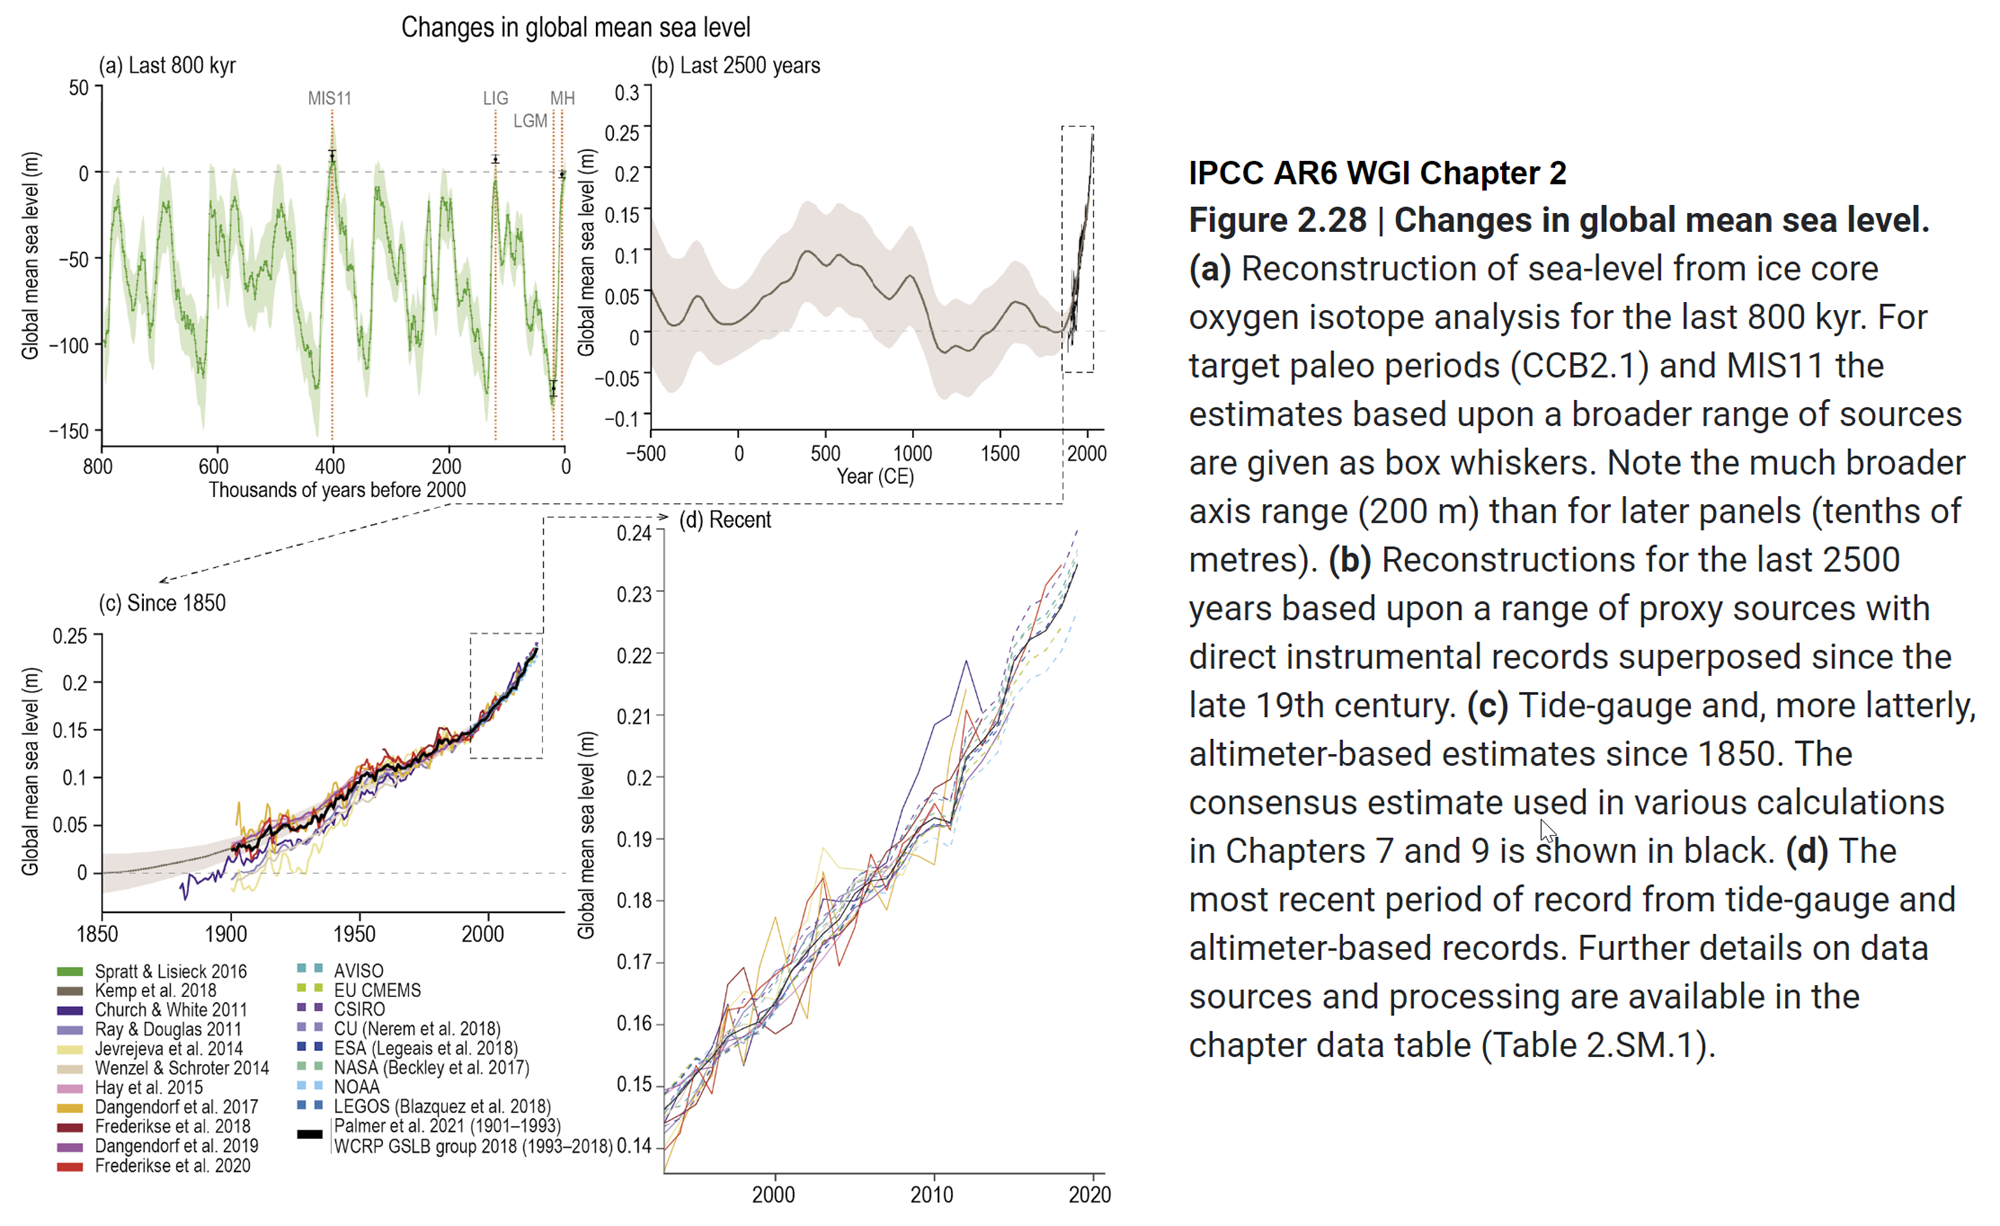
Fig. 1: sea level change, from IPCC AR6 WGI Chapter 2 section Climate Change 2021: The Physical Science Basis. Tide-gauge and, more latterly, altimeter-based estimates since 1850. The full image with all four panels and IPCC caption is available here.
Other denialist arguments about sea level concern the validity of observations, obtained via tide gauges and more recently satellite altimeter observations.
Tide gauges must take into account changes in the height of land itself caused by local geological processes, a favourite distraction for deniers to highlight. It will come as no surprise to learn that scientists measuring sea level with tide gauges are aware of - and compensate for - these factors. Confounding influences are accounted for in measurements and while they leave some noise in the record they cannot account for the observed long-term upward trend.
Various technical criticisms are mounted against satellite altimeter measurements by deniers. Indeed, deriving millimetre-level accuracy from orbit is a stunning technical feat so it's not hard to understand why some people find such an accomplishment unbelievable. It's astonishing that in another breath they are happy to jump aboard an airliner, parts of which are engineered to a similar tolerance!
In reality, researchers demonstrate this height measurement technique's accuracy to be within 1 mm/year. Most importantly there is no form of residual error that could falsely produce the upward trend in observations.
As can be seen in an inset of the graph in fig. 1, tide gauge and satellite altimeter measurements track each other with remarkable similarity. These two independent systems mutually support the observed trend in sea level. If an argument depends on skipping certain observations or emphasises uncertainty while ignoring an obvious trend, that's a clue you're being steered as opposed to informed. Don't be misled by only a carefully-selected portion of the available evidence being disclosed. Look at it all.
Current sea level rise is not exaggerated, in fact the opposite case is more plausible. For one, sea level rise is not the same everywhere. Many areas around the world already experience much faster rates of sea level rise than the average global rate shown in Fig 1. As well, observational data and changing conditions in such places as Greenland suggest if there's a real problem here it's underestimation of future sea level rise. Past IPCC synthesis reports offered rather conservative projections of sea level increase based on assumptions about future behaviour of ice sheets and glaciers, leading to estimates of sea level roughly following a linear upward trend mimicking that of recent decades. In point of fact, observed sea level rise is already above older IPCC projections - and accelerating - while at the same time it appears the mass balance of continental ice once envisioned by the IPCC was overly optimistic (Rahmstorf 2010; Otosaka et al. 2023).
Fast-forward to 2023 and the recent IPCC AR6 Synthesis Report is a bit less nuanced:
Limiting global surface temperature does not prevent continued changes in climate system components that have multi-decadal or longer timescales of response (high confidence). Sea level rise is unavoidable for centuries to millennia due to continuing deep ocean warming and ice sheet melt, and sea levels will remain elevated for thousands of years (high confidence). However, deep, rapid and sustained GHG emissions reductions would limit further sea level rise acceleration and projected long-term sea level rise commitment. Relative to 1995–2014, the likely global mean sea level rise under the SSP1-1.9 GHG emissions scenario is 0.15–0.23 m by 2050 and 0.28–0.55 m by 2100; while for the SSP5-8.5 GHG emissions scenario it is 0.20–0.29 m by 2050 and 0.63–1.01 m by 2100 (medium confidence).
The report goes on to state, however:
The probability of low-likelihood outcomes associated with potentially very large impacts increases with higher global warming levels (high confidence). Due to deep uncertainty linked to ice-sheet processes, global mean sea level rise above the likely range – approaching 2 m by 2100 and in excess of 15 m by 2300 under the very high GHG emissions scenario (SSP5-8.5) (low confidence) – cannot be excluded.
If they cannot exclude such risks - and they know what they are talking about - can you?
Last updated on 20 August 2023 by John Mason. View Archives


MA Rodger @ 250
Thanks for the explanation. I suspect that when I get through this thread I will tackle Chapters 3 and 13 in IPCC AR5. Probably should read those first but this is easier reading (I do not want to say more entertaining).
michael sweet @ 228
I have now read this full thread and am on to reading Chapter 3 of the IPCC AR5 relating to sea level changes (with Chapter 13 to follow).
After re-reading your post at 228 above I think I have to reply to you because in a number of places in that post you suggest that Koonin and the writer are "lying" when referring to the fact that the IPCC had suggested that there was a period of "similar rates" during he period 1920-1950.
Here are two of the quotes:
"Koonin cites the IPCC to support his lie that sea level rise is approximately the same now as in 1950."
"Raise your game. You have been posting here at SkS for a long time and you still post these obviously false claims from sources you have been repeatedly shown are spouting lies. It is time consuming to find the actual data to respond to these lies."
I am somewhat disappointed that the Moderator of this website did not "snip" parts of your post @ 228 because if these are not "ad hominen" comments (or what I might also describe as "bullying") then I do not know what is. These are comments directed not to the issues but to the person either making the comments or being quoted as a source. Is there a different standard for those posters on this website who seem to be "regulars" supporting the positions of SKS?
What concerns me is that based upon your knowledge level of sea level issues (evidenced both from this thread and others) that in all likelihood you knew at the time I made my post @ 221 that you fully knew where my confusion arose in that at the time of that post I had not realized that the IPCC statement of "similar rates" was based upon the IPCC referencing the Jevrejeva and Ray & Douglas estimates of sea level rise (not the Church & White lower estimates) which studies did in fact show "similar rates" during the 1920-1950 period.
I am also sure that you were fully aware at the time of your post of the discussions of the IPCC in Sections 3.7.4 to 3.7.6 inclusive of Chapter 3 where this "similar rate" and explanation of same are discussed.
Therefore your use of the word "lies" was completely inappropriate.
Moderator: I had hoped to post a copy of the Figure 3.14 graph with this post but could not figure out how to do it. Copy and paste from a pdf does not work. If you could post a copy it would be appreciated to clarify to others where this confusion arose. Any help on how to do so myself would also be appreciated. I was not able to "lift" the graph from the pdf itself.
MA Rodger @ 250
Thanks for the additional information. As noted above, I am working through all of Chapter 3.
Norrism @251,
The US CSSR report contains data up to 2016. The IPCC report only contains data up to 2012. SInce the CSSR contains more up to data, Noonan cannot use an outdated graph from the IPCC report to claim that the CSSR is incorrect. The knowledge of scientists has increased since the SR5 was written.
The data on sea level rise and acceleration has been updated since the AR5 was written. The CSSR report is now the gold standard. Noonan knew that the data he used was out of date when he wrote his article. If he wants to complain he needs to use the most recent data available. The fact that he did not use current data indicates that either he is ignorant of the data (and cannot complain about what he does not know) or he is trying to obscure the conclusion.
The data from Jevrejeva et al graphed in figure 3.14 above (sorry it is blurry) was published in 2008. It has been updated since then. Sea level rise has dramatically increased since then. If the graph was drawn with current data the result would be different.
I have provided data that show that sea level rise has accelerated over the past decade. Noonan relies on data almost 10 years old for his claim. That is not an honest claim when we know the rate is accelerating.
You came here and were angry that the claim that current sea level rise was comparable from 1920-1950 was not included in the CSSR. Your claim was based on Noonan's article. You have previously been provided with data that shows Noonan is not a reliable source of information. You need to be much more skeptical when you read information on Currie's blog, it has a reputation for misleading information.
If you came here and asked why this claim was left out and linked Noonan's article it would have been explained to you. When you are upset the claim was left out (because it is incorrect) you are not treated the same.
NorrisM, you indeed seem to not know what constitutes an ad hominem argument. It is the logical fallacy that consists of attacking a person on some irrelevant element in an attempt to invalidate the argument made by that person. Michael Sweet's comment is relevant, on point, and does not say anything about your person, only about your failure to scrutinize information; you did fail to exercise proper diligence and apply due skepticism to the weak attempt by Koonin at misleading. This should be brought to your attention. It was. No logical fallacy there.
Phillipe Chantreau @ 255
This all began on this thread @ 221 with my comment as follows:
"In an earlier post on another thread (which discussion has properly moved to this location) I posed the following question:
'It is interesting that in the above IPCC quote we had similar "high rates" during the period 1920-1950. Curious as to whether there is any explanation of that anomaly.'
I then referenced the fact that Steve Koonin had, since I had made my comment, picked up on this very same question about "similar rates" during the period 1920-1950 and was critical of the CSSR because in the CSSR Executive Summary there should have been a reference to this period of similar high rates to provide a proper scientific balance.
This however gets turned to Koonin being a "liar" and me being one spreading lies.
The definition of "ad hominen", straight out of wikipedia is a little more direct that your soft-pedalled definition. It states as follows:
"an argumentative strategy whereby an argument is rebutted by attacking the character, motive or other attribute of the person rather than attacking the substance of the argument itself".
If calling someone a liar is not an an hominem attack on a person then I do not know what is. The statement of Koonin gets turned around to the following:
"Koonin cites the IPCC to support his lie that sea level rise is approximately the same now as in 1950."
He did NOT say that. He said that there were rates of increase in the 1920-1950 period comparable to the present and he felt that a more even handed CSSR report would have made reference to this fact in the same way the IPCC did in its Executive Summary to Chapter 3 of the AR5 report.
We are not talking about "more up to date evidence". We are talking about the present compared to a period in the past. If someone here is going to say, well, Koonin totally misrepresented things because we are now around 4 mm/yr rather than 3.2 mm/yr, I will pull up some quotes from this very same thread from a number of years ago about how inappropriate it is to use a couple of years results for any analysis. In any event, that is no basis to label someone a liar.
To be very honest, I cannot see why that is not just an ad hominen comment but moves into a libellous statement against Koonin.
With all due respect to you, NorrisM :- my OED defines ad hominem as "Directed to the preferences or principles of the individual, not to abstract truth". Can there be a better English authority than the OED?
Michael Sweet has directed his criticism to the abstract truth which is the evidence of SLR caused by AGW. He has exposed Koonin [or "Noonan", as Sweet's Irish blood seems to mislabel it, often] as presenting flawed, incomplete, false, deceptive & misleading information about SLR (and by extension, about AGW).
Koonin presents information without its proper context, and in a deliberately misleading way. We can be reasonably sure Koonin is being deliberately misleading in this case, because his action here is part of a larger pattern of deceptive & misleading activities in connection with the subject of AGW. And we can be doubly sure of that, because Koonin is an intelligent, science-literate man, in whom such errors are inexcusable & could not occur without deliberate choice by him.
All this reflects very badly on Koonin — reflects very badly on his "preferences and principles". But that is consequential on Koonin's own activities. Sweet points out that Koonin is reprehensibly wrong (but that is not in itself an ad hominem attack).
NorrisM, the question you should ask yourself is: Why should you (or anyone) defend Koonin's untruthful behavior? Koonin for some years now has been bending over backwards to give false & misleading presentation of the science of climate/AGW. There must be some strange subconscious emotional force which compels Koonin to plunge into the fiery heart of madness which is science-denial (and you too, NorrisM, seem a Moth which is attracted into the same flame).
NorrisM, you cannot describe yourself as "luke-warm" when your wings are already badly singed. ;-)
NorrisM @256.
Pointing to a quote up-thread which cautions against using "a couple of years results for an analysis" will not assist you in explaining the high rate of SLR over the period since the IPCC AR5. The following SLR graphic is from Tamino and certainly indicates a strong level of SLR acceleration since the IPCC AR5 analysis. And if you are considering saying that the data supporting that Tamino finding is inadequate, I would suggest you examine the data supporting those accelerations back in the 1940s and see if that is similarly inadequate.
MA Rodger @ 258
I am not saying that we ignore the most recent measurements since IPCC AR5 but that they have to be taken in context. Here is what Dan Bailey said at post 184 above when responding to a period 2004 to 2008 when things seem to have flattened out or, looking at the above graph, had even declined:
"[DB] In addition, per Willis and Leuiette (2011):
"Because of both uncertainties in the observational systems and interannual variations, it has been estimated that a minimum of 10 years is necessary to meaningfully interpret global trends in sea level rise and its components (Nerem et al., 1999)."
In other words, use the period 1993 onwards just averaging in each subsequent year. My understanding is that we are using 1993 because satellite measurements began around this time. Someone (somewhere) has posted a comment that if the period 1992-1994 had been averaged (as the starting point), the rate of increase would not have been as high as 3.2 mm/yr because 1993 was significantly lower than 1992 and 1994. I have to admit that I do not have a source for this but I suspect this can be easily proven or disproven.
eclectic @ 257
I have made my point and I do not think we need to pursue this any further.
I trust you will agree that no one should be called a liar on this website unless they can prove a statement to be untruthful unless he or she is prepared to back it up in court defending a libel suit. A statement can be wrong but "liar" connotes an intention on the part of the person making it and that is not appropriate on this website. Again, if that is not "ad hominen" I do not know what is.
It remains the case that none of the comments on this thread have "dealt with the substance of the argument itself" which is the following:
"He said that there were rates of increase in the 1920-1950 period comparable to the present and he felt that a more even handed CSSR report would have made reference to this fact in the same way the IPCC did in its Executive Summary to Chapter 3 of the AR5 report."
Koonin is making the point that the failure by the CSSR not to include this statement in the Executive Summary (which the IPCC properly disclosed in AR5 Chp 3 and 13) indicates that the CSSR has an "agenda" it is promoting and is not just reporting, as scientists should do, the scientific information available both for and against the propostion of AGW. It is this very attitude that creates distrust in those (ie X% of the US public) not fully convinced that AGW is as serious as it has been made out to be.
Has anyone commented on this argument of Koonin's? Do you not agree that the CSSR should have followed the same disclosure as the IPCC? And if so, why not?
[JH] Further regurtitation by you of Koonin's claim about sea level rise will constitute "excessive repetition" and "slogaqneering." As you well know, both are prohibited by the SkS Comments Policy.
Norrism:
You and Koonan argue that the CSSR should include the claim that rates of sea level rise in the time era 1920-1950 were compaarable to current rates. Jeverejeva et al 2014 specifically address this claim.
From the introduction to Jevrejeva et al 2014:
"However, there have been suggestions that the rate is not historically exceptional. For example, similar rates were observed in tide gauge records during the period 1920–1950 (Jevrejeva et al., 2006) and in decadal mean rates in the 1950s and 1970s (Church and White, 2006), and even a rate of 5.3 mm·yr−1 centred on the 1980s by Holgate (2007).
To identify the long-term changes and variability of sea level over the past 200 years ..."
From the conclusion:
"However, Fig. 15 and the associated uncertainties discussed in Section 3.4 show that long term estimates of time variable sea level acceleration in 203 year global reconstruction are significantly positive, which supports our previous finding (Jevrejeva et al., 2008a), that despite strong low frequency variability (larger than 60 years) the rate of sea level rise is increasing with time." (my emphasis)
Koonan's claim that the current rate of sea level rise is not exceptional is in contradiction to the conclusions of scientists working in the field. It is not included in the CSSR because scientists have concluded that the rate of sea level rise is accelerating. The current rate of sea level rise is historically exceptional.
In addition, the rate of sea level rise is expected to strongly accelerate in the future.
This is the same conclusion that I posted at the start of this discussion where I provided data showing that the rate of sea level rise has accelerated strongly over the period of satelite analysis. The data show that the rate of acceleration of sea level rise is accelerating.
Koonan and you are attempting to cherry pick sentences that suggest sea level rise is not accelerating and is not a problem. That is in contradiction to the scientific conclusion. The CSSR is required to discuss the scientific conclusion, not some potitically correct BS.
NorrisM @259.
You are verging into the incomprehensible so you will understand if I am at cross purposes.
You seem to object to the use of recent data but at the same time happy to consider 10+ year assessments of SLR. So let us look at the satellite data (which is available 1993-2017) calculating 11yr OLS trends. Note that IPCC AR5 data collection stopped in 2011 so we have six more years of data. The final 11 years of data used by AR5 showed a trend of 2.8mm/yr and such trends would continue to drop to 2.55mm/yr by the following year. Since that time, SLR has risen sharpely and the last 11 year of data shows a trend of 4.2mm/yr. There is yet no sign of any let-up in that acceleration. (It is running along the same track as shown in the Tamino graphic @258, just past the vertical blue line.)
And using Church & White tidal gauge data (which today only runs to 2013 but AR5 had data to 2009), the final years are running above 4mm/yr while such 11-yr trends calculated through the full record never top 3mm/yr.
NorrisM likes this definition : "an argumentative strategy whereby an argument is rebutted by attacking the character, motive or other attribute of the person rather than attacking the substance of the argument itself."
I said: "the logical fallacy that consists of attacking a person on some irrelevant element in an attempt to invalidate the argument made by that person."
Any attempt at convincing me that there is a significant difference between these two descriptions is an argument in bad faith that has no merit. I know without a doubt that one who would try to do that is trying to take me for a ride. It is total nonsense. I certainly have better things to do with the time given to me in this life than going back over NorrisM overall contribution on this site, but my recollection of said contribution is telling me that there is a pattern here. The abundant verbiage to say what amounts to nothing and the rather laughable litigation threats are also familiar signs. The obligation to remain polite and tolerant toward this kind of sophisticated abuse of the forum was one of the reason why I gave up moderating years ago. It is quite an ungreateful task that the moderatros tackle...
[JH] Please note my Moderator's comment on NorrisM's most recent post. As far as I am concerned, he is skating on the thin ice of relinquishing his privilege of posting comments on this site.
As far as I can see no-one has used the word "liar" other than NorrisM.
I don't think I have any more to say on that.
MA Rodger @ 262
If I understand you correctly, the satellite data averaged over the last 11 years shows an average increase of 4.2 mm/yr? And in the case of tide gauge data, although the most recent years show an annual increase over 4 mm/yr the average over the last 11 years is something below 3 mm/yr? Your use of the term "trend" suggests that I might not have this right.
From what I have read there seems to be an unresolved discrepancy between satellite readings and tide gauge readings which seems to be borne out by the difference in these rates. They can still show the same acceleration but the measurements do not coincide.
Phillipe Chantreau @ 263
I have never said that there was a significant difference between your definition and mine. I just felt yours was somewhat softer. The term "ad hominen" in Latin means "at or to the man". The principal point I was trying to make is that this website should not allow posters to allege that particular people are telling or spreading lies. That is a very serious allegation. I agree that no one other than the writer has actually used the noun "liar" but is that not what you call someone who lies? I think I have made my point and I suspect most agree that it is not appropriate to make such allegations when the term "misrepresentation" can be used which probably more accurately describes what the poster intended to say.
[JH] You wrote:
Have you posted a similar statement on Curry's website? On WUWT?
There are: misrepresentations, damned misrepresentations, and statistics !
Oh, where is our Disraeli or our Churchill when we need him, eh NorrisM. Churchill, I am sure, would make short work of Koonin and Koonin's misrepresentations — and Churchill would use a three-letter word, not a polysyllabic.
In particular for Koonin's statement on SLR's . . . "The rates since 1993 are at the high end of this range, but are not statistically different from those during the first half of the 20th Century." ~ That being the sort of weasel statistics up with which Churchill would not put.
"Not statistically different" is a term we have heard before — during the transient "Hiatus" in surface temperatures during the Noughties of this Century. ~ A pseudo-analysis by science-denialists, which deliberately and clearly ignored the vast weight of evidence [ocean warming] and ignored the most basic physical processes [CO2/GHG effect] still going on unabated. It was a phrase which sailed very close to, but not quite over the edge of . . . damned misrepresentation. It was designed to pull the wool over the eyes of the casual reader who did not bother to think it through, and who had little climate knowledge.
And now [stated October 2017] Koonin is saying sea-level rise for the 21st Century is as yet not statistically different from earlier times. He ignores the fact that the 1940-ish SLR "bump" was a small and minor variation from the background rising trend, and was quite a different kettle of fish from the high/accelerating rise of recent decades (which has very clear causation by ongoing thermal expansion of the ocean and by large-scale ongoing melting of land-based ice sheets. And Koonin makes his statements despite having the hindsight from (late) 2017.
Such misrepresentation by Koonin (for a man of considerable scientific ability) could not be accidental or unintentional. Indeed, it is all one, with the typical science-denier strategy of continual misrepresentation of what is really happening in our physical world, in regard to AGW. Rather obviously, Koonin is wishing to imply to the casual reader, that Global Warming is non-existent or of minimal importance.
# NorrisM, there is no need for you to reply to my post here. Koonin seems to be on a long campaign of various misrepresentations . . . and I am reasonably sure there is nothing you could say to redeem his current reputation.
We should move on, to the pure science of sea-level rise where of course [re your post #265] there's a small difference of figures from satellite and tide-gauge measurements — since they are measuring two slightly different things [not different by much: but coastal measurements can never be exactly the same as "coastal + mid ocean" ].
NorrisM @265.
Indeed, you do not have it right.
I have taken the data from C&W and from NASA. For each of the two records, I have calculated linear trends through 11-years, from beginning to end of each record.
Thus the latest such trend for C&W is centred on 2008 covering the years 2003-2013. It has a trend of 4.2mm/yr. The data centred 2005-08 all yields trends above 4mm/yr and the data centred 1998-2004 yields trends 3mm/yr ot 4mm/yr. Levels of SLR above 3mm/yr are not evident on the C&W record even in a single year. Prior to this latest acceleration, only 10 years on the 134 year record managed to top 2.5mm/yr.
Your second paragraph begins "From what I have read..." and then delves again into nonsensicalnessism. What do you mean by "They can still show the same acceleration but the measurements do not coincide."?
I should perhaps add that the dip in satelite-derived SLR shown by these 11-yr OLS calculations, illustrated @258 and described @262: that dip would disappear if the suggested-but-unpublished adjustments to TOPEX are borne out. (Note the researchers were not at all happy with Nature's use of the word "SNAFU".) The adjustment removes the dip and reveals a strong acceleration as per the C&W data.
MA Rodger @ 268
By the use of the term "trend", I am assuming that you do not mean that you add the yearly increases over the period and divide by the number of years which would be the average. Is this a term in statistics? If so, could you point me to a "beginner" summary of statistics terms. I have to admit that I took one course in statistics at university but it was my least favourite subject and that was a long time ago. I get standard deviation and bell curves but suspect that "trend" is a statistical analysis and does not refer to the simple average.
As for my comment on the different rates for satellites and tide gauge, I do not think it was "nonsensical", in that Eclectic understood what I was getting at. What I was saying is that you could have two different measurments of sea level rise but the curves are parallel. Just one above the other in measurements of y axis.
[DB] Sloganeering snipped.
Eclectic @ 267
In Canadian law, we use various levels of the term "misrepresentation", moving from innocent misrepresentation to intentional misrepresentation to fraudulent misrepresentation. This last term, if proven, can put you in jail. It is the one which is equivalent to saying someone has lied.
Moderator. As I have noted before on this website, I never look at WUWT but I promise to do so on Curry's website if I ever see such a statement. If you want to point me to a recent instance on the Curry site, I am happy to go online and make the very same comment and then reference you to my comment.
I just hope everyone appreciates that someone can have questions they would like answered in the area of climate change and also think that what is happening in the US with the Republicans taking health care from millions of people to pay for their tax cuts to the rich is disgusting and raises real questions about the political process in the US. I suspect that Koonin (a Democat, I assume) is also disgusted with the Republicans on that issue. I just do not think people who have different views should be demonized. I think he has the best interests of the US public (you see I do not use the term "the American people") at heart but just has differing views of what that best interest is. I think it is perfectly acceptable for criticisms to be levelled at him as long as they do not go past what I have referred to as "intentional misrepresentation".
[DB] Off-topic snipped.
It's becoming ever more dfficult to take NorrisM seriously. Euphemisms, half-assed language and all around BS have dug their way so deep in the culture that even their chief users get tangled in the rotten semantics with which they have flooded the world.
Here is the interesting argument that a misrepresentation is better than a lie. NorrisM, in a tremendous rethorical effort, throws a little analysis of why the word lie is mean because it implies intent to deceive, then goes on to misrepresetation as if it did not imply an intent to deceive. That is really funny. NorrisM is explaining to us that it is bad to tell lies because that's the crude way to do things; misrepresentations are much better because they don't readily open one up for being exposed as a fraud. A misrepresentation is a higher skilled sort of lie, it uses better language, it's what smart liers do. Yeah, misrepresentations are much better. So are deceptions, dissimulations and all manners of devious behaviors that can't be immediately pinned down for what they are. Way to go.
To summarize recent contributions, we've heard it's bad to try to intimidate others in the same post as we received litigation threats, and that misrepresentations are much better than lies. Impressive.
And that's not even counting all the objective stuff about hard data that has been covered by other contributors, who showed that there is no doubt about what is going with Koonin. We're flogging a dead horse here. I'm done.
Lastly, this demonstrates generously why having lawyers run any kind of debate about physical reality is the worst idea. I have read enough of NorrisM contributions to see that calling it "one can have questions" is the best possible example of a misrepresentation.
NorrisM @269.
If you examine my comments above about trends, I have been using the term OLS quite frequently. The term OLS is googleable and the acronym finders that act helpfully (ie not slang, street-speek, etc) all get it at the first, the first and first attempt. Even google's top suggestion is this wikithing page. However, as you are statistic-averse, this little video will tell you all you need to know.
And parallel cirves is not an issue. Likely it would simply suggest use of differing base periods.
This just in....
New York City has plenty to worry about from sea level rise. But according to a new study by NASA researchers, it should worry specifically about two major glacier systems in Greenland’s northeast and northwest — but not so much about other parts of the vast northern ice sheet.
The research draws on a curious and counterintuitive insight that sea level researchers have emphasized in recent years: As ocean levels rise around the globe, they will not do so evenly. Rather, because of the enormous scale of the ice masses that are melting and feeding the oceans, there will be gravitational effects and even subtle effects on the crust and rotation of the Earth. This, in turn, will leave behind a particular “fingerprint” of sea level rise, depending on when and precisely which parts of Greenland or Antarctica collapse.
Now, Eric Larour, Erik Ivins and Surendra Adhikari of NASA’s Jet Propulsion Laboratory have teased out one fascinating implication of this finding: Different cities should fear the collapse of different large glaciers.
These are the melting glaciers that might someday drown your city, according to NASA by Chris Mooney, Energy & Environment, Washington Post, Nov 15, 2017
MA Rodger @ 223
Thanks. The video helped. I guess I have to spend some time understanding regression analysis (it is not the first time this has come up). Generally, it seems that what you are really trying to do is determine the slope based upon the data. It was actually another YouTube video of McLoughlin (sp) that was more helpful.