


 Arguments


Empirical evidence that humans are causing global warming
What the science says...
| Select a level... |
 Basic
Basic
|
 Intermediate
| |||
|
Less energy is escaping to space: Carbon dioxide (CO2) acts like a blanket; adding more CO2 makes the 'blanket' thicker, and humans are adding more CO2 all the time. |
|||||
Climate Myth...
There's no empirical evidence
"There is no actual evidence that carbon dioxide emissions are causing global warming. Note that computer models are just concatenations of calculations you could do on a hand-held calculator, so they are theoretical and cannot be part of any evidence." (David Evans)
At a glance
Empirical evidence? None? That's a big bold statement to make, so let's take a look. 'Empirical' is defined as something that may be actually measured and presented as a finding. Let's treat the topic as a criminal prosecution. The accused is CO2 and the accusation is that its increased levels through our emissions are warming the planet. As with all court cases, it's important to present an accurate account of events. So firstly, we'll examine the background to this particular case.
It all started in the 1820s, when French physicist Joseph Fourier had worked out that, at its distance from the Sun, Earth should be very cold. He proposed that Earth's atmosphere must contain something that kept the planet warm, like some invisible blanket. His ideas were, it turned out, correct albeit incomplete.
Some decades passed before the nature of Fourier's blanket was discovered. This was done through a series of experiments involving various gases. Interestingly, two investigators worked on it independently, John Tyndall, in the UK and Eunice Foote in the USA. Impressively, their results were virtually identical.
Foote, writing in 1856, was the first scientist to state that carbon dioxide can trap energy. She predicted that if there had been more CO2 in the atmosphere at times past, an increased temperature would have prevailed. That was something the geologists already knew. Tyndall went on to write, in 1861, that on top of carbon dioxide, hydrocarbons - such as methane - would have even greater effects at very low concentrations. The greenhouse effect and its key players had been identified.
The landmark paper, "The Carbon Dioxide Theory of Climatic Change", was published just under a hundred years later. Essentially, it stated what we know now. Without the atmosphere and its greenhouse gases, Earth would be an uninhabitable iceball. As Fourier started to reason all that time ago, greenhouse gases act like a blanket. They keep Earth warm by inhibiting the escape of energy back into space. Humans are adding CO2 to the atmosphere, mainly by burning fossil fuels, thereby intensifying the effect.
That's the background. As we emit more greenhouse gases, the effect is like wrapping yourself in a thicker blanket. Even less heat is lost. So how can we tell that? How can we find hard evidence, like good CCTV footage of our suspect up to their mischief?
How about measuring it?
Satellites orbiting our planet carry sensitive instruments on board. Through them we can measure how much energy is arriving from the Sun. We can measure how much energy is leaving the Earth, out into space. So right there we have two things to compare.
What do the measurements tell us? Over the last few decades since satellites became available, there has been a gradual decrease in the energy heading from Earth's surface back into space. Yet in the same period, the amount of energy arriving from the Sun has hardly changed at all. Something is hanging onto that energy and that something is getting stronger. That something is carbon dioxide - doing exactly as Foote and Tyndall said it would 160 plus years ago.
Verdict: guilty on all counts.
Please use this form to provide feedback about this new "At a glance" section. Read a more technical version below or dig deeper via the tabs above!
Further details
The well-established theory that man-made CO2 is causing global warming is supported as well as any chain of evidence in a rock-solid court case. CO2 keeps the Earth warmer than it would be without it. It has done so for most of geological time. Humans are adding substantial amounts of CO2 to the atmosphere, mainly by burning fossil fuels. Empirical evidence abounds to support the contention that the rising temperatures are being caused by that increasing CO2.
The Earth is wrapped in an invisible blanket
It is the Earth’s atmosphere that makes most life possible. To understand this, we can look at the moon. On the surface, the moon’s temperature during daytime can reach 100°C (212°F). At night, it can plunge to minus 173°C, or -279.4°F. In comparison, the coldest temperature on Earth was recorded in Antarctica: −89.2°C (−128.6°F). According to the WMO, the hottest was 56.7°C (134°F), measured on 10 July 1913 at Greenland Ranch (Death Valley).
Man could not survive in the temperatures on the moon, even if there was air to breathe. Humans, plants and animals can’t tolerate the extremes of temperature on Earth unless they evolve special ways to deal with the heat or the cold. Nearly all life on Earth lives in areas that are more hospitable, where temperatures are far less extreme.
Yet the Earth and the moon are virtually the same distance from the sun, so why do we experience much less heat and cold than the moon? The answer is because of our atmosphere. The moon doesn’t have one, so it is exposed to the full strength of energy coming from the sun. At night, temperatures plunge because there is no atmosphere to keep the heat in, as there is on Earth.
Without the atmospheric greenhouse effect, Earth would be approximately 33°C (59.4°F) cooler than it actually is. That would make most of the surface uninhabitable for humans. Agriculture as we know it would be more or less impossible if the average temperature was −18 °C.
Greenhouse gases act like a blanket, keeping the Earth warm by preventing some of the sun’s energy being re-radiated from Earth's warmed surface, back out into space. If we add more greenhouse gases to the atmosphere, the effect is like wrapping yourself in a thicker blanket: even less heat is lost. So how can we tell what effect CO2 is having on temperatures, and if the increase in atmospheric CO2 is really making the planet warmer?
The heat-trapping effects of CO2 and other greenhouse gases were discovered in the mid-19th century but we can do more sophisticated stuff these days. We can measure the heat energy going into Earth's climate system and that coming back out.
In 1970, NASA launched the IRIS satellite measuring infrared spectra. In 1996, the Japanese Space Agency launched the IMG satellite which recorded similar observations. Both sets of data were compared to discern any changes in outgoing radiation over the 26 year period (Harries et al. 2001). What they consistently found was a drop in outgoing radiation.
This change in outgoing radiation was consistent with theoretical expectations. Thus the Harries paper found "direct experimental evidence for a significant increase in the Earth's greenhouse effect". This result has been confirmed by subsequent papers using data from later satellites (Griggs & Harries 2004, Chen et al. 2007). In the same period, the amount of energy arriving from the sun has hardly changed at all.
When there is more energy coming in from the Sun than there is escaping back out to space, it should come as no surprise to learn that our climate is accumulating heat. The planet's total heat build up can be derived by adding up the heat content from the ocean, atmosphere, land and ice (Murphy et al. 2009). Just since 1998, the planet has accumulated heat energy equivalent to the yield of 3,260,000,000 Hiroshima-sized atomic bombs.
The primary greenhouse gases responsible for the trapping of heat – carbon dioxide (CO2), methane (CH4), water vapour, nitrous oxide and ozone – comprise around 1% of the air. The main components of the atmosphere – nitrogen and oxygen – are not greenhouse gases, because they are virtually transparent to long-wave or infrared radiation.
For our next piece of evidence, we must look at the amount of CO2 in the air. We know from bubbles of air trapped in ice cores that before the industrial revolution the amount of CO2 in the air was approximately 280 parts per million (ppm). In June 2013, the NOAA Earth System Research Laboratory in Hawaii announced that, for the first time in millions of years, the amount of CO2 in the air had gone above 400 ppm. It's now getting on for 420 ppm. That information gives us the next piece of evidence; CO2 has increased by 50% in the last 150 years.
The Smoking Gun
The final piece of evidence is ‘the smoking gun’, the proof that CO2 is causing the increase in temperature. CO2 traps energy at very specific wavelengths, while other greenhouse gases trap different wavelengths. In physics, these wavelengths can be measured using a technique called spectroscopy. Here’s an example:
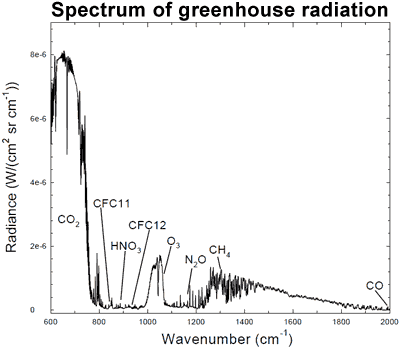
Fig. 1. Spectrum of the greenhouse radiation measured at the surface. Greenhouse effect from water vapour is filtered out, showing the contributions of other greenhouse gases (Evans et al. 2006).
The graph shows different wavelengths of energy, measured at the Earth’s surface. Among the spikes you can see energy being radiated back to Earth by ozone (O3), methane (CH4), and nitrous oxide (N20). But the spike for CO2 on the left dwarfs all the other greenhouse gases, and tells us something very important: most of the energy being trapped in the atmosphere corresponds exactly to the wavelength of energy captured by CO2.
Summing Up
Like a detective story, first you need a victim, in this case the planet Earth: more energy is remaining in the atmosphere.
Then you need a method, and ask how the energy could be made to remain. For that, you need a demonstrable mechanism by which energy can be trapped in the atmosphere, and greenhouse gases provide that mechanism.
Next, you need a ‘motive’. Why has this happened? Because CO2 has increased by nearly 50% in the last 150 years and the increase is mostly from burning fossil fuels.
And finally, the smoking gun, the evidence that proves ‘whodunit’: energy being trapped in the atmosphere corresponds exactly to the wavelengths of energy captured by CO2.
The last point is what places CO2 at the scene of the crime. The investigation by science builds up empirical evidence that proves, step by step, that man-made carbon dioxide is causing the Earth to warm up.
Finally, the myth-creator refers to climate models as "concatenations of calculations you could do on a hand-held calculator". That statement demonstrates nothing more than a limited grasp of what models are and do and is rebutted at this post in our series.
Last updated on 9 July 2023 by John Mason. View Archives


Ok I see no comment, but I would like to present some actual evidence and analysis from a completely different source than Retallack, Savory, or Sait. These two from Bill Ruddiman and Chris Sandom respectively:
THE ANTHROPOGENIC GREENHOUSE ERA BEGAN THOUSANDS OF YEARS AGO
Humans Blamed for Extinction of Mammoths, Mastodons & Giant Sloths
The interesting thing to me is that these widely separate lines of investigation, from modern agricultural practices to ancient human impacts to paleosoils all are slowly converging on the idea that soils as part of a whole ecosystem have a much larger impact on the ecosystem services than previously thought. Particularly the ecosystem services of climate control and the carbon cycle. Namely I hypothesize the AGW effects we are seeing now are actually primarily the result of multiple trophic cascades caused by the spread of mankind and then the rise of civilization. Further, I hypothesize that fossil fuel emissions are a problem primarily due to the ecosystem service of carbon sequestration into the soils was already severely damaged, first by the megafauna extinctions, and then by agriculture, both man made. These diverse lines of inquiry are not completed into a fully developed synthesis as of yet, but I am convinced this is the right track not only in better understanding the atmosperic CO2 levels, but also how to reverse them.
Red Baron @250.
Firstly I am sorry that I missed seeing your reply until now.
I must say that I am not a fan of somebody pointing me at a 20 minute U-Tube video. If somebody cannot condense their argument into something shorter (I was taught anything that doesn't fit on a side of A4) it almost always means they don't then understand the argument being presented. Sait, of course has a simple argument that has been expanded to fit the TED format. Strangely, I see nothing shorter available, rather just a longer one (that I haven't bothered with).
There is much evidence within this talk by Sait that says he is no expert. He is wrong to say that 50% of anthropogenic CO2 emissions presently end up in the oceans. It is lower, perhaps 35%. He is wrong to suggest that CO2 becomes carbonic acid in water. Most of this CO2 simply remains as absorbed CO2. (To be entirely correct, it is overwhelmingly the bicarbonate resulting from the CO2 that causes the acidity.) Acidification resulting from the additional CO2 has not reached 30%, whatever that is supposed to mean.
I do not find such errors encouraging when so much else needs to be said but which is ignored.
Sait's central assertion that 250Gt(C) has been emitted by fossil fuels (and breathing??!!!) while 467 Gt(C) has been released from humus is not supported by any evidence. Indeed, the figure from CIDAC give FF emissions to 2010 as 365 Gt(C) with roughly 50% extra from changing land use (ie 185 Gt(C)) according to Houghton et al (2012) which mostly is accounted by deforestation. Thus CO2 emissions to 2010 not involving humus are considered to amount to 550 Gt(C), over twice the figure asserted by Sait. He offers not support for his assertion. Until he does, his words remain unconvincing. These talks by Sait are a bit old now. The continued silence is very telling.
MA Rodger,
Are you including the ~300 GtC emissions before 1850 that Ruddiman discusses or the lack of decline added on even to that seen in previous glacial cycles?
RedBaron @254.
The references I linked to @253 consider FF emissions from 1751-2010 and "The contribution of LULCC to anthropogenic carbon emissions were about 33% of total emissions over the last 150yr (Houghton, 1999)". So, no, the emissions argued by Bill Ridduman are not included.
MA Rodger,
Would it be fair to say that if you skip the emissions caused by the loss of ecosystem services, it would then bias your analysis of what could be done by restoring ecosystem services? After all, if your main focus is fossil fuel emissions, then the main focus for mitigation would also be fossil fuel emissions. The whole effect of soil sequestration of CO2 glaringly omitted both as a major cause and as a potential major mitigation strategy.
Now don't get me wrong. I am hugely in favor of alternative energy. At some point that will have to happen anyway, but the more pressing issue is restoring ecosystem services to about 1/2 the planet's land surface. It is the only possible strategy with any hope at all of working. Even going to 0% emissions tomorrow by the entire world will not reverse AGW for hundreds if not thousands of years......unless the ecosystems capability to sequester that carbon is restored. Even more importantly, that ecosystem service is potentially large enough to mitigate fossil fuel emissions even without taking them to 0%.
I'll just point out, that the notion of 'reversing' climate change doesn't really make sense anyway. What matters is limiting the rate of change. Once it has changed, it's changed, and the bits of the ecosystem/society that can't adapt will break. At that point, there probably isn't that much to gain by trying to force the ppm back down (not that that seems plausible right now).
RedBaron @255.
So we are effectively back to your input @217.
But the evidence you have provided for soils being the overwhelming source of CO2 emissions, right from the start with a National Geopgraphic article, all the way to here and now, is wholly insufficient to support your radical assertions. Of your most recent citations @250, Ruddiman is silent on this and the LiveScience article ditto. @249, Sait makes only unsupported assertions. I did not find anything worthy of further consideration with Retallack or Teague or Savoury. Indeed, @247 I concluded "I see no evidence that Houghton and others are in error over CO2 emissions from land use." Nothing has changed. There is no evidence to suggest soils are a major CO2 source, let alone being the major source as you are arguing.
MA Rodger and Tristan,
Both of you are correct, but only if that ~300 GtC emissions pior to 1850 that Ruddiman discusses[1] is not included. The Retallack paleosoil evidence[2] even adds a causal relationship as opposed to simple correlation. The Teague evidence [3] confirming both the ecosystem services and pointing one way that information can be put to use for mitigation.[4]
Just to sum up, the biggest mistake is in ignoring the soils[5], both as a cause and as a solution.
[JH] You are now skating on the thin ice of excessive repitition which is prohibited by the SkS Comments Policy.
Please note that posting comments here at SkS is a privilege, not a right. This privilege can be rescinded if the posting individual treats adherence to the Comments Policy as optional, rather than the mandatory condition of participating in this online forum.
Please take the time to review the policy and ensure future comments are in full compliance with it. Thanks for your understanding and compliance in this matter.
RedBaron, any theory that tries to explain the net increase in CO2 from soil degradation also needs to explain the carbon isotope D13 and D14 ratios in the atmosphere which fit accurately with fossil fuel source (eg see here and here which also accounts for spatial distribution).
Scaddenp,
Please keep in mind that I am making a clear distinction between "recalcitrant" SOM and "labile" SOM. The SOM isotope profile in the O-horizon is not much different than that found in living vegetation, having a turnover in the carbon cycle measured usually in decades or less and never much more than a couple hundred years unless locked in permafrost. The SOM deep in the A-horizon is very different, often lasting for millenia in a very stable form (unless disturbed), and has a very similar isotope profile as fossil fuels.
It may have C13 profile that is closer to FF, but I fail to see how even soils from several millenia can have same C14 profile (ie zero) as FF. Are you implying that mass numbers quoted by you so far are only for for deep SOC? (I dont think so) and what evidence you have that there is a substantial contribution of deep soil carbon (the hardest to lose). I would also be interested in your response to points made by Tom.
@scaddenp
The half-life of carbon-14 is 5,730±40 years. Any SOM older than 5,730±40 years to the end of the last glaciation period would have a C-14 at 50%-75% similar to Fossil fuels. But that's not the whole story, carbon-14 occurs in trace amounts, i.e., making up about 1 part per trillion (0.0000000001%) of the carbon in the atmosphere. Certainly measurable locked in a biological source, but very difficult to distinguish the difference between a stable humus source 50-70% similar to a fossil fuel source having been released into the atmosphere and mixed together. Both will dillute atmospheric C-14 levels, and both have dilluted atmospheric C-14 levels. But that deep SOM largely wasn't released in huge amounts before the industrial age and the spread of the John Deer Plow pulled by tractors and haber process nitrogen fertilizers, disturbing far more acreage far deeper than any previous agricultural practices. That's the key to the puzzle too. The signature is largely hidden in the fossil fuel signature. Very easy to overlook by anyone studying the atmosphere. Mostly the knowledge of this release has been discovered by soil scientists and agricultural scientists (and the quite rare paleosoil scientist like Retallack). Previous to the industrial age the released C-14 isotope ratio from agriculture would have blended in far closer to the O-horizon short term carbon cycle. So it follows the same hockey stick, as they are closely related.
The important thing to note when discussing the Ruddiman hypothesis is his admitted "fatal flaw". He fully admits that the so called "tortoise carbon release" measured is actually larger than his projected effects from human agriculture. Instead of following the concave curve of population growth (and thus the extent of agriculture in populations using agriculture), the release is far larger, earlier and more convex shaped. Ruddiman's "fatal flaw" though is resolved by by factoring in the evidence from Retallack and Sandom. ie the effect the extirpation and extinction of the megafauna by man and the effect that had on the grasslands ecosystems, all of which preceeded agriculture.
In addressing Tom as you requested: In general I have no problems with his rebuttal actually. His arguments are generally sound and I accept his sources. Excepting his measurements include highly degraded ecosystems found now and not even close to what they were before human impact. Not allowing for that change is where his rebuttal fails to actually disprove soil source for AGW hypothesis. In discussing Ruddiman, Tom fails to acknowledge the "fatal flaw" in Ruddiman's hypothesis, unlike Ruddiman himself. Tom actually uses the "fatal flaw" to argue against Teague! Instead of using them to counter each other, it is far better to combine their separate lines of inquiry, each explaining the flaws still present in the other when viewed alone. The evidence and context of all the sources combined into a new systems science synthesis paints a much clearer picture. That is the synthesis I am trying to get at here.
Do the Albedo Changes in Greenland constitute evidence?
[JH] Image reduced to conform with SkS guidelines.
Red Baron @262:
First, it is not at all clear that the "extirpation and extinction" of megafauna would result in significant carbon emissions. In particular, while it may result in reduced bioturbation at depth, that would merely result in existing carbon being left at depth, rather than it being brought to the surface. It is only where that is coupled with significant erosion and/or desertification that it would potentially lead to emissions, and that is not typically the case.
The most noted desertification, ie, the Sahara, was brought about by changes in rainfall, not by the extinction of megafauna (which were not, in general, driven extinct in Africa) and hence does not fit your model. Come to that, neither does North America (where the survival of bison maintained the lush grasslands you consider so important), nor Australia, which has always lacked hoofed grazers until Europeans brought cattle.
Second, and most importantly, any emissions from soil due to the "extirpation and extinction" of megafauna is already included in Ruddiman's estimations due to the associated C13 signal. Ergo it was taken into account by my tabulation.
Third, whatever the effect of the "extirpation and extinction" of megafauna (or whatever other combination of factors caused the early holocene carbon emissions, ie, Ruddiman's fatal flaw), they occured before the nineteenth century agricultural revolution. Ergo the emissions consequent of that revolution come from the (according to you) already depleted reservoir. Therefore there did not exist the potential in the nineteenth century for the agricultural revolution to cause a hockey stick in emissions. Put another way, if we accept your argument about depletion, it gives us no reason to question Houghton's figures Houghton's estimates are for LUC emissions from (according to you) already depleted soils.
Finally, my critique of Teague's argument about sequestration used the sum of Houghton and Ruddiman's figures, thereby accounting for all LUC over the entire Hollocene. It, therefore, represents the only basis against which to check Teague's claims. You may certainly speculate that Ruddiman got his figures wrong because Teague is (somehow) infallible, but you are then no longer basing your estimates on data, only wishful thinking.
Red Baron @262:
In other words, where fossil fuels are 100% depleted in C14, soils are around 75% or less depleted in C14. Put another way, to deplete tropospheric C14 by the same amount, you need 33% more soil carbon than you would fossil fuel carbon. That, however, means you are also depleting C13 in the troposphere 33% faster. That means that if you assume significantly more soil carbon emissions over the last 150 years, you rapidly get a measurable mismatch in the isotope ratios.
That does not mean there is not room for some more soil carbon in the mix. The carbon model predictions are very close to observations, but not perfect, and they have error margins. Therefore it is open for you to show for some potential increase soil emissions, they better match the observations, or match them as well as current estimates. Until you actually do that, however, we have no reason to accept your theory. Just waving your hands is not a scientific argument.
Indeed, given the current accuracy of the models, we can already preclude the possibility that the majority of the emissions hockey stick is from soil carbon rather than from fossil fuels and cement.
RedBaron, setting aside the (equally valid) arguments based on carbon isotope levels and lower land use estimates from other sources... I'm having a temporal causality problem with your position that AGW is largely driven by "~300 GtC emissions pior to 1850".
If that were the case, wouldn't atmospheric CO2 levels have risen significantly from those emissions prior to 1850? Yet the "CO2 emissions vs Atmospheric CO2 levels" graph in the main article above shows that atmospheric levels were nearly flat through 1850... increasing significantly only after fossil fuel emissions rose greatly.
Basically, it seems like you are looking at various estimates of total CO2 emissions from different sources and saying, 'Aha, this estimate over here puts a large total on ancient land use emissions... that is the cause!' without considering the timing. How could all of the CO2 emissions from land use prior to 1850 'hide out' and avoid raising atmospheric CO2 levels until after large scale burning of fossil fuels began?
@CBDunkerson,
Flat when it should be dropping is significant. I have tried to get at the flaw from both angles, the emissions and the mitigation. In simple abstract terms.... moving from -3 to +3 is not moving 3..it is moving 6. The emissions are not the whole story when discussing biome effects. Sure in discussing fossil fuel emissions you can simply measure the CO2 released because FF are so slowly formed that it approaches 0 in our timeframe. But when you talk about emissions from the soil due to ecosystem degradation, you must include both the emissions and the carbon that would have been sequestered if the ecosystem hadn't been degraded and add them together. Essentially what we have done by degrading the terrestrial biomes of the planet is to damage the capabilty for the ecosystems to moderate the excess carbon produced by fossil fuels. In no way am I denying the fossil fuel emissions. Instead I am pointing out the loss of the ecosystem service of carbon sequestration found naturally in healthy ecosystems.
So please don't confuse what I am saying with climate deniers arguments. I am actually saying that AGW is roughly twice as bad as the arguments presented on this forum. Fortunately though that is potentially a good thing because it also means that restoring the ecosystem function will likely have a much greater effect than projected here as well.
Please go back to post #258 and look at reference #5 soil degradation map. That whole area with degraded soils is either currently + emissions sources or has been +emissions sources since distubance by Man. Yet most of that area should have been a carbon sequestration sink over that same period. In the case of grasslands a very large sequestration sink. In the case of forests a smaller sequestration sink, but in both cases a sink not a source. So you must add the two together.
That is my explanation as to why in the Ruddiman (citation on post #251) graphs figure 1 and figure 2 the curve deviates from its downward trend and flattens. Next comes fossil fuels, and lacking the ecosystems ability to sequester carbon, the atmosphere instead begins to become saturated with excess CO2. Thus in reality the hockey stick is actually a result of ecosystem services loss rather than fossil fuel emissions alone, my original premise.
Got it. A smaller 'global carbon sink' has resulted in greater atmospheric CO2 from fossil fuel emissions than would have existed otherwise.
However, wouldn't the slowly degrading carbon sink have resulted in atmospheric increases from the natural emissions cycle? That is, assuming natural emissions and sinks were roughly in balance (otherwise atmospheric levels would have been changing) wouldn't human degradation of the natural carbon sinks have resulted in rising atmospheric CO2 levels? The only way I can see to avoid this would be if natural emissions somehow declined at essentially the same rate as natural sinks. That's possible, but would need to be demonstrated.
Meanwhile, the problems with carbon isotope levels and vastly different estimates from other studies remain.
CBDunkerson,
If Greg Retallack's research and interpretation of the paleobotany and paleosols evidence is correct, and the unidirectional, stepwise, long-term climatic cooling, drying, and climatic instability was driven by the coevolution of grasses and grazers, then the loss of the megafauna and desertification that followed over large areas would have tended to force the stability of CO2 levels near where they were when that loss occurred. His hypothesis is therefore very consistent with Ruddiman and in fact helps explain the evidence Ruddiman falls somewhat short. (His so called "fatal flaw"). ie. Reducing the primary driver of climatic cooling wouldn't necessarily drive warming (depending on the degree), but it would tend to halt carbon sequestration and stop cooling. Then as other new anthropogenic drivers of warming are added to the biosphere (CO2, CH4), the ability to buffer that is also reduced. And yes the measured CO2 and CH4 levels seen in Ruddiman et al. roughly follow those trends. For this reason, Retallack's work supports and more fully explains Ruddiman. Neither works successfully explain the measured evidence alone, but combined they are quite close. Also since the loss of part of the grassland/grazer biome and early preindustrial agriculture would tend to result in carbon loss from the soil in a shallow top down manner (younger carbon), while industrial agriculture with it's turning over of deeper soil exposing older carbon more similar to fossil fuels in isotopes, it would seem to me that the isotope signal would likely very easily get lost in the "noise" of industrial fossil fuel use. I wouldn't say they are "vastly different" at all. I would suggest that this needs to be addressed by someone with that expertise though. My research is soils and agricultural systems, not atmospheric isotopes. It would help though if you explained exactly where you think these estimates are "vastly different".
RedBAron @267 says "Please go back to post #258..."
Myself, I haven't left #258. The first part of #258 is telling us that the initial assertion made by RedBaron @217 is now defunct. If it is said of Tristan & I "Both of you are correct, but only if that ~300 GtC emissions pior to 1850 that Ruddiman discusses is not included," then the wild assertion that "The hocky stick isn't fossil fuel emissions, it's agricultural degradation of the soils, particularly carbon." - that original assertion is dead.
We are then left with the ~300GtC of Bill Ruddiman. Yet this is a lot of carbon to be released by a small population. Yes the release is 30x slower (which is why they are so large yet only achieve a 25ppm CO2 rise), but the late stone-age human population can only have been a few millions, probably 1,000x smaller than today. So these vigorous ancestors, without access to any of today's 4x4s or Boeings manages 30x our present CO2 emissions per capita.
Don't get me wrong. I am not wholly dismissive of such a prospect. A single match can release a whole lot of CO2 from the countryside round here during dry spells, mainly during the school holidays. So without a fire brigade to dowse down the heathland, with big dry wilderness forests that could perhaps be converted into greater productivity with the timely application of fire-stick/tinder-box, a pre-historic society could potentially release great quantities of CO2 from the eco-system.
Further, Ruddiman's ~320GtC includes feedbacks (presumably) as the warming resulting from higher CO2 prevents CO2 absorption in an otherwise cooling climate. Halving the size of these proposed early anthropogenic emissions may well assist in getting the sums to add up.
But what is difficult to countenence is that late stone-age man's activities resulted in massive CO2 emissions from deep in the soil, this being the apparent contention of RedBaron @258. The predation of mega-fauna to their extinction - how does that release CO2? Converting significant parts of the steppe into the High Chaparral is well beyond the available technology or manpower. Plough-cultivation - ditto. The only mechanism that occurs to me is the trashing of vast swathes of land resulting in soil errosion, not the most sustainable of activities for communities reliant on that land. Yet such levels of trashed soils would leave obvious marks beyond atmospheric CO2. So is there such supporting evidence?
And it must not be forgotten that all this blather is based on the interesting but still speculative work of Bill Ruddiman.
@234 I argued that RedBaron was conflating three separate controversial assertions. Ruddiman makes that four. The fifth appeared @267. Now it it is being argued that the rise in CO2 is not directly from the soils but from FF yet the atmospheric CO2 increase also required the degradation of soils. If this was the"orignial premise" it was woefully described until now, and indeed the mechanism remains unexplained and without an evidential basis.
MA Rodger @270, Ruddiman's hypothesis is that approx 320 GtC was released by humans over the approximately 10 thousand years prior to 1750. That works out at emission rates of 0.032 GtC per annum, or 0.015 ppmv per annum if it all accumulated in the atmosphere. Of course, most of it went into the oceans. Far more than the amount expected from current airbourne fractions because there is time for equilibriation with the deep ocean, and also take up of excess CO2 by chemical buffering in the ocean, and chemical weathering. Consequently the increase in atmospheric concentratin is less than 13% of the emissions (with further emissions of natural origin also contributing). In any event, the average annual emissions amount to 1 thousandth of current values. Given that the global population (approx 5 million) was about 1 thousandth (rising to about 1 seventh by 1750). Ergo their emissions per capita are on average less than today, not thirty times greater.
Tom Curtis @271.
Thank you for spotting something was awry. I did drop a decimal point somewhere. But I still come out with larger ancient per capita emissions.
I think you can compare the two periods in a lot of different ways. I note that if the average emissions is used and the population calculated using the average of start & end population, you get a remarkably similar figure for the two periods.
I was specifically comparing the start of the first period 5,500BC with today. We seem happy with the 1000:1 ratio of population. Today's emissions are well defined c10GtC/y. Taking the 0.032GtC/y for the start period, and the data suggests these emissions were achieved from the off, the per capita ratio is 3.2:1.
I stand corrected that the ~320GtC applies to a proposal of actual emissions not including absented feedbacks.
RedBaron continues to make his discussion uninteresting by his refusal to grapple with the evidence. This is noteworthy in his dismissal of the isotope evidence (which is sufficient to refute his thesis) on the grounds that he has not examined the issue and he will have to wait till "somebody expert" examines the issue. Given that clearly unscientific attitude, there is little point of any discussion with him. Despite that, I will add yet another distinct line of evidence refuting his claims.
Specifically, consider the reduction in atmospheric oxygen concentration over time in relation to the increase in CO2 concentration over time:
As we would expect, combustion of fossil fuels results in Carbon combining with Oxygen to produce Carbon Dioxide, thereby decreasing the O2 and increasing the CO2. Naively we might expect O2 to decline equally with the increase in CO2 when we burn fossil fuels. While that is true enough for Coal, however, natural gas (CH4) and petrol also produce water as combustion products, decreasing the oxygen concentration further. In general, for each molecule of CO2 produced by combustion, two molecules of H2O will be produced from methane, and slightly over one molecule of H2O will be produced by the combustion of oil products. Because these ratios are known, and the consumpton of various fossil fuels are also well known, it is possible to calculate the expect loss of O2 relative to the expected gain in CO2 with relative accuracy.
Further, the ocean uptake of CO2 is also relatively well known, both by direct measurements of increases in Dissolved Inorganic Carbon, and by changes in the C13/C12 isotope ratios. Ocean uptake, of course, involves no reduction in atmospheric oxygen.
Finally, the actual decrease in O2 and increase in CO2 is well known from observations.
Having constrained the well known values, we then place severe constraints on the poorly known values. Of these, Oxygen outgassing by the ocean involves no change in CO2 concentration, and is very small. So small it is often neglected. The last value, net land uptake combines the effects of both photosynthesis (producing one O2 for each CO2 drawn from the atmosphere) or respiration/combustion which reverses the process. The important thing is that because the other constraints are well known (or near negligible), it is known with certainty that the net effect of land interaction with CO2, including land uptake plus CO2 emissions from Land Use Change is a reduction in the amount of CO2 in the atmosphere, at least over recent decades.
It follows for RedBaron's thesis that any underestimate of LUC emissions such as he is arguing for must be matched by an increase in photosynthesis compensating for the underestimte almost exactly. Ergo, whatever the merits of RedBaron's thesis that CO2 emissions from LUC are greater than current estimates, it has no consequence at all for net emissions, because the O2 evidence shows that CO2 fertilization, increased rainfall, NH reforestation and the green revolution combined result in the fixing of more CO2 than is emitted by LUC, whatever the estimate of LUC emmissions happens to be.
@Tom,
You said, "it is known with certainty that the net effect of land interaction with CO2, including land uptake plus CO2 emissions from Land Use Change is a reduction in the amount of CO2 in the atmosphere, at least over recent decades."
I am glad you mentioned that actually. It in fact is the evidence of your error, but doubtful you are knowledgeable enough of other fields to understand this.
Temperate rainforests used to exist on almost every continent in the world, but today only 50 percent — 75 million acres — of these forests remain worldwide. Originally, 6 million square miles of tropical rainforest existed worldwide. But as a result of deforestation, only 2.4 million square miles remain. Between 2000 and 2012, 0.9 million square miles of forests around the world were cut down. That's roughly the size of all of the states in the U.S. east of the Mississippi River. Only 0.3 million square miles were replanted. There are only only four remaining intact temperate grasslands in the world and they are greatly reduced in size. For example the North American tallgrass prairie for all practical purposes is completely gone. About 5,000 years ago the great northern grasslands died out when humans exterminated the majority of the megafauna in the northern hemisphere, replaced now with boreal forest with shallow roots due to the thin soils. (luckily they can form peat at least) Most the grasslands of Austrailia that started desertifying 50,000 years ago due to the human eradication of Australia's megafauna were surveyed in the 1840's with many still containing deep A-horizons of 6%-20% SOM are now almost completely finished desertifying and contain usually around <1% SOM. The farmers of Australia now farm on sub-soil (B-horizon) as excepting a small band of tropical rainforest remaining, nearly all the top soil is now gone. China's Leoss plateau was completely destroyed (although now part of the largest ecosystem restorion project in the world) Green revolution agriculture is a carbon emissions source.
With all this and more ecosystem destruction world wide, the very few reminant functioning ecosystems left were still capable of making the entire terrestrial biosphere taken as a whole a net sink, at least over recent decades. Exactly like you said. But of course the ecological sink is far too small to actually counter Fossil Fuel emissions in its current degraded state. However the principle of the effect ecosystem services being capable of moderating atmospheric CO2 is proven by the very thing you mentioned. And inversly, the fact that human impact has largely destroyed that capability worldwide explains the hockey stick.
RedBaron @274, if, as you suggest, LUC was responsible for the hockey stick in CO2 emissions, except for the last two decades when LUC plus land absorption became a net sink, there would have been a marked decrease in the rate of increase of CO2 concentration over those last two decades. You, however, take evidence that over the last two decades LUC plus land absorption was a net sink as proof that LUC plus land absorption was a net source that overwhelmed fossil fuel emissions in preceding decades, and then seemlessly converted to a sink with no alteration in the trend in CO2 concentration. Such a large change from source to sink should also be visible in the isotope data, and also in the relationship between CO2 concentrations and the integral of fossil fuel emissions:
Evidently your "rebutal" of the O2 evidence depends entirely on ignoring the other available evidence. This is on top of your startling rebutal of the isotope evidence of "I just won't look at it, and will not accept anybody who does look at it has sufficient knowledge to determine that the evidence rebuts my theory". I think at this stage we can appropriately call your theory the invisible gardener theory of global warming. We can also appropriately note that there is no point discussing evidence with anybody who conspicuously refuses to note any evidence contrary to his theory (which has been shown to not be supported by your sources, to contradict isotope evidence extending back to well before the preindustrial, and to contradict exact evidence from the last two decades).