Climate Science Glossary

Term Lookup

Enter a term in the search box to find its definition.

Settings

Use the controls in the far right panel to increase or decrease the number of terms automatically displayed (or to completely turn that feature off).

Term Lookup

Settings


All IPCC definitions taken from Climate Change 2007: The Physical Science Basis. Working Group I Contribution to the Fourth Assessment Report of the Intergovernmental Panel on Climate Change, Annex I, Glossary, pp. 941-954. Cambridge University Press.

Home Arguments Software Resources Comments The Consensus Project Translations About Support

Twitter Facebook YouTube Mastodon MeWe

RSS Posts RSS Comments Email Subscribe


Climate's changed before
It's the sun
It's not bad
There is no consensus
It's cooling
Models are unreliable
Temp record is unreliable
Animals and plants can adapt
It hasn't warmed since 1998
Antarctica is gaining ice
View All Arguments...


Username
Password
New? Register here
Forgot your password?

Latest Posts

Archives

What does past climate change tell us about global warming?

What the science says...

Select a level... Basic Intermediate

Greenhouse gasses, principally CO2, have controlled most ancient climate changes. This time around humans are the cause, mainly by our CO2 emissions.

Climate Myth...

Climate's changed before

Climate is always changing. We have had ice ages and warmer periods when alligators were found in Spitzbergen. Ice ages have occurred in a hundred thousand year cycle for the last 700 thousand years, and there have been previous periods that appear to have been warmer than the present despite CO2 levels being lower than they are now. More recently, we have had the medieval warm period and the little ice age. (Richard Lindzen)

At a glance

Just imagine for a moment. You fancy having a picnic tomorrow, or you're a farmer needing a dry day to harvest a ripe crop. So naturally, you tune in for a weather-forecast. But what you get is:

“Here is the weather forecast. There will be weather today and tomorrow. Good morning.”

That's a fat lot of use, isn't it? The same applies to, “the climate's changed before”. It's a useless statement. Why? Because it omits details. It doesn't tell you what happened.

Climate has indeed changed in the past with various impacts depending on the speed and type of that change. Such results have included everything from slow changes to ecosystems over millions of years - through to sudden mass-extinctions. Rapid climate change, of the type we're causing through our enormous carbon dioxide emissions, falls into the very dangerous camp. That's because the faster the change, the harder it is for nature to cope. We are part of nature so if it goes down, it takes us with it.

So anyone who dismissively tells you, “the climate has always changed”, either does not know what they are talking about or they are deliberately trying to mislead you.

Please use this form to provide feedback about this new "At a glance" section. Read a more technical version below or dig deeper via the tabs above!


Further Details

Past changes in climate, for which hard evidence is preserved throughout the geological record, have had a number of drivers usually acting in combination. Plate tectonics and volcanism, perturbations in Earth's slow carbon cycle and cyclic changes in Earth's orbit have all played their part. The orbital changes, described by the Milankovitch Cycles, are sufficient to initiate the flips from glacials (when ice-sheets spread over much of Northern Europe and the North American continent) to interglacials (conditions like the past few thousand years) and back  – but only with assistance from other climate feedbacks.

The key driver that forces the climate from Hothouse to Icehouse and back is instead the slow carbon cycle. The slow carbon cycle can be regarded as Earth's thermostat. It involves the movement of carbon between vast geological reservoirs and Earth's atmosphere. Reservoirs include the fossil fuels (coal/oil/gas) and limestone (made up of calcium carbonate). They can store the carbon safely over tens of millions of years or more. But such storage systems can be disturbed.

Carbon can be released from such geological reservoirs by a variety of processes. If rocks are uplifted to form mountain ranges, erosion occurs and the rocks are broken down. Metamorphism – changes inflicted on rocks due to high temperatures and pressures – causes some minerals to chemically break down. New minerals are formed but the carbon may be released. Plate tectonic movements are also associated with volcanism that releases carbon from deep inside Earth's mantle. Today it is estimated by the U.S. Geological Survey that the world's volcanoes release between 180 and 440 million tonnes of carbon dioxide per year - as opposed to the ~35 billion tonnes we release.

Epic carbon releases in the geological past

An extreme carbon-releasing mechanism can occur when magma invades a sedimentary basin containing extensive deposits of fossil fuels. Fortunately, this is an infrequent phenomenon. But it has nevertheless happened at times, including an episode 250 million years ago at the end of the Permian Period. In what is now known as Siberia, a vast volcanic plumbing-system became established, within a large sedimentary basin. Strata spanning hundreds of millions of years filled that basin, including many large coal, oil, gas and salt deposits. The copious rising magma encountered these deposits and quite literally cooked them (fig. 1).

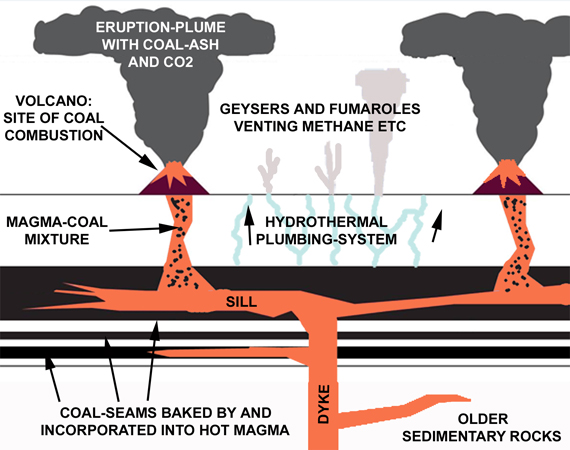
Fig. 1: schematic cross section though just a part of the Siberian Traps Large Igneous Province, showing what science has determined was going on back then, at the end of the Permian Period.

Now laden with a heavy payload of gases, boiled out of the fossil fuel deposits, some of the magma carried on up to the surface to be erupted on a massive scale. The eruptions – volcanism on a scale Mankind has never witnessed - produced lavas that cover an area hundreds of kilometres across. Known as the Siberian Traps, because of the distinctive stepped landforms produced by the multiple flows, it has been calculated that the eruptions produced at least three million cubic kilometres of volcanic products. Just for a moment think of Mount St Helens and its cataclysmic May 1980 eruption, captured on film. How many cubic kilometres with that one? Less than ten.

Recently, geologists working in this part of Siberia have found and documented numerous masses of part-combusted coal entrapped in the lavas (Elkins-Tanton et al. 2020; fig. 2). In the same district are abundant mineral deposits formed in large pipes of shattered rock as the boiling waters and gases were driven upwards by the heat from the magma.

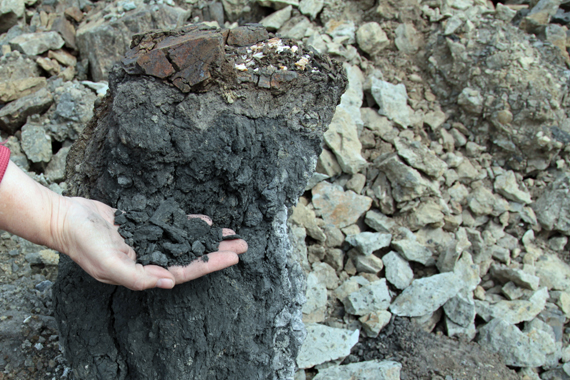
Fig. 2: an end-Permian smoking gun? One of countless masses of part-combusted coal enclosed by basalt of the Siberian Traps. Photo: Scott Simper, courtesy of Lindy Elkins-Tanton.

It has been calculated that as a consequence of the Siberian Traps eruptions, between ten trillion and one hundred trillion tons of carbon dioxide were released to the atmosphere over just a few tens of thousands of years. The estimated CO2 emission-rate ranges between 500 and 5000 billion tonnes per century. Pollution from the Siberian Traps eruptions caused rapid global warming and the greatest mass-extinction in the fossil record (Burgess et al, 2017). There are multiple lines of hard geological evidence to support that statement.

We simply break into those ancient carbon reservoirs via opencast or underground mines and oil/gas wells. Through such infrastructure, the ancient carbon is extracted and burned. At what rate? Our current carbon dioxide emissions are not dissimilar to the estimated range for the Siberian Traps eruptions, at more than 3,000 billion tons per century. The warning could not be more clear. Those telling you the climate's changed before are omitting the critical bit – the details. And when you look at the details, it's not always a pretty sight.

Last updated on 14 February 2023 by John Mason. View Archives

Printable Version  |  Offline PDF Version  |  Link to this page

Argument Feedback

Please use this form to let us know about suggested updates to this rebuttal.

Related Arguments

Myth Deconstruction

Related resource: Myth Deconstruction as animated GIF

MD Past

Please check the related blog post for background information about this graphics resource.

Further reading

RealClimate article published by Prof. Stefan Rahmstorf on July 20, 2017:

The climate has always changed. What do you conclude?

Comments

Prev  1  2  3  4  5  6  7  8  9  10  11  12  13  14  15  16  17  18  19  20  Next

Comments 251 to 275 out of 553:

  1. 250, lancelot, To clarify, however, the references to clouds in the AR4 do not give any credence whatsoever to the idea that changes in cloud cover are responsible for the modern warming trend. This is in no way believed or expressed. The references to clouds in AR4 pertain explicitly to positive feedbacks and climate sensitivity, i.e. given warming X from CO2, how much additional warming Y will be added to that from clouds. AR4 (and scientists) are very upfront about admitting to this area of doubt in predictions, and adjusting error bars appropriately. But the admission is one of mere prudence and honesty, and part of the reason that the currently accepted range of climate sensitivity is between 2˚C and 4.5˚C per doubling of CO2. Part of the reason for that wide range (2.5˚C total) is due to uncertainties about the effects of warming on clouds, and the corresponding effects of changed clouds on warming (although there are other factors, too).
  2. 250, lancelot, Measuring energy received at the surface may seem straightforward, but as I said before, it is most certainly not. You must account for: 1) Local, low lying and potentially transient effects (smog, fog) 2) Coverage... how do you do it on the oceans, which cover 70% of the earth? Deserts? Inhospitable countries? 3) Altitude... radiation will be higher for measurements taken at higher altitudes 4) The past? How do you know what happened before you get your network set up? To what do you compare your new values? All of the problems that plague the observational surface temperature record apply as well to measuring sunlight. It's just not as easy as it sounds, especially when a satellite can do that and more for less money with less effort and more consistency.
  3. 250, lancelot, I mentioned aerosols because your point is not about cloud forcing (whether you realize it or not), but about total solar radiation received at the surface. You are presuming that cloud cover changes are a possible and likely cause (less clouds = more sunlight = more warming). You are then taking it a step further and saying that well, okay, it may not be GCRs, but maybe it's something else. That's magical thinking. That's hoping to find a cause, and then after the fact looking for a cause of the cause. More to the point, I included aerosols because they can have the same effect as clouds, by reflecting incoming sunlight. Indeed, Hansen proposes this for a reason that warming is not as great as it should be. It's also a reason that the loss of the Glory satellite was a big blow to advancing climate science. But a decrease in such reflective aerosols (due, for instance, to improved pollution controls) could in the same way raise temperatures. Aerosols (depending on the type) can also have the opposite effect, by absorbing more sunlight and increasing warming, so an increase in such aerosols could warm the earth. The point is that scientists are not stupid. They are looking at all of these things and giving them their due. On micro-organisms, stony silence and kindness concerning stupidity... ummm, sorry, sort of. When you mentioned it I did look into it, and there do seem to be some very, very interesting papers on the subject of micro-organisms and their impact on cloud formation. But I honestly didn't think for a moment you were serious about it. But... while this is an area of interest to the scientists working on it, as of now: a) There is no strong, well-defined or reasonably serious mechanism that turns micro-organisms into a major player in changes in cloud formation in the last 30 years. b) More importantly, no change in micro-organisms has been identified or even proposed that would suggest that something has happened in the last 30 years to trigger warming. Again, it's a case of hunting for an alternate cause when there is no reason to do so, and then in turn still needing to find a cause of the cause. Could it be clouds? We have no reason whatsoever to think so (and don't think scientists have not been measuring cloud cover, they have). Could it be clouds caused by micro organisms? We have no reason whatsoever to think so. Could it be clouds caused by falling fairy wings, as a result of an unexpected increase in the desiduous-winged fairy population? We have no reason whatsoever to think so. [Sorry if that last sounded snarky. It wasn't meant to be. It was meant instead to show that science must work by going from observation to hypothesis to experiment to confirmation/refutation. And can not work simply through "but what if..." followed by any and every idea that anyone could consider, simply because they don't like the ideas that we do have, for which we have evidence, and which logically and consistently explain the entire picture without the addition of fairy wings.]
  4. Lancelot -" Is that because readers are much too kind to lambast me for my stupidity in thinking that the airborne biosphere might(repeat might!) have a part to play in climate?" There is a considerable literature on the biogenic aerosol effect (naturally-occurring particles such as pollen, sea salt, leaf fragments etc seeding cloud formation). I've read a lot of papers on aerosol formation in the Amazon rainforest region, for starters. What is it you think they (biogenic aerosols) are doing? And how do you come to the conclusion the IPCC doesn't know about the published scientific literature?
  5. Tom Curtis 243; Could I add: You wrote: "More importantly, it is far from clear that this is a global phenomenon. Certainly in China the trend has been in the opposite direction towards less sunlight hours. A similar reduction of sunshine has been found in Switzerland, so the observed increase in the UK is not even a Europe wide phenomenon, let alone a world wide phenomenon." The Swiss study abstract quotes "general decrease of sunshine duration through to the mid 1980's". That doesn't seem so far off from the general decrease to around 1979-83 on the Met Office chart. (Just eyeballing here). Some data divergence perhaps due to varying definition of 'sunshine' measurement? So perhaps some common ground UK-Swiss? In China one would expect a decrease in net irradiance received due to aerosols. I will have to take your word that the paper describes a decrease in actual sunlight hours since 1974, as I don't have access to it. DB: Wow!- thanks for the Wild 2009 copy, really kind of you.
  6. Ah, page 6 now.. apologies for missing the latest posts when I wrote 255. Sphaerica, I am not trying to put down scientists, and I am sure you have even thought about fairies! But I have not been able to find any consideration of micro-organisms/clouds in the IPCC reports, and there are some interesting papers on the subject, such as http://www.wired.com/wiredscience/2011/05/microbes-make-rain/ Hence my question. I note the difficulties with making ground level (or sea level) measurements. Thanks again.
  7. 256, lancelot, No worries! I appreciate the interest in the science! The main point is that the science now is all about microbes and potential impacts on cloud formation, but there are no signs whatsoever that this translates into any effect on global climate, let alone a non-negligible warming effect related to current climate change. That's just a big leap, that isn't warranted by the state of the literature. From the article you linked to (emphasis mine):
    These data add to a growing body of evidence that biological organisms are affecting clouds, notes Anthony Prenni of Colorado State University in Fort Collins, an atmospheric scientist who did not participate in the new studies. Right now, he cautions, “We still don’t know on a global scale how important these processes are.” But research into microbial impacts on weather and climate is really heating up, he adds, so “within a few years, I think we’re going to have a much better handle on it.”
    So it's very interesting, yes. So are any number of avenues and subjects on which the media has yet to report. But it's of no interest in climate science (to me, at least) at this time. It's about weather, not climate.
  8. Lancelot -"In China one would expect a decrease in net irradiance received due to aerosols. I will have to take your word that the paper describes a decrease in actual sunlight hours since 1974, as I don't have access to it" There are numerous papers freely available on the topic. Try Google scholar. The indirect effect on aerosol formation is not what most people may think. In extremely polluted areas the sulfate particles reach a break-even point and start to warm clouds so much they begin to evaporate. This is small relative to the dimming effects, but it is a saturation point of sorts.
    Response: [Sph] Google scholar = http://scholar.google.com, a useful tool for searching specifically for scientific papers by keyword, author, and date range.
  9. lancelot#255, quoting Tom C#243: "More importantly, it is far from clear that this is a global phenomenon." Alpert et al 2005 supports Tom's observation: we show that this phenomenon, widely termed global dimming, is dominated by the large urban sites. The global-scale analysis of year-to-year variations of solar radiation fluxes shows a decline of 0.41 W/m^2/yr for highly populated sites compared to only 0.16 W/m^2/yr for sparsely populated sites (<0.1 million). Since most of the globe has sparse population, this suggests that solar dimming is of local or regional nature. Move over Urban Heat Island, here comes the Urban Dim Island!
  10. lancelot: it is not easy to measure surface radiation fluxes well. Last I looked, a system that will meet BSRN guidelines will cost you around $100k in equipment and sensor costs. BSRN is intended for long-term climate monitoring, and accuracy requirements push modern technology. If you want a very long read (and want to download quite a few megabytes of manual), the BSRN web site has a link to their Operations Manual. (Don't click the link unless you want the full manual!) Be prepared for a huge whack of technical discussion of sources of error, but before anyone decides "we can't measure radiation" keep in mind that the BSRN goals for accuracy are set very high (in the 1 W/m^2 range). It's the Rolls Royce of radiation measurement, not the Chevrolet version. It's part of the Global Energy and Water Experiment (GEWEX), and has been designated as the radiation observing system for the Global Climate Observing System (GCOS). Sphaerica: Please don't try to tell me that it can all be done by satellites. They give great spatial coverage, yes, but accuracy of surface radiative fluxes can't come close to good surface-based measurements. BSRN provides data at one-minute intervals, 24 hours per day, 365 days a year. A literature search for BSRN references will probably provide you with mostly satellite papers, all desperate for good ground-truth data.
  11. May I just say that I really appreciate the well-considered (and well-mannered) comments to my questions on this site. Sphaerica: When I wrote before I was 'half serious' I was referring to my somewhat flippant suggestion of breeding microbes to seed clouds. That idea, even if feasible, wouldn't go very far of course. I do have a purely scientific interest as you say, but there are larger interests too. (-Snip-). Report of an Ad Hoc Study Group on Carbon Dioxide and Climate, Woods Hole, Massachusetts July 23.–27, 1979 to the Climate Research Board , Assembly of Mathematical and Physical Sciences, National Research Council: “We conclude that the predictions of CO2-induced climate changes made with the various models examined are basically consistent and mutually supporting. ... Of course, we can never be sure that some badly estimated or totally overlooked effect may not vitiate our conclusions. We can only say that we have not been able to find such effects.” (-Snip-) CO2 is a GHG. 100% certain. Natural forcings exist. 100% certain. All possible natural forcings or long term effects on climate have been identified and accurately quantified. __% certain. (Fill in the gap?) muoncounter: Dimming is an urban island phenomenon, ok. Not sure how that relates to the question of net irradiance at surface level globally. From Bob Loblaw's posts I suspect the situation is: we use satellites because they are there. But gee whizz, if we could use actual surface monitoring, we would be so much more certain that our estimates are correct. GCOS looks really interesting. Re sphaerica's comment that oceans cover 70% of surface, I don't see why BSRN type monitoring couldn't be done from ship decks. Use some of that £18bn perhaps?
    Response:

    [DB] Ideology snipped.  Stick to the science, please.

    Your Woods Hole report is badly dated.  Various scientific organizations, including the National Academies last year, have greatly linked the certainty of climate change/global warming (as fact) to its human attribution (greater than 90% likelihood).

  12. 261 - lancelot "So if it turns out in a few years that something has been 'totally overlooked', climatologists will be about as popular as bankers!!" It's worth noting - taking the long view - that CO2 as the key to global warming was, in the '70-'80s, the "other factor". You might also want to ask; if it had been overlooked and, indeed, the anthropogenic origins of the observed warming had been overlooked... just how popular would the climatologists been? If you're going to do counterfactuals; Imagen a future generation suffering from land-loss, a crippled bio-sphere, extreme weather etc. Just how popular will our generation be if we had overlooked the anthropogenic side of the equation and possible mitigation policies and if we don't act on them?
  13. lancelot @261, our understanding of what will happen in the near future does not just depend on projections from known physics. We also have the record from the past. The advantage of the record from the past is that we do not need to know all the factors involved to read that record. We do not need to know what the cloud feedback is, for example, for that feedback has been integrated into the results by the best model available to us, ie, the real world. Given that, it is worthwhile examining two particular events, the Paleocene-Eocene Thermal Maximum (PETM), and the Last Glacial Maximum. The PETM was a warming event at the boundary between the Paleocene and the Eocene. Boundaries between geological eras are marked by significant changes in fossil assemblages, ie, by extinction events followed by repopulation with new species. In this case the extinction event was probably brought on by the release of a large amount of methane, which was oxidized to form CO2 and H2O, with the CO2 showing up clearly in the geological record. The effects are summarized in the abstract of one review article as follows:
    "During the Paleocene-Eocene Thermal Maximum (PETM), 56 Mya, thousands of petagrams of carbon were released into the ocean-atmosphere system with attendant changes in the carbon cycle, climate, ocean chemistry, and marine and continental ecosystems. The period of carbon release is thought to have lasted <20 ka, the duration of the whole event was 200 ka, and the global temperature increase was 5–8°C. Terrestrial and marine organisms experienced large shifts in geographic ranges, rapid evolution, and changes in trophic ecology, but few groups suffered major extinctions with the exception of benthic foraminifera. The PETM provides valuable insights into the carbon cycle, climate system, and biotic responses to environmental change that are relevant to long-term future global changes."
    The interesting thing here is that best estimates show that the climate response to a doubling of CO2 evidenced by the PETM is 3.6 degrees C per doubling. That is a climate sensitivity of 0.973 degrees C per Watt/m^2 of forcing. In contrast to the PETM when temperatures where substantially hotter than today, at the LGM they where substantially colder. Again the climate sensitivity can be calculated from known forcings at the LGM and the known temperature difference. Most estimates in doing so come close to that by Hansen and Sato, with a value of 0.75 +/-0.25 degrees C per Watt/m^2. That represents an estimate of 2.775 (1.85-3.7) degrees C per doubling of CO2 (compared to the IPCC estimate of 2.8). Again, I emphasize, no assumptions about feedback values from water vapour, clouds or anything else go into these calculations. The Earth just does what it does, and the comparison between known forcing and known temperature response yields the climate sensitivity. But despite the significantly different continental arrangements, and the very different temperatures, the climate sensitivity estimates from these two periods are in the same ball park, and indeed, in the same zone as the IPCC estimates. When it comes to the basic feedbacks, it is certainly possible that scientists have missed something. Evidence is strong, for example, that they have been underestimating ice and snow albedo feedbacks (positive). They may well also be overestimating the cloud feedback (possibly positive or negative). For that to create a significant problem for their predictions, these errors need to mostly line up in the same direction. What is troubling about the assumption that these errors will fortuitously come out in our favour is that it is also an assumption that the Earth's climate sensitivity is, fortuitously, approximately half or less of what it is when the Earth is hotter (PETM) or colder (LGM) than it currently is. That somehow, and with no physical basis for assuming so, we just happen to be in a goldilocks zone of low climate sensitivity even though hotter and colder conditions are known to have high climate sensitivities. What makes the heroism of this assumption even greater is that it is known that throughout the entire existence of vertebrates on Earth, from the late pre-Cambrian to the present, climate sensitivity has never been far from 2.8 degrees per doubling of CO2. Over 540 million years of high climate sensitivity, but it just happens when we start emitting CO2 at industrial scales, we happen to be in a goldilocks zone of low climate sensitivity? That, at least, is what the so-called climate "skeptics" would have you believe.
  14. 261, lancelot, 2 things. First, I'm getting the impressions from your posts that you're currently in a "yeah, but what if" mode. You are looking as hard as you can for alternative explanations, but you're starting to run out of ideas (as have the deniers/skeptics). This is fine, and the path you have to take to some degree. But you should be leery of resting a position on ignorance (i.e. it might be those impossible to define natural forcings, or just plain something we haven't thought of yet). That's not science, it's magical thinking. There is also a whole lot to learn. Molecular physics, atmospheric physics, how the myriad proxies work, past climate change events, ocean mechanics, how ENSO works, how models are constructed etc., etc. Your time would be much better spent studying what we do know rather than trying to pin down what we don't know in order to give a wave of the hand attribution of climate change to something other than CO2. The science is fascinating, in and of itself, and you will understand the gaps in our knowledge (where they are, and how deep) much better by learning what we do know than what we don't know. Second... apologies for having parts of your post snipped, but unlike WUWT and many other denial sites, we like to stick exclusively to the science. Occasional this rule must be bent because of current events or the topic of a post (such as public policy), but as a rule, physics doesn't belong to a political party or have a socio-economic reason for warming the planet, so those factors aren't worth discussing.
  15. Sphaerica, no problems. You are right to curtail, but I am not running out of ideas. I had a specific list of questions, I have now gone through it. The topic question was: What does past climate change tell us about warming? Part of the answer would be: Identify all natural causes which may have caused warming, and which may still be causing warming. Once they have been carefully and rigorously eliminated, it leaves only AGW. The list of the 'possible others' was: 1 Solar irradiance - yes of course, but variations are not powerful enough to account for recent variations. 2 Does Solar activity/GCR influence cloud formation? Answer - perhaps, but no firm evidence for that theory yet. 3 Is cloud formation influenced by the biosphere? Answer - perhaps,some interesting studies in hand, but no firm evidence of a significant effect yet. 4 Earth heat, release of mantle heat underwater? Answer - no evidence. 5 Increase in surface irradiation (TSI) due to any other unknown cause, as yet undetected. Answer - the subject has been discussed in another thread. TSI data is incomplete and there seem to be no historic proxies. So, no evidence either way on that. 6 Fairies (joking) That was my entire list of 'suspects'. I have had clarification on all, for which many thanks to all. In summary, on the basis of current evidence: Past climate change and assessment of all conceivable natural causes tells me that AGW looks a 95% certainty. My point about bankers? Well, all professionals carry responsibility for their advice and decisions. I am one. I have to make decisions too, some of them determined by an assessment of the AGW case. If AGW predictions are correct, the world will be grateful for your advice. It not, the world will be quite unhappy about wasted resources. No judgment there, just the way life is. Good luck.
    Response:

    [DB] Here we are, a flurry of responsive comments later (all subsequent to your comment with unsourced graphics).  I remind you again of the need to provide sources for these asserted graphics as others having to point out the issues with these is dragging this whole thread off-topic.

    Or else I will have to clean up this thread a bit.

  16. FYI, there is evidence on TSI... evidence that there has been no corresponding increase coincident with the warming of the last 30 years. That's why they started reaching for GCRs and other special effects. Except that there are proxies for that, too, and they don't appear to have had that sort of climate effect in the past, so why would we think they suddenly have a large effect now? And, lastly, if such an effect is large, then it implies a high climate sensitivity -- and a big part of the skeptic argument today has turned to a begrudging admission that it is warming (unless some new evidence says it's not or it's stopped), a begrudging admission that CO2 is the cause (unless some new idea says maybe it's not), but an adamant belief that any such warming will not be too great because climate sensitivity is low and the planet has a natural negative feedback to constrain temperatures to a narrow range (this despite the evidence of great swings between glacial and interglacial periods, and other proxy evidence of past extreme if much slower changes in climate, observational evidence of positive feedbacks in today's warming world, and well conceived and modeled mechanisms that would point to the currently estimated sensitivity of 2˚C to 4.5˚C).
  17. 265, lancelot, Sorry, I just realized that you used TSI incorrectly, and I responded to my instant interpretation of the acronym, not what you meant by it. TSI stands for Total Solar Irradiance, and has to do with the amount of solar radiation (all frequencies) hitting the earth at TOA (top of atmosphere). It does not refer to the amount of radiation actually reaching the ground.
  18. 267 No, my apologies, I meant Total Surface Irradiation. Moderator: Point noted. My first use of graphics, possibly the last.
    Response:

    [DB] It is not the usage of graphics to make a point that is the issue (indeed, graphics are extremely powerful in conveying of complex information and ideas).  The issue in play is that the source of the graphic needs to be made transparently clear.  And if the graphic is "home-baked-bread" then the methods used to create it (the "recipe", if you will) must be made available to the reader as well.

    But thank you for providing the requisite information.

  19. Tom Curtis: Thanks for your post 263. PETM is a big subject area in its own right and I have yet to venture into it in depth. With my usual Sherlock Holmes hat on I would just ask, have all other possibilities first been eliminated? What little I know of PETM comes mainly from Bryan Lovell in 'Challenged by Carbon' (a book kindly recommended to me by Prof David MacKay) in which Lovell selects the PETM event of 55 Ma as the prime evidence for CO2 warming. To quote him: _________________________________ Prof G Dickens [presumably Dickens G R 1999, Nature, 401, 752-755] ... reaches several conclusions: 1 The first of their conclusions is that a large quantity of carbon was released into the ocean-atmosphere system 2 The second is that the temperature of the water at the bottom of the ocean increased rapidly by more than 4 deg C from 11 to 15 deg C , over the same short period. Norris & Rohl [1999] conclude: 3 For just a brief period, .. temperatures at high latitudes and in the deep oceans soared by 5 - 7 deg C. [some contradiction of numbers here] _____________________________________ I have not read the papers cited, but just considering those two factors as described, the primary event seems possibly to be heating of the bottom of the deep ocean. CO2 could not cause such a rapid effect directly. It seems very possible from those statements that a major geological event in the mantle or crust under the oceans released a large amount of heat directly into the deep oceans. A huge release of carbon from the mantle or crust in form of methane at the same time is indicated. Heating of the deep oceans would lead to a rise in air and surface temperatures, as well as a further release of stored CO2 in the oceans. No doubt the airborne CO2 would create a serious GHG effect, but how much of the surface warming could have in fact been caused by deep ocean water warming? Would that affect the sensitivity estimate? I hope I am not just saying 'yeah if', but putting forward a valid question here.
  20. Moderator: Is there any way to find one's past posts? I am getting a bit lost with the many different threads.
    Response: [Dikran Marsupial] The easiest thing to do is to look back through the recent comments. However, it is generally a good idea to limit the number of discussions you participate in simultaneously. Science is best discussed in depth rather than breadth (at least to begin with), the best way to do that is to conduct a single narrow thread of discussion at a time and avoid digreessions.
  21. lancelot - if you want to get into ideaological matters, how about taking the challenge here?
  22. lancelot - It takes something like 0.5-1 ka (thousands of years) for the deep oceans to equilibrate to a temperature change. The PETM event, quite possibly driven by a massive clathrate release, lasted 20 ka, with the effects persisting for 200 ka - plenty of time for the enhanced greenhouse effect to equilibrate. Not extra heat at the bottom of the ocean - we would see the geologic signs of that (volcanism, lava, etc?) quite easily. But a carbon release that increased the greenhouse effect. The extra CH4 (then oxidizing to CO2), massive GHG increase, leads to atmospheric and ocean surface heating, with ocean circulation bringing that to the depths. The math works out - no extraneous sub-benthic heat sources needed. --- I have to say that you appear to still be hunting for anything but CO2, rather than following the evidence. That's an inherent confirmation bias, searching for a particular explanation rather than paying attention to what the data supports. That attitude will lead you astray...
  23. lancelot - As an addendum to my previous post: The Earth fully equilibrates to changed energy conditions in a fairly short time, geologically speaking (~500-1000 years, including deep oceans). The only way for a temperature change to last 200 ka is for either the input energy or the temperature dependent rate of outgoing energy (as per the Stefan-Boltzmann relationship) to be different - a forcing change. Hence your PETM "sub-ocean heating theory" would require a 200 ka 5C warming of the ocean bottom. There's no evidence for that, and in fact significant evidence against it (there would be considerable changes in ocean core data, for example). Whereas we have plenty of evidence supporting increased GHG effects, including the timing of CO2 recovery matching the end of the PETM. Follow the evidence, lancelot - not your preconceptions.
  24. Might I suggest to anyone reading this thread to to take the time and re-read Tom Curtis' post at #263. A great, and impotant post! And Tom, it might be worthy of a new blog post if the balance of both cold (LGM) and warm (PETM) climate sensitivity has not been explicitly covered before?
  25. KR, fine, I simply put what seemed to be a very obvious question, from a position which I had clearly stated, based on reading the statements quoted by Brian Lovell, and without the benefit of a detailed study of the PETM. The statements quotes were not backed up by detailed supporting evidence such as you have quoted. My question invited any rebuttal with contrary evidence, such as yours. That does not, I think, make me a narrow minded denialist. I may however be a bit persistent in seeking answers. Just another question though, how can you be certain of "no geological signs" in the ocean floor from 55ma ago? Lot of sediment since then, and it's a big ocean.

Prev  1  2  3  4  5  6  7  8  9  10  11  12  13  14  15  16  17  18  19  20  Next

Post a Comment

Political, off-topic or ad hominem comments will be deleted. Comments Policy...

You need to be logged in to post a comment. Login via the left margin or if you're new, register here.

Link to this page


The Consensus Project Website

THE ESCALATOR

(free to republish)


© Copyright 2024 John Cook
Home | Translations | About Us | Privacy | Contact Us