Sun & climate: moving in opposite directions
What the science says...
Select a level... |
![]() |
![]() |
![]() | ||||
The sun's energy has decreased since the 1980s but the Earth keeps warming faster than before. |
Climate Myth...
It's the sun
"Over the past few hundred years, there has been a steady increase in the numbers of sunspots, at the time when the Earth has been getting warmer. The data suggests solar activity is influencing the global climate causing the world to get warmer." (BBC)
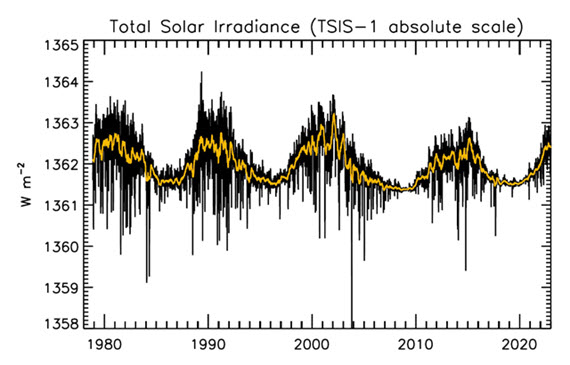
Over the last 35 years the sun has shown a cooling trend. However global temperatures continue to increase. If the sun's energy is decreasing while the Earth is warming, then the sun can't be the main control of the temperature.
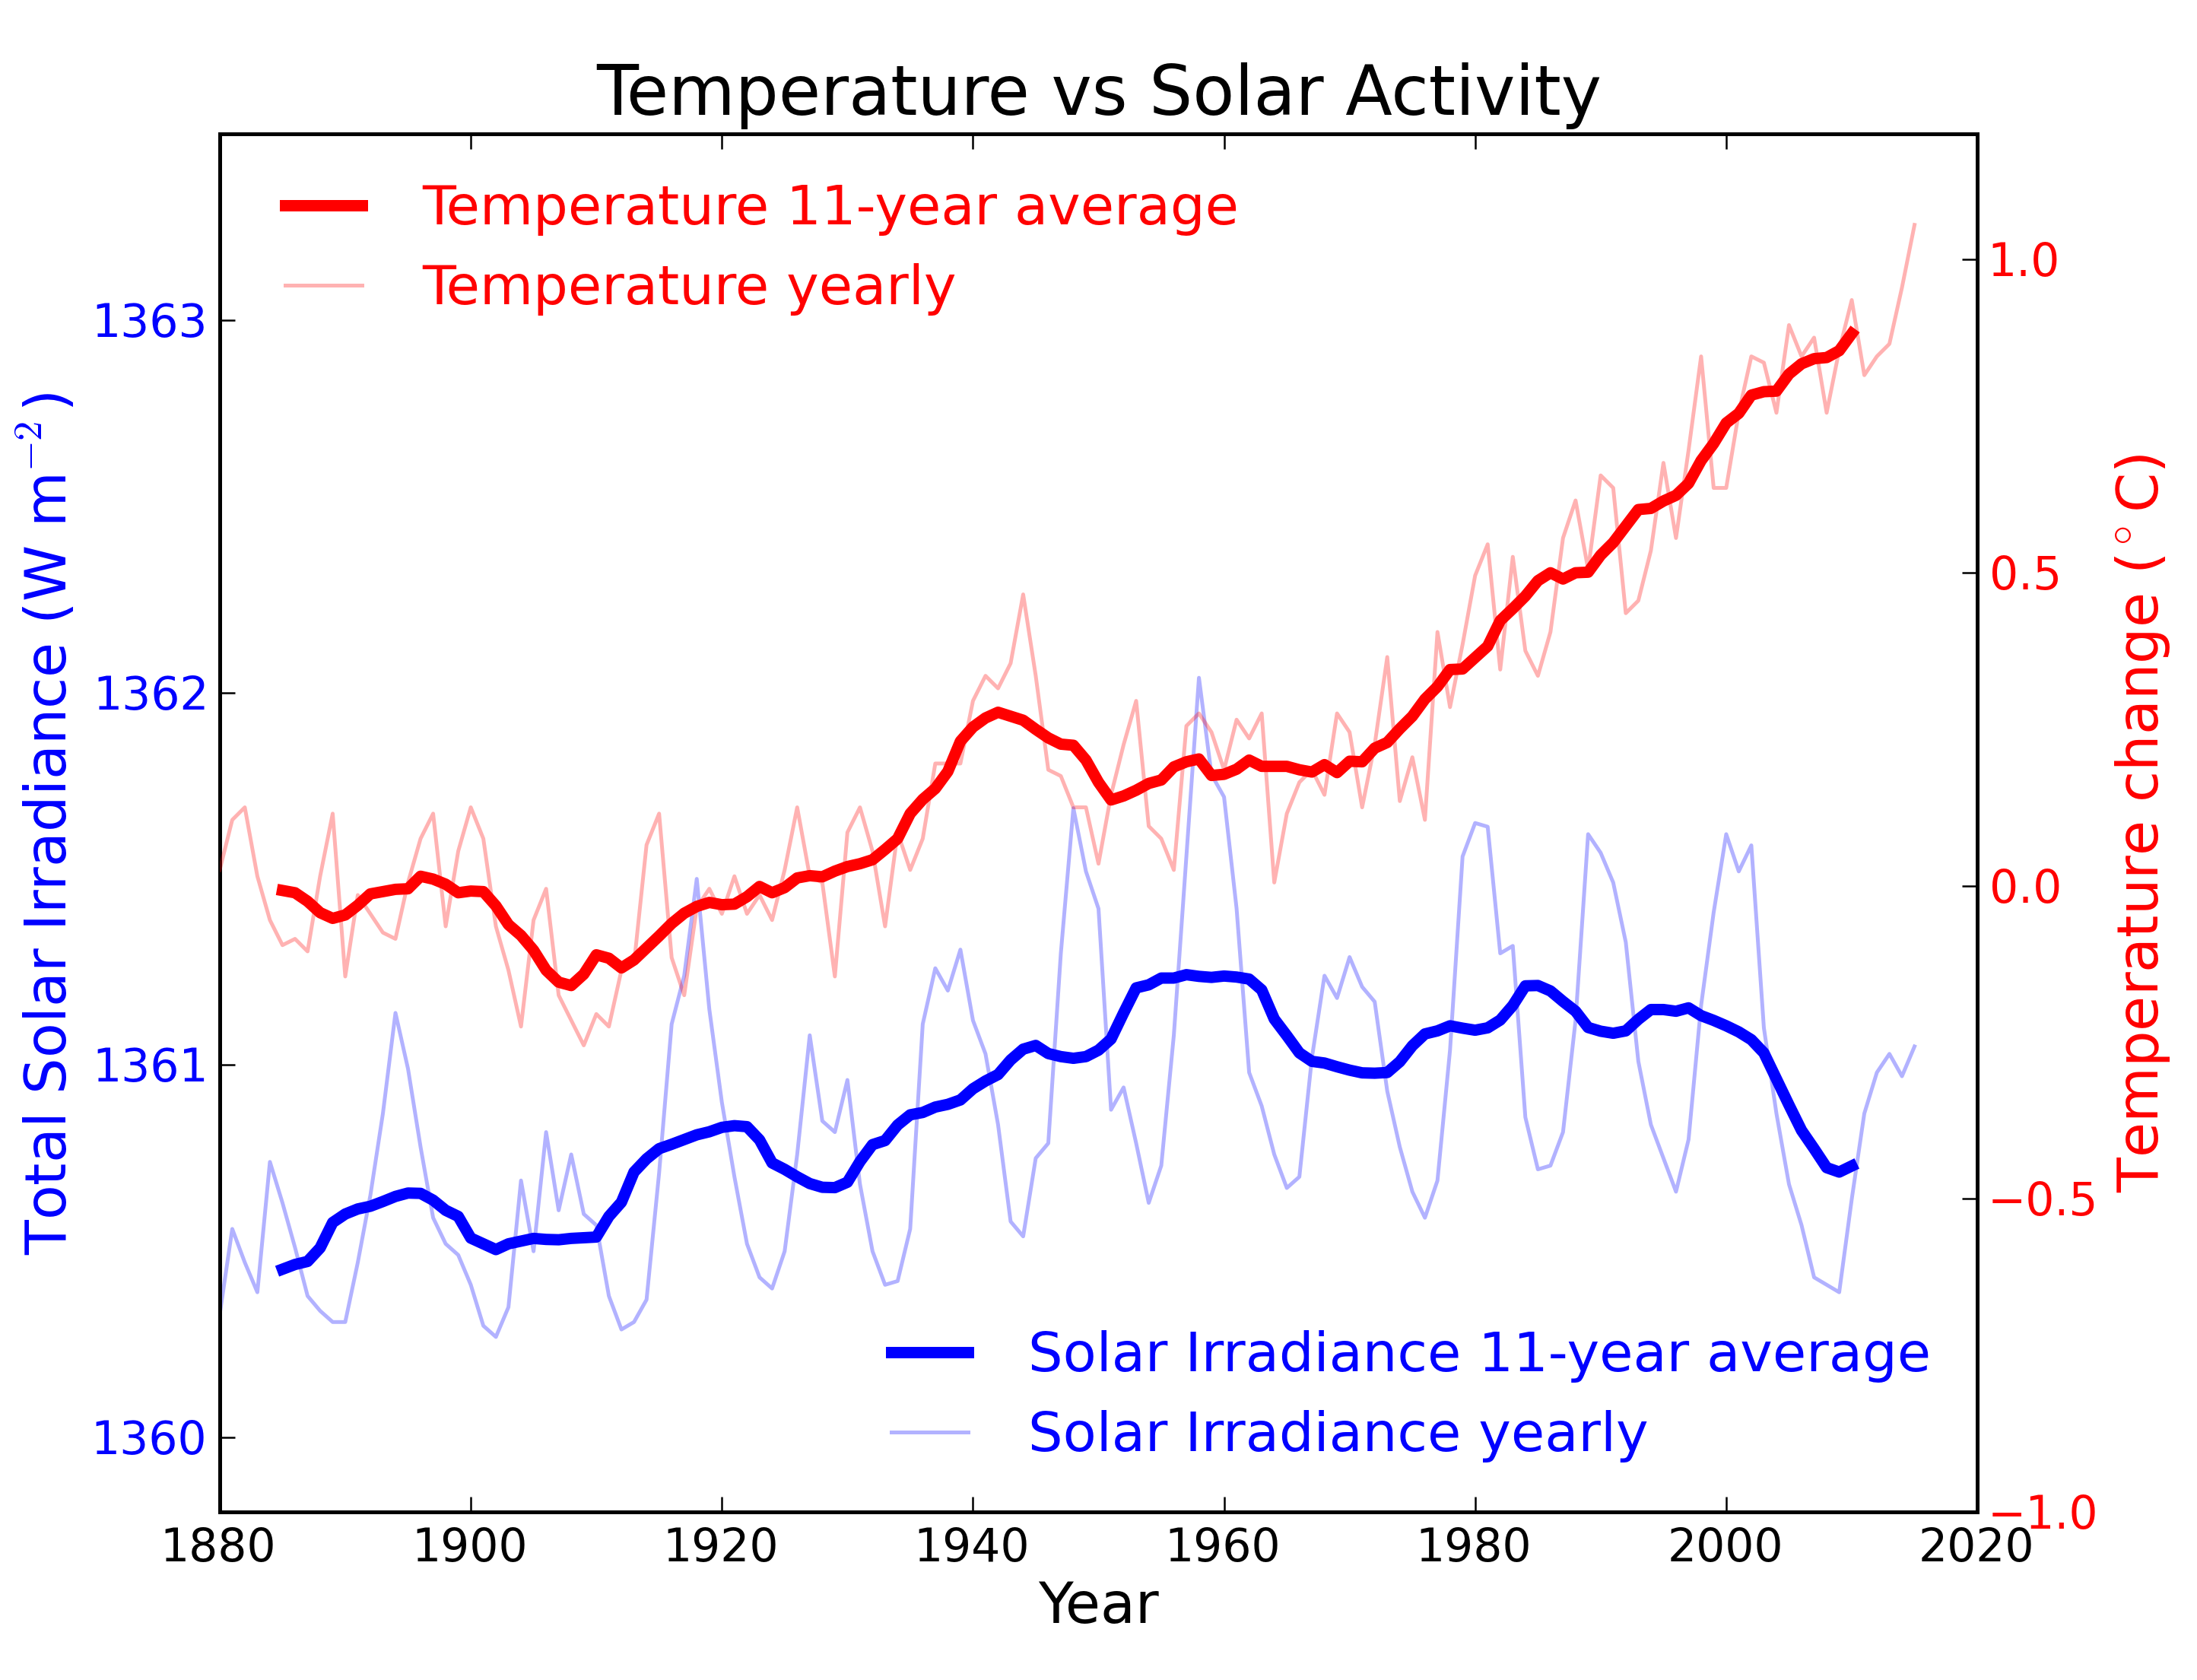
Figure 1 shows the trend in global temperature compared to changes in the amount of solar energy that hits the Earth. The sun's energy fluctuates on a cycle that's about 11 years long. The energy changes by about 0.1% on each cycle. If the Earth's temperature was controlled mainly by the sun, then it should have cooled between 2000 and 2008.
Figure 1: Annual global temperature change (thin light red) with 11 year moving average of temperature (thick dark red). Temperature from NASA GISS. Annual Total Solar Irradiance (thin light blue) with 11 year moving average of TSI (thick dark blue). TSI from 1880 to 1978 from Krivova et al 2007. TSI from 1979 to 2015 from the World Radiation Center (see their PMOD index page for data updates). Plots of the most recent solar irradiance can be found at the Laboratory for Atmospheric and Space Physics LISIRD site.
The solar fluctuations since 1870 have contributed a maximum of 0.1 °C to temperature changes. In recent times the biggest solar fluctuation happened around 1960. But the fastest global warming started in 1980.
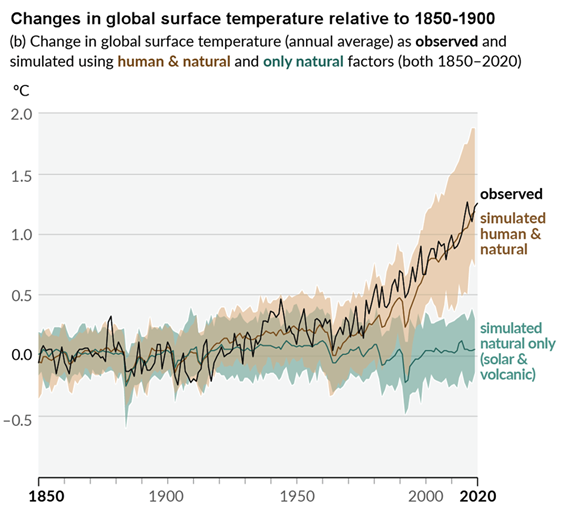
Figure 2 shows how much different factors have contributed recent warming. It compares the contributions from the sun, volcanoes, El Niño and greenhouse gases. The sun adds 0.02 to 0.1 °C. Volcanoes cool the Earth by 0.1-0.2 °C. Natural variability (like El Niño) heats or cools by about 0.1-0.2 °C. Greenhouse gases have heated the climate by over 0.8 °C.
Figure 2 Global surface temperature anomalies from 1870 to 2010, and the natural (solar, volcanic, and internal) and anthropogenic factors that influence them. (a) Global surface temperature record (1870–2010) relative to the average global surface temperature for 1961–1990 (black line). A model of global surface temperature change (a: red line) produced using the sum of the impacts on temperature of natural (b, c, d) and anthropogenic factors (e). (b) Estimated temperature response to solar forcing. (c) Estimated temperature response to volcanic eruptions. (d) Estimated temperature variability due to internal variability, here related to the El Niño-Southern Oscillation. (e) Estimated temperature response to anthropogenic forcing, consisting of a warming component from greenhouse gases, and a cooling component from most aerosols. (IPCC AR5, Chap 5)
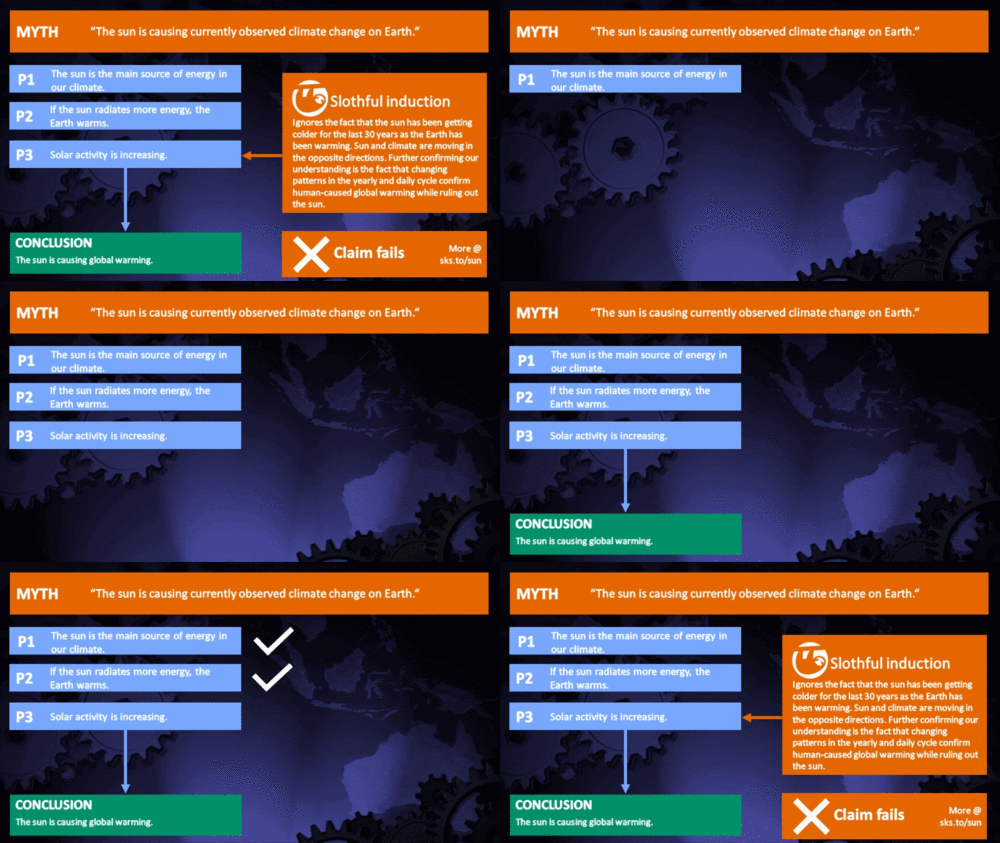
Some people try to blame the sun for the current rise in temperatures by cherry picking the data. They only show data from periods when sun and climate data track together. They draw a false conclusion by ignoring the last few decades when the data shows the opposite result.
Basic rebuttal written by Larry M, updated by Sarah
Update July 2015:
Here is a related lecture-video from Denial101x - Making Sense of Climate Science Denial
Last updated on 2 April 2017 by Sarah. View Archives
The Sun is constantly 'adding energy to the system'. However, if solar activity remained constant then it would obviously not cause any change to the climate. It is only when there is a change in solar activity (that is, a "forcing") that there is a corresponding change in climate... and then only until a new equilibrium is reached. The same is true of all climate forcings.
So no, KR probably 'does not get' that flat forcing factors do not change the climate.
Because they don't.
Second: KL, I get what you're saying, I guess I just don't see the point you are trying to make. It seems you've lost yourself in your own arguments.
The satellite TSI readings appear to have cross-platform calibration issues, as each is self-calibrated to internal standards. This has improved over the years, not to say that it's not a work in progress, but it's improving. Note that the precision, the repeatability of these measures, is extremely good - the accuracy may be off a bit. But high precision means excellent tracking of changes, of deltas in TSI forcing.
Now, if there's a linear offset in TSI measures (direct or using sunspots as proxies), as you have argued, there would be a difference in slope between measured TSI responses and temperature over the entire temperature/TSI record, not just the last 60 years. One look at the Temperature vs. Solar Activity chart on the Basic version of this thread will disprove that. I certainly know that all forcings are part of the picture; I'm not certain from your statements that you do.
The two lines have separated. The temperature changes correspond to changes in GHG forcings, they do not correspond to changes in TSI. That is entirely supported by the numbers you presented here, as kdkd pointed out statistically - you've just disproven your hypothesis again.
You are incorrect on the basis of correlation of ΔT versus ΔForcings, on the magnitude of the TSI changes, and on somehow not crediting the forcings of GHG's. You've repeated the same arguments over and over despite multiple corrections. At this point I'm out of this discussion.
I think this is Ken's strategy: obfuscate, reiterate and ignore other arguments until people are fed up with him and leave, at which point he claims victory.
Better to ignore him. It's not as if his arguments will be reused by other "skeptics" anyway...
"So no, KR probably 'does not get' that flat forcing factors do not change the climate.
Because they don't"
Flat forcing is not 'zero' forcing CBD & KR.
The numbers I presented show a F.Solar of about 0.4W/sq.m from the IPCC Fig 613 Chart which is also available in numerical form (worked elsewhere by kdkd)from AD1950 onward, and 0.1-0.2W/sq.m before that.
A 'flat' 0.4W/sq.m integrated wrt time will give you a linearly increasing number of Joules/sq.m - the unit of energy. Energy is what you need to heat mass.
Note the units of specific heat of water (or other mass)are Joules/kG-degC - NOT Watts/kG-degC
Linearly rising energy in Joules will linearly raise the temperature of a given mass (without phase change).
Hence rising temperatures with 'flat' non-zero forcing are quite consistent with the 'Temperature vs. Solar Activity chart on the Basic version of this thread'
Add to that a 'theoretical' roughly linearly rising forcing F.CO2 and you will get a squared function non-linear rising curve of energy wrt time.
This is Grade 11 maths.
What counts is the sum of and proportions of the energy added by the two sources. I calculated previously that on the IPCC data the energy proportions were about 55/45 CO2GHG/Solar since AD1750.
The question then becomes how reliable and accurate are these forcings. We have some proxy and direct measurement for TSI and F.Solar.
KR: "Now, if there's a linear offset in TSI measures (direct or using sunspots as proxies), as you have argued, there would be a difference in slope between measured TSI responses and temperature over the entire temperature/TSI record, not just the last 60 years"
Wrong - see above. Non-zero constant forcing produces linearly rising temperature for a given mass.
How long do we have Satellite TSI data? - since 1978? Again high precision - low accuracy. Will tell you the deltas within an individual satellite record - maybe spliced together between satellites (maybe not too) - but no good for accurately measuring absolute TSI (SORCE TIMS is a good example).
Archiesteel - don't know what your technical training or background is - but kdkd will tell you that it is risky to call me on the sums.
Your inability earlier to understand such as simple matter as relative deltas instead of absolute values seems to confirm this hypothesis.
If you truly understand an issue, you should be able to explain it to non-technical people like me. The fact you cannot seem to make a clear argument with all those equations is telling, and that's all I'll say on the matter before getting even more off-topic.
"Hence rising temperatures with 'flat' non-zero forcing are quite consistent with the 'Temperature vs. Solar Activity chart on the Basic version of this thread'"
That may be the case, if we didn't have additional data showing that the role of CO2 has been strong for the past 60 years. However we do. If you omit key information, then your hypothesis would appear credible. However omitting key information is not justified, so your hypotheis is not credible.
We should have a beer together someday kdkd. I have a sudden feeling of kinship with you after a night listening to Ziggy Switkowski.
KL: "What counts is the sum of and proportions of the energy added by the two sources. I calculated previously that on the IPCC data the energy proportions were about 55/45 CO2GHG/Solar since AD1750.
The question then becomes how reliable and accurate are these forcings. We have some proxy and direct measurement for TSI and F.Solar."
I have not ignored the theoretical contribution of F.CO2 - I have said that the two main positive forcings add together - F.Solar a linear function - and F.CO2 a squared function. It all depends on the magnitude of the forcings and the elapsed time - ie the area under the curves.
This only represents the available positive (warming) forcings.
The main negative forcings are cloud and aerosol albedo, and S-B radiative cooling. I shall run some numbers on these and try for a net forcing since say AD1750 in 50 year tranches.
Had a late night so look for this tomorrow.
Forgive my lack of communicative skills - but I only felt knowledgeable enough to enter this blog after a year or so jousting with the likes of kdkd and reading Dr Trenberth, IPCC reports etc.
The most imformative paper I have read is:
http://www.cgd.ucar.edu/cas/Trenberth/trenberth.papers/EnergyDiagnostics09final2.pdf
I should have prefixed this with 'the energy from"
"I have not ignored the theoretical contribution of F.CO2 - I have said that the two main positive forcings add together - F.Solar a linear function - and F.CO2 a squared function. It all depends on the magnitude of the forcings and the elapsed time - ie the area under the curves."
Taking the area under the curves ignores the tendency of the system towards thermal equilibrium. A flat forcing does not produce a linear increase in the net energy of the system, since the energy emitted by the system also rises proportionally to the energy absorbed. What it will produce is an increase with its slope tapering towards zero.
Now the operative question is: how long does the system take to reach equilibrium given a flat forcing? This question (and the general claim you are making) was addressed in one of John's posts a while back. In short, there is no evidence that the flat solar trends are having a significant influence on recent temperature increases.
>in fact all charts show increasing temperatures since 1850.
No they don't. Temperatures were stable if not cooling slightly from 1850-1915. I believe what you are thinking of are charts showing overall temperature increase from 1850 to today, not the actual trends during those particular decades.
Even after all these messages I still don't get what you're driving at. Talk about a colossal waste of time...
Well, as this article shows, it's not 2000, it's 1980. Also, note that temperatures actually *lead* TSI from about 1925 to 1950.
So, what can we conclude? Solar forcing does have an impact, but in the past 30-35 years it has been completely overpowered by anthropogenic greenhouse gases.
I covered this point about areas under curves viz:
KL : "This only represents the available positive (warming) forcings.
The main negative forcings are cloud and aerosol albedo, and S-B radiative cooling. I shall run some numbers on these and try for a net forcing since say AD1750 in 50 year tranches."
There will be a S-B negative curve and cloud albdo and aerosol negative curves - with the sum of all being the net energy added or lost to the Earth system.
According to Hansen the thermal lag of the system is about 25 - 50 years, so we should see a temperature response which follows the net energy balance - lagging by some similar time period.
Certainly if you take decadal sections of the post AD1850 temperature curves there are flat periods or slightly cooling periods - just like the one we have had for the last 10 years. This is consistent with the net area of Total forcing curves shown here :
http://www.brighton73.freeserve.co.uk/gw/GISS_forcings.gif
PROVIDED you add the correct Solar forcing of about +0.1 - 0.2/sq.m on the positive side which has been wrongly set to zero in this Total forcing chart.
ie: The period 1850 - 1915 should be cooling because all the area under the Total Forcing chart is negative -but the temperature record shows flat (or very slight cooling) which indicates that positive Solar forcing at was offsetting the negative area.
"Even after all these messages I still don't get what you're driving at. Talk about a colossal waste of time... "
Your failure to understand might not be within my power to explain archiesteel.
Oh, I *understand* what you're saying (with a measured IQ of 150, I should be able to understand basic math and science even though my training in those areas stopped after high school). I just don't get what you're driving at. I'm sure it has something to do with trying to disprove AGW, but your argument is so buried in obfuscating jargon it's hard to tell anymore.
Please come down your high horse and state your argument clearly, or we'll be forced to conclude all you're doing is trying to muddy the waters. Here, I'll help you, since that task seems above your abilities: Do you think the sun is responsible for the current warming trend?
Did you take a look at the post I linked? It addressed essentially exactly what you are claiming, that solar forcings have a more long term effect then currently understood.
Anyways, Hansen 2005 already "ran the numbers" as you are attempting to do. The net radiation and temperature data produced as a result is consistent with the temperature record and inconsistent with the idea that solar forcing is having any significant effect on recent warming.
I can assure you that it's your argument that is unclear, and that it leads to conclusions that you do not state explicitly, but instead expect the reader to infer themselves. Not good enough I'm afraid.
Variable solar irradiance as a plausible agent for multidecadal variations in the Arctic-wide surface air temperature record of the past 130 years (full text, pdf)
CO2 and aerosol forcing are an order of magnitude larger than solar variations. Don't get hoodwinked by scientists-for-hire like Willie Soon.
This is the introduction to your cited Hansen paper:
"Our climate model, driven mainly by increasing humanmade greenhouse gases and aerosols among other
forcings, calculates that Earth is now absorbing 0.85 ±
0.15 W/m2 more energy from the Sun than it is emitting to space. This imbalance is confirmed by precise
measurements of increasing ocean heat content over the
past 10 years."
I don't think so. OHC content measurement debated at great length elsewhere on this blog eg; "Robust warming of the global upper oceans" has shown that OHC measurement is everything but precise.
Even Dr Trenberth who would be on the same side of the debate as Hansen can only find 60% of the OHC increase posed by the 0.9W/sq.m imbalance.
Will post my numbers when completed and checked. You all can be my peer review.
Regarding the numbers I am currently crunching (Ref #651)- could anyone point me to some historical data on Wate Vapor + Ice Albedo feedback - currently quoted by Dr Trenberth at +2.1W/sq.m in AD2005.
I could assume linearity back to zero in AD1750 but this is a very significant component, and this could widely affect the result of the Total forcing sum.
Shouldn't we be focusing on data that has been reliably taken... not theoretically? Can't we agree that regardless of how steep the upward trend of some graph is that our actions are not helping?
Carbon Dioxide or Solar Forcing?
http://www.sciencebits.com/CO2orSolar
Chris Shaker
http://www.agu.org/pubs/crossref/2010/2010GL042918.shtml
Chris Shaker
No statistically significant correlation between cosmic rays and global temperature has ever been established, unlike the clear correlation between temperature rises of the last 150 years and CO2 concentrations. Dr. Shaviv is expressing a viewpoint not supported by the data.
The link you present here, on solar forcing, discusses the last 6500 years, not the present, and states "We present evidence to support physical links between variability in solar irradiance and change in the hydroclimate of southeast Australia and suggest that the effects of global warming and solar maxima on atmospheric circulation over extra-tropical regions may exacerbate these impacts" (emphasis added).
This is hardly a critique of AGW. You should read CO2 is not the only driver of climate - CO2 has a dominant effect now, but hasn't been the driver for most climate changes in the past.
"CO2 believers" do not "squash consideration of solar forcing". Unfortunately, it's bad news for our friends living Down Under:
"As a result, the effects of possible synergies occurring between global warming and solar maxima on atmospheric circulation over extra‐tropical regions could result in severe drought becoming the typical climate state in regions such as southeast Australia."
Chris Shaker
The 'glacial cycle' is a result, not a cause. Increased atmospheric CO2 is a causative agent (aka 'forcing') of increased warming. See CO2 is not the only driver.
Please find the appropriate threads for further comments about whatever you refer to as 'cycles' -- this is 'its the sun'.
i.e the daily heat loss.
If the rise in temperature is due to the sun then the days maximum will be high but the amount of heat lost over the night will be constant.
If it's due to CO2 then less heat will be lost at night.
Yes. See the post here.
Obviously, the sunspot number itself doesn't influence the earth's climate -- it has to be modulated through some physical process.
So if you're not using sunspots as a proxy for solar irradiance, how do you suggest that sunspots affect the climate?
"Obviously, the sunspot number itself doesn't influence the earth's climate -- it has to be modulated through some physical process.
So if you're not using sunspots as a proxy for solar irradiance, how do you suggest that sunspots affect the climate?"
This writer believes an atmospheric electrical circuit can explain how an active sun will change climate other than the TSI.
Sun's effect on electrical properties of the atmosphere and how these may cause Climate Change.
I am not saying this writer's theory is correct but it does answer your question about how sunspot number can cause changes in climate.
Can you give me a summary, or do I have to read the manuscript?
A quote from the article: "Despite the difficulty in identifying cause and effect in a chaotic system such as the atmosphere, it remains possible that the global atmospheric electrical circuit provides a neglected feedback in the climate system, and with it, an amplification of the solar variability signal in the climate records. This is the principal reason why the topic now deserves further exploration."
The basic point was cloud formation physics and how the electrical circuit effects this phenomena. Clouds are what cause the Earth's albedo to be around 0.3. If not for clouds the albedo would be around 0.1 (ocean's make up 70% of the surface) and the Earth would be much warmer.
Based upon my (admittedly) skimming through of the paper, I saw some data cherry-picking, chance correlations and gibberish (to use some technical descriptors).
Maybe I'm under-selling it, but no physical mechanism postulated in the study also postulates why the physical processes of GHG's work for the remainder of the paleo record, but not for the past 30 years.
Hence my gibberish descriptor.
Maybe if it had been written in Yooperese: The Yooper
On a previous thread I posted a albedo calculator. Located on the page I will link to. It is a calculator that will determine temp with no GHG, just the two variables. TSI and albedo (basically to simplify so you can see relative contribution to temp).
If you play with this calculator a bit you will see TSI has little effect at the ranges during sunspot cycles. But alter the albedo a few %points and you can see it has a rather large effect on global temps. If sunspot cycles alter the Earth's albedo even a few percent points, they can have a large effect on global temps.
Not saying that is the cause but if sunspot number does effect cloud formation via the Earth's electrical circuit then that is a mechanism to explain how sunspot number can alter climate.
I neglected to link to the albedo calculator.
albedo and TSI calculator.
Secondly, noone doubts changing albedo (with no other change) will affect temperature. So magical fairy dust might increase albedo but "electrical connection between sun-earth" is in same category until someone presents some believable physics to show how this could work instead of gobbledegook. You appear to preferring wild speculation backed by dodgy "facts" in preference to a working model, conforming to known physics.
The Yooper
You obviously haven't been keeping up with the thread on the second law of thermodynamics, where someone just wrote:
"The idea that planetary temperature is affected by its albedo is quite mistaken."
Ray Ladbury may make statements with vigor and certainty but that does not make them correct.
"First, you have to look at ALL the evidence. There is no way you get simultaneous stratospheric cooling and tropospheric warming without a greenhouse forcing. And increased tropospheric water vapor ain’t gonna give you that."
NASA may disagree. An active Sun can destroy ozone in the stratosphere (the primary cause of warming in that region). An active sun can warm the Troposphere by adding more heat to the surface and by destroying the ozone it can at the same time cool the stratosphere. No greenhouse forcing is needed in this case. You have two possible causes for an observed effect. It is possible (I am not saying it is likely, just questioning the claim made by Ray Ladbury) that the troposphere can warm at the same time the stratosphere cools via active sun without GHG forcing (in an atmophere with no GHG that is).
Supporting evidence for the above claim.
Active Sun can destroy ozone in stratosphere.
A 1% reduction of NH ozone (less from the SH) would represent at most a 1% reduction of incoming UV energy, and a 0.25% reduction in temperature. To put that into perspective, chlorofluorocarbons reduced stratospheric ozone by about 30%, an effect which contributes around 30% of the observed cooling of the stratosphere.
As the event causing this reduction was episodic (the one observed being the third largest in 30 years) and as the Ozone recovers between episodes, it is doubtfull that such events would compensate for the warming effect in the stratosphere of increased insolation. They certainly would not reverse that effect and give as large a cooling as has been observed.
Short answer? In the paleo record, CO2 acted as a feedback to temperatures, with orbital factors being a primary driver of climate change (with the exception of methane burps [think PETM]).
What is different today is the immense bolus, or carbon slug, of CO2 mankind has injected into the atmosphere. By doing so, we have changed the game: instead of CO2 acting as a feedback, it now acts as forcing, causing a cascade feedback reaction of warming that also drives more CO2 and CH4 release, causing further warming.
The warming will continue until CO2/CH4 emissions stablize + about 40 years for the thermal lag of the oceans to catch up. Once radiative balance is then achieved, temps and resulting large and micro-scale climate patterns will stabilize.
And that was the short answer.
The Yooper