


 Arguments


Empirical evidence that humans are causing global warming
What the science says...
| Select a level... |
 Basic
Basic
|
 Intermediate
| |||
|
Less energy is escaping to space: Carbon dioxide (CO2) acts like a blanket; adding more CO2 makes the 'blanket' thicker, and humans are adding more CO2 all the time. |
|||||
Climate Myth...
There's no empirical evidence
"There is no actual evidence that carbon dioxide emissions are causing global warming. Note that computer models are just concatenations of calculations you could do on a hand-held calculator, so they are theoretical and cannot be part of any evidence." (David Evans)
At a glance
Empirical evidence? None? That's a big bold statement to make, so let's take a look. 'Empirical' is defined as something that may be actually measured and presented as a finding. Let's treat the topic as a criminal prosecution. The accused is CO2 and the accusation is that its increased levels through our emissions are warming the planet. As with all court cases, it's important to present an accurate account of events. So firstly, we'll examine the background to this particular case.
It all started in the 1820s, when French physicist Joseph Fourier had worked out that, at its distance from the Sun, Earth should be very cold. He proposed that Earth's atmosphere must contain something that kept the planet warm, like some invisible blanket. His ideas were, it turned out, correct albeit incomplete.
Some decades passed before the nature of Fourier's blanket was discovered. This was done through a series of experiments involving various gases. Interestingly, two investigators worked on it independently, John Tyndall, in the UK and Eunice Foote in the USA. Impressively, their results were virtually identical.
Foote, writing in 1856, was the first scientist to state that carbon dioxide can trap energy. She predicted that if there had been more CO2 in the atmosphere at times past, an increased temperature would have prevailed. That was something the geologists already knew. Tyndall went on to write, in 1861, that on top of carbon dioxide, hydrocarbons - such as methane - would have even greater effects at very low concentrations. The greenhouse effect and its key players had been identified.
The landmark paper, "The Carbon Dioxide Theory of Climatic Change", was published just under a hundred years later. Essentially, it stated what we know now. Without the atmosphere and its greenhouse gases, Earth would be an uninhabitable iceball. As Fourier started to reason all that time ago, greenhouse gases act like a blanket. They keep Earth warm by inhibiting the escape of energy back into space. Humans are adding CO2 to the atmosphere, mainly by burning fossil fuels, thereby intensifying the effect.
That's the background. As we emit more greenhouse gases, the effect is like wrapping yourself in a thicker blanket. Even less heat is lost. So how can we tell that? How can we find hard evidence, like good CCTV footage of our suspect up to their mischief?
How about measuring it?
Satellites orbiting our planet carry sensitive instruments on board. Through them we can measure how much energy is arriving from the Sun. We can measure how much energy is leaving the Earth, out into space. So right there we have two things to compare.
What do the measurements tell us? Over the last few decades since satellites became available, there has been a gradual decrease in the energy heading from Earth's surface back into space. Yet in the same period, the amount of energy arriving from the Sun has hardly changed at all. Something is hanging onto that energy and that something is getting stronger. That something is carbon dioxide - doing exactly as Foote and Tyndall said it would 160 plus years ago.
Verdict: guilty on all counts.
Please use this form to provide feedback about this new "At a glance" section. Read a more technical version below or dig deeper via the tabs above!
Further details
The well-established theory that man-made CO2 is causing global warming is supported as well as any chain of evidence in a rock-solid court case. CO2 keeps the Earth warmer than it would be without it. It has done so for most of geological time. Humans are adding substantial amounts of CO2 to the atmosphere, mainly by burning fossil fuels. Empirical evidence abounds to support the contention that the rising temperatures are being caused by that increasing CO2.
The Earth is wrapped in an invisible blanket
It is the Earth’s atmosphere that makes most life possible. To understand this, we can look at the moon. On the surface, the moon’s temperature during daytime can reach 100°C (212°F). At night, it can plunge to minus 173°C, or -279.4°F. In comparison, the coldest temperature on Earth was recorded in Antarctica: −89.2°C (−128.6°F). According to the WMO, the hottest was 56.7°C (134°F), measured on 10 July 1913 at Greenland Ranch (Death Valley).
Man could not survive in the temperatures on the moon, even if there was air to breathe. Humans, plants and animals can’t tolerate the extremes of temperature on Earth unless they evolve special ways to deal with the heat or the cold. Nearly all life on Earth lives in areas that are more hospitable, where temperatures are far less extreme.
Yet the Earth and the moon are virtually the same distance from the sun, so why do we experience much less heat and cold than the moon? The answer is because of our atmosphere. The moon doesn’t have one, so it is exposed to the full strength of energy coming from the sun. At night, temperatures plunge because there is no atmosphere to keep the heat in, as there is on Earth.
Without the atmospheric greenhouse effect, Earth would be approximately 33°C (59.4°F) cooler than it actually is. That would make most of the surface uninhabitable for humans. Agriculture as we know it would be more or less impossible if the average temperature was −18 °C.
Greenhouse gases act like a blanket, keeping the Earth warm by preventing some of the sun’s energy being re-radiated from Earth's warmed surface, back out into space. If we add more greenhouse gases to the atmosphere, the effect is like wrapping yourself in a thicker blanket: even less heat is lost. So how can we tell what effect CO2 is having on temperatures, and if the increase in atmospheric CO2 is really making the planet warmer?
The heat-trapping effects of CO2 and other greenhouse gases were discovered in the mid-19th century but we can do more sophisticated stuff these days. We can measure the heat energy going into Earth's climate system and that coming back out.
In 1970, NASA launched the IRIS satellite measuring infrared spectra. In 1996, the Japanese Space Agency launched the IMG satellite which recorded similar observations. Both sets of data were compared to discern any changes in outgoing radiation over the 26 year period (Harries et al. 2001). What they consistently found was a drop in outgoing radiation.
This change in outgoing radiation was consistent with theoretical expectations. Thus the Harries paper found "direct experimental evidence for a significant increase in the Earth's greenhouse effect". This result has been confirmed by subsequent papers using data from later satellites (Griggs & Harries 2004, Chen et al. 2007). In the same period, the amount of energy arriving from the sun has hardly changed at all.
When there is more energy coming in from the Sun than there is escaping back out to space, it should come as no surprise to learn that our climate is accumulating heat. The planet's total heat build up can be derived by adding up the heat content from the ocean, atmosphere, land and ice (Murphy et al. 2009). Just since 1998, the planet has accumulated heat energy equivalent to the yield of 3,260,000,000 Hiroshima-sized atomic bombs.
The primary greenhouse gases responsible for the trapping of heat – carbon dioxide (CO2), methane (CH4), water vapour, nitrous oxide and ozone – comprise around 1% of the air. The main components of the atmosphere – nitrogen and oxygen – are not greenhouse gases, because they are virtually transparent to long-wave or infrared radiation.
For our next piece of evidence, we must look at the amount of CO2 in the air. We know from bubbles of air trapped in ice cores that before the industrial revolution the amount of CO2 in the air was approximately 280 parts per million (ppm). In June 2013, the NOAA Earth System Research Laboratory in Hawaii announced that, for the first time in millions of years, the amount of CO2 in the air had gone above 400 ppm. It's now getting on for 420 ppm. That information gives us the next piece of evidence; CO2 has increased by 50% in the last 150 years.
The Smoking Gun
The final piece of evidence is ‘the smoking gun’, the proof that CO2 is causing the increase in temperature. CO2 traps energy at very specific wavelengths, while other greenhouse gases trap different wavelengths. In physics, these wavelengths can be measured using a technique called spectroscopy. Here’s an example:
Fig. 1. Spectrum of the greenhouse radiation measured at the surface. Greenhouse effect from water vapour is filtered out, showing the contributions of other greenhouse gases (Evans et al. 2006).
The graph shows different wavelengths of energy, measured at the Earth’s surface. Among the spikes you can see energy being radiated back to Earth by ozone (O3), methane (CH4), and nitrous oxide (N20). But the spike for CO2 on the left dwarfs all the other greenhouse gases, and tells us something very important: most of the energy being trapped in the atmosphere corresponds exactly to the wavelength of energy captured by CO2.
Summing Up
Like a detective story, first you need a victim, in this case the planet Earth: more energy is remaining in the atmosphere.
Then you need a method, and ask how the energy could be made to remain. For that, you need a demonstrable mechanism by which energy can be trapped in the atmosphere, and greenhouse gases provide that mechanism.
Next, you need a ‘motive’. Why has this happened? Because CO2 has increased by nearly 50% in the last 150 years and the increase is mostly from burning fossil fuels.
And finally, the smoking gun, the evidence that proves ‘whodunit’: energy being trapped in the atmosphere corresponds exactly to the wavelengths of energy captured by CO2.
The last point is what places CO2 at the scene of the crime. The investigation by science builds up empirical evidence that proves, step by step, that man-made carbon dioxide is causing the Earth to warm up.
Finally, the myth-creator refers to climate models as "concatenations of calculations you could do on a hand-held calculator". That statement demonstrates nothing more than a limited grasp of what models are and do and is rebutted at this post in our series.
Last updated on 9 July 2023 by John Mason. View Archives


JH @ 348
Thanks. I was working through this thread when I saw the ongoing discussion with Gail and could not resist putting in my two cents.
Bob Loblaw @ 349
I appreciate that the future increases may not be linear but it seems to me to be a good baseline with which to start. As soon as you extrapolate beyond a linear analysis my sense is that your are into the validity of the models. I personally do not have sufficient science background to understand the issues regarding their ability to predict the future.
I was hoping to see a Red Team Blue Team debate this but I do not think that is going to happen given the information I passed on from Climatewire regarding the Trump administration having second thoughts about same.
Earlier on in this thread there was a fascinating high level exchange going on between riccardo and PaulK who both clearly are physicists which unfortunately petered out. But it was fascinating to see these two go head to head. Although I could not understand the physics I did see the two of them being very honest with each other and I could get a sense of what was happening. It is this "give and take" that would be so fascinating to watch on a Red Team Blue Team discussion.
Global warming is a fact, but the title of this article is misleading and unhelpful to the cause. It's typical in any debate that both sides overstate their claims. I regularly see and hear the claim that humans are causing global warming, but that doesn't recognize the fact that the earth has been warming for the past 20K years. What is true is that humans are CONTRIBUTING to a climate change that is already underway. In some respects that is even more scary.
[TD] Your claim is incorrect. See the post on the wheelchair, and then the post on PAGES 2K. Then read Zeke Hausfather's post including a graph of natural versus human influences. And the Advanced tabbed pane on the post about the human fingerprint.
[JH] The use of all-caps constitutes shouting and is prohibited the the SkS Comments Policy.
As the mod's note, that claim is incorrect. The facts are, increasing carbon pollution has ended the era of stable climate.
Per Marsicek et al 2018:
And, per the discussion at Think Progress:
gwtalbott @352 links to the composite 500 million year Temperature of Planet Earth from Wikipedia. This plainly shows the last 20ky as warming to 11.7ky bp but then-after zero warming until recent times.
The graph does get a bit busy when it come up to the present day. The projections for RCP8.5 are about right but for some reason the Berkeley Earth Land&Ocean temperatures which somebody has added are rather misplaced. Although inexpertly applied, it is difficult not to interpret them as showing recent temperature as rising to just +0.4ºC (1960-90=0). The Berkely Earth annual anomalies (duly adjusted to 1960-90) have been knocking on +0.8ºC/+0.9ºC in recent years (the two figures dependant on the treatment of sea ice) and even decadal values are running at +0.6ºC. One wonders if the Berkely Earth additions were misplaced to discredit the RCP8.5 projections which are indeed scary - they suggest a protential global temperature for 2100 that hasn't been seen in over 10 millon years.
Could someone please help me make sense of this graph in this Greg Braden video? I believe a big part is that he is leaving out post-2000 data. Any help is appreciated
(At the 7:40 mark of this video)
https://www.youtube.com/watch?v=GxERTlbAo7g&feature=share
funkmystic @355,
It isn't just the post-2000 data that is missing from the graph shown by this Greg Braden character.
The data (and graph) is from Loehle and McCulloch (2008) 'Correction to: A 2000-Year Global Temperature Reconstruction Based on Non-Tree Ring Proxies'. It has thus corrected criticisms of an earlier paper (see this RealClimate critique) but not all criticisms.
Additional to that, the data actually ends at AD1935. (There's an ASCII file of the poltted data linked HERE.) Using a modern global surface record to fill in recent decades (BEST was to hand) and aligning it with the tag end of the Loehle and McCulloch data (1850-1935), the temperature for 2016 would be plotted at +1.2ºC which is plainly off the graph. In Greg-Braden-speak, that would be "two-times above the peak of the MWP." (In the video linked @355, good old Greg tells us this 9th-century MWP peak temperature was "three-times above where the anomaly is right now." )
Funkymystic @355 , alas nobody can help you make sense of Gregg Braden's explanation of the graph he shows in his video.
That's because Gregg Braden's ideas are way beyond California Crackpot.
The average climate-denialist grudgingly admits [well, most days of the week] that at least some of the modern rapid global warming is caused by higher level of CO2 in the atmosphere. But Braden is on another planet — he (in his video) claims that as CO2 goes up, it causes temperature to go down. That the CO2 causes cooling !! Marvellous how he can suggest that concept, while keeping a straight face.
Braden's past history also includes other beyond-crazy ideas. Which he tries to flesh out by displaying actual genuine scientific graphs . . . which he fails to interpret in a sane scientific way.
For instance, the ice-core temperature/CO2 charts he displays, are stated by him to apply to the whole Earth's climate, rather than just the local regions from which the cores were taken. Hence his nonsense about the so-called Medieval Warm Period (MWP) being hotter than today's worldwide climate. And he is obsessed by "natural cycles" (which cannot explain the recent rocketing planetary temperature). He gazes at cycles (whether regular or irregular, whether Milankovitch-related or not) and he seems oblivious to the basic physical fact that changes in planetary climate must be caused by actual physical effects — they don't just happen because "it's time for them to happen".
Funkymystic, please have good read through Climate Myth Number 12 "CO2 Lags Temperature" [which you will find via the Home Page here, top left portion]. That will explain the complex feedback link between global atmospheric CO2 and the advance & recession of "ice ages" & interglacials. You will soon see how Braden has made a colossal error in understanding things. Doubtless Mr Braden has had these things pointed out to him on various occasions — but it seems he is not interested in scientific truth.
Thanks so much MA Rodger and Eclectic!! Very helpful. Also, I think Braden should be added to the list of “Climate Misinformers” on this site. I hate to say it, but several people in my extended network of artists and musicians listen to him and think he’s telling the truth :/
There are a lot of dead links here that need to be fixed (e.g. Wang 2009, for which an archived copy can be found here: https://web.archive.org/web/20100226065928/http://www.agu.org/pubs/crossref/2009/2009JD011800.shtml)
The NOAA published record of global temperature change since 1880 shows two thirty year periods where global mean temperature did not rise beginning in around 1880 and around 1945. The recent record shows that another period of probable pause in global warming began shortly after 2000. There has been argument over the existence of a current pause, however, if a horizontal line is drawn forward from the mean temperature for 2002 it can be seen that there is about as much temperature activity below that line as above it to the present. The obvious question is why a pause in temperature rise during the continual rise in atmospheric CO2 level? Another point: have there been any experiments that measure the heat retention capability of the atmospheric level of CO2 rather than CO2 at a 100 percent level?
billev @360.
I think you need to explain what you mean by "If a horizontal line is drawn forward from the mean temperature for 2002 it can be seen that there is about as much temperature activity below that line as above it to the present."
If a horizontal line is drawn from 2002 through the NOAA data, only three of the fifteen following years lie below the 2002 average. So the "activity" is surely pretty-much all above that line. Of course, you may have a different definition for what you mean by "activity", or you could have drawn your line less than accurately.
Your other point about CO2 "heat retention capability", the radiative forcing of CO2 is well understood and evidentially based, experiments including atmospheric measurement (eg Feldman et al 2015).
Drawing a line between any arbitrarily chosen points will likely show exactly wat you want to see and is useless for figuring out what is happening in reality. Flat lines can be drawn at multiple time periods in the record, yet the overall trend is painfully obvious. There is not and there never was a pause, only variations around a trend that is resolutely up. Temperatures after the 1998 El Nino did not settle back to the pre-Nino level, the same thing is happening now following the 2016 El-Nino. The current US heat wave is showing us what the new normal is, as have all the extreme weather events accumulating everywhere in the world. The radiative properties of CO2 are very well known and the measured values for all altitudes match MODTRAN as well as one could wish for. Look it up.
Indeed. Billev's non-scientific "draw a line where I want to" approach does not replace proper statistical analysis. Tamino has recently posted yet another examination of the zombie "pause" meme.
https://tamino.wordpress.com/2018/06/30/weak-sauce-from-climate-deniers/
I would like to comment on the two statements in this article.
1. « The laws of physics tell us that without the atmosphere, the Earth would be approximately 33oC cooler than it actually is”.
Two ways to find this temperature difference are known. The first way is based on the consideration of the Earth as an perfect black body and the application of the Stefan-Boltzmann equation (radiant heat emitted from a unit of area is directly proportional to the temperature (in K) in the 4th power). Although the Earth radiates not quite an ideal black body (uneven surface structure and different chemical composition), with the use of certain averaging (values of emitted radiant heat and albedo) it is possible to obtain the "effective temperature of the Earth" 254-255 K. This value is compared with the average temperature of the Earth, which is very conditional (if we take into account the continuous temperature changes in time and in different places on the Earth's surface) is assumed equal to 287-288 K.
The second way is to compare average temperatures on the Earth and on the Moon
while the average temperature on the Moon is estimated as -18 ° C:
LINK
Obviously, to consider these semiempirical calculations based on the “laws of physics”, is at least a large exaggeration.
2. “The reason that the Earth is warm enough to sustain life is because of greenhouse gases in the atmosphere”.
And at this point, there is a substitution of concepts. In the previous statement we talked about the atmosphere in general, and here about "greenhouse gases." In the logical chain, the main link lacks - evidence that the capacity of the atmosphere to absorb heat is determined only by greenhouse gases.
[DB] Shortened and hyperlinked URL breaking page formatting
aleks @364,
(1) There are quite a few considerations when calculating the temperature of a no-GHG Earth. In the simplest calculation, the big variable would be albedo which is 0.12 on the moon and 0.3 on the GHG Earth. Assuming albedo can vary from zero to 0.3 yileds a S-B result of 278k down to 255k. (A no-GHG Earth could have a significantly different albedo to today's GHG Earth.) These simplest of calculations would yield lower temperatures if S-B is used for local temperature rather than global as the variations mean the hotter bits radiate more extra radiation than the colder bit reduced radiation.
The Moon temperature results from a body with wildly different rotation and lilely a greatly different non-GHG albedo. Strangely folk seem reluctant to provide an average lunar surface temperature. But if you use the numbers presented by Williams et al (2017) the average comes out as 253K.
The effect of a non-GHG atmosphere would add a little to heat loss it would presumably be a larger flux than today's GHG Earth's 17Wm^-2 flux as there would be a big temperature difference between the surface under the mid-day tropical sun and a fridged atmosphere, further reducing the non-GHG temperature. I would imagine that a non-GHG atmosphere would do little to move heat from the mid-day tropics to colder parts of the Earth.
The most involved approach to the calculation would be to turn a climate model onto the situation, something done by Lacis et al (2010). They find an average global temperature falling to 253K by 100 years after removing all GHGs (bar water vapour). The temperature is still falling even after 100 years. I would speculate that well beyond 100 years there will be a time when all the water in warmer latitudes which could be turned to water vapour would have fallen as snow over frozen latitudes, eventually emptying the tropical oceans and leaving a desert over the tropics (the only places warm enough for water) and thus water vapour would drop very greatly relative to the 100 year situation. Further, albedo would probably be higher due to the increased high latitude ice fields and oceanless tropics. All in all, I would suggest that the 100-year 253K temperature will reduce significantly more before equilibrium is reached.
(2) The "without the atmosphere" wording perhaps would be better put as "without GHGs." For no other reason, the assertion that a cold world would be "uninhabitable for humans" and "agriculture ... more or less impossible" would also apply to a "without the atmosphere" world how ever hot or cold it was.
Hello, this a very interesting website upon which I stumbled. very good technical information, which is of interest to me. Could you kindly field a few questions I have after reading this article?
1. You mentioned that earth is warmer than the moon, for example, due to the atmosphere. What impact does the molten core of the earth make in terms of habitability and temperature relative to the moon, which has a solid, rocky core?
2. In the radiance/wavelength graph, it's noted "Greenhouse effect from water vapor is filtered out". Can you comment as to why water vapor effects were filtered out? I have often heard that water vapor is the primary GHG.
Thank you for helping education
[PS] For geothermal heat flux, try here. Note it is measured in mW/m2. GHG is measured in W/m2 and solar input in 100s of W/m2. For Water vapour, try "Water vapour is the most powerful green gas"
Mlebied @366 ,
1. The upwelling heat from the Earth's radioactive core must reach "our" surface via a layer of insulating rocky crust, which slows the heat flow (and helps maintain the core in liquid form ~ and just as well, because otherwise we would lose the planetary magnetic field which largely protects us from high-energy charged particles). The flow of heat up to the surface is minuscule compared with the amount of visible light and infra-red which warms the Earth's surface. (It is far less than 1% of the radiant heating effect, and for practical purposes can be ignored. You will note that the extensive areas of deep ocean floor are maintaining a temperature close to freezing point, despite receiving heat from the core.)
2. As I see it, the diagram omits water vapor effect, to simplify & clarify the contributions made by the many "smaller" GHGasses ( CO2, CH4, etc ). As you will probably be aware, H2O is the "biggest" GHG for our planet, yet H2O is very much a special case.
Looking at the paper cited as origin of the diagram, you will see the approximate warming contributions [at tropopause level] are :-
H2O 90 watts/m2 CO2 50 w/m2 CH4 1.7
N2O 1.3 and tropospheric O3 1.3
In a sense, water vapor (although at our ambient temperatures being the major GHG) is not so much a "primary" GHG as rather a secondary GHG ~ because it is condensable as temperatures drop, and it automatically down-regulates its GHG effect, thus quite unlike the other gasses, which are "uncondensable" and remain active whatever the atmospheric temperature. (On another thread, you will find discussion of "Snowball Earth" conditions which would apply if H2O were the only GHG ~ hypothetical conditions which would result in a frozen planet, holding negligible amount of H2O in the air.)
In a whimsical way, I picture the GHG's as being a dog with a very large fluffy tail. The uncondensable gasses are the dog itself, while the H2O is the tail. The tail is larger than the dog ~ but it is the dog, not the tail, deciding which way the whole caboodle goes. [excuse poodle pun].
[PS] Fixed as per author request.
mlebied @366,
Here are some graphics that demonstrate the situation described @367.
(1) This SkS gaphic is a little simplified as albedo and the pre-industrial GHG are not accounted for. The tiny forcing from the Earth's molton core is only enough to be boosting Earth's global temperature by 0.07ºC, and that includes the feedback from water vapour (the 'very large fluffy dog's tail' @367).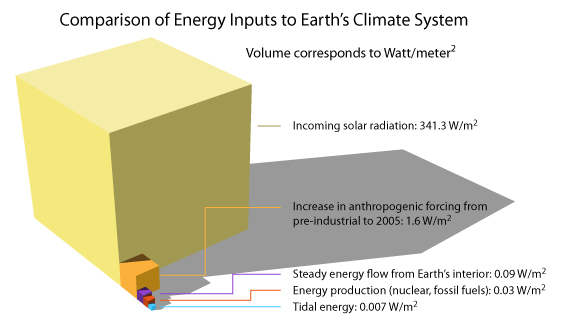
(2) The graphic below is Fig 2 from Lacis et al (2010). It shows what happens when all the long lived greenhouse gases are remoived. Note that the temperature is still falling after 50 years. In a second model, the run was stopped after 160 years as the oceans had begun to freeze down to the ocean floor.
Hey all, I need some help. Could you please help me debunk the following denial arguments?
http://freedom-articles.toolsforfreedom.com/scientists-refute-manmade-global-warming/?fbclid=IwAR29INEysNzz0Zqr-A2yfruHB7jhgfSX_-U1VW9T8-4Ol7UX-fTP5dkE-iE
http://freedom-articles.toolsforfreedom.com/manmade-co2-output-global-warming-hoax/?fbclid=IwAR0a1eoZpXe8xpoVTOT37HZXEahSY6smLHackdy2nX2EPkgmHyGGKh83Yrg
https://youtu.be/AFOGUrNsadM
Thank you
[PS] Looks like gish-gallop of long-debunked stuff. Use the search function on top left to find your way through the myths. (eg enter OISM). Even a google of "David Evans" will find articles on his failed predictions. However, if you are trying to convince someone whose denial is based on idealogy, (as the web side would suggest) you are likely to only get motivated reasoning and more denial. Ask your antagonist what data would change their mind. If they cannot answer, then you are dealing with a faith position and scientific reasoning will not help.
I've read much of this thread. I'm sitting on the fence because I can see and appreciate ideas from both sides. Here's my question: what percentage of climate change is due to human causes, and that being mostly carbon emissions? Of course the climate is changing and of course CO2 is greenhouse gas. But I haven't yet seen any convincing argument that it's almost entirely due to carbon emissions. My skepticism of GW due primarely from human causes comes from the work of Dr. Patrck Michaels: https://www.cato.org/people/patrick-michaels. He may be wrong but he's certainly not a "flake". His YouTube video at: https://www.youtube.com/watch?v=fA5sGtj7QKQ is very convincing- yet I'm not convinced- only keeping my mind open to all ideas. As to why I'm expecially interested in this subject- I may get into at some other time. I sense that few people have more qualifications to discuss the subject than Dr. Michaels.
JoeZ, here is a detailed factual debunking of Moore’s claims.
And here is Potholer54’s video debunking
JoeZ @370: You opine:
Wrong! There are hundreds of legitimate climate scientist throughout the world who are eminently more qualified than Patrick Michaels to speak on the topic.
Please read DeSmog's profile of Michaels:
https://www.desmogblog.com/patrick-michaels
I know people criticize Micahaels as a lobbyist - but that doesn't automatically make him a fraud. Maybe some people choose to be lobbyists for the firms they happen to agree with. All scientists must be looked at skeptically. Some are simply not very good scientists- some are sold out. Some who work for academia and government also may have a selfish interest to support their employer. So, what counts is what Michaels says. But, getting back to my question- I'd love to see a solid argument as to what percent of the GW problem is due to human causes, especially carbon emissions. Now, a subject seld raised regarding GW- is that humans have alterned much of the Earth. Vast areas once natural grasslands and forests have been destroyed- land that once sequestered carbon and produced oxygen. I should think that destruction must be a contributor to GW. And, if it's true that carbon emissions is the dominant cause of GW- in addition to cutting way back on fossil fuel burning then we should also all convert to vegetarianism, right? And mass transportation. I have no problem with those requirements. But, as a "professional forester"- I'm now hearing some environmentalists saying we must lock up all the forests so they can sequester the maximum carbon- forgetting that wood products are highly desirable, don't need fossil fuel to grow, and that any replacement for wood as a faw material will require the likes of cement and steel and plastic which all have higher carbon footprints. So, in conclusion, it seems to be that we really haven't proven definitively that its humanity causing the problem and if it is the case that we need to lock up forests. There are bad ideas on both sides of this debate- which I think, as a life long skeptic, is a good way to watch this important debate.
[JH] Sloganeering snipped.
JoeZ, I already linked you to detailed, point by point factual rebuttals of Michaels’s claims. Regarding percent of warming caused by humans, enter “attribution” in the Search field at the top left of this page. Among the results you will find this one. For a recent summary see chapter 3 of the CSSR’s report.
[PS] The links you provided were for Moore not Michaels.
'"Humanity cannot afford to ignore such clear signals," the U.S.-led team wrote in the journal Nature Climate Change of satellite measurements of rising temperatures over the past 40 years.
They said confidence that human activities were raising the heat at the Earth's surface had reached a "five-sigma" level, a statistical gauge meaning there is only a one-in-a-million chance that the signal would appear if there was no warming.'
https://www.voanews.com/a/scientists-evidence-for-man-made-global-warming-hits-gold-standard/4803955.html
[PS] Fixed link. Please learn how to do this yourself using the link button in the comment editor.