


 Arguments


Is Antarctica losing or gaining ice?
What the science says...
| Select a level... |
 Basic
Basic
|
 Intermediate
| |||
|
Antarctic sea ice extent has expanded at times but is currently (2023) low. In contrast, Antarctica is losing land ice at an accelerating rate and that has serious implications for sea level rise. |
|||||
Climate Myth...
Antarctica is gaining ice
"[Ice] is expanding in much of Antarctica, contrary to the widespread public belief that global warming is melting the continental ice cap." (Greg Roberts, The Australian)
At a glance
Who discovered the great, South Pole-straddling continent of Antarctica? According to the National Geographic, Captain Cook came within an estimated 80 miles of it in the late 1700s, but the three first 'official' discoveries all took place in 1820 by Russian, British and American teams of seafarers respectively.
Since that initial discovery, Antarctica has attracted and inspired researchers and explorers alike. It's a challenging place, fringed by sea-ice that, unlike the Arctic, has not steadily declined but whose extent fluctuates on a seasonal basis: it's currently (February 2023) at a very low coverage, but it can and does recover from such dips. Antarctic sea-ice is no great problem, with the exception of albedo-loss in low extent years: if it all melted, it would have no effect on global sea-levels. It's the stuff on land we need to focus upon.
The land of Antarctica is a continent in two parts, divided by the 2,000 m high Transantarctic Mountains. The two parts differ in so many respects that they need to be considered separately. East Antarctica, that includes the South Pole, has the far greater landmass out of the two, some 4,000 by 2,500 kilometres in size. Although its massive ice-sheet, mostly grounded above sea level, would cause 52 metres of sea level rise if it completely melted, so far it has remained relatively stable. Snow accumulation seems to be keeping in step with any peripheral melting.
In contrast, in the absence of ice, West Antarctica would consist of islands of various sizes plus the West Antarctic Peninsula, a long mountainous arm pointing northwards towards the tip of South America. The ice sheet overlying this mixed topography is therefore grounded below sea level in many places and that's what makes it far more prone to melting as the oceans warm up. Currently, the ice-sheet is buttressed by the huge ice-shelves that surround it, extending out to sea. These slow down the glaciers that drain the ice-sheet seawards.
The risk in West Antarctica is that these shelves will break up and then there will be nothing to hold back those glaciers. This has already happened along the West Antarctic Peninsula: in 1998-2002 much of the Larsen B ice-shelf collapsed. On Western Antarctica's west coast, the ice-sheet buttressing the Thwaites Glacier – a huge body of ice with a similar surface area to the UK - is a major cause for concern. The glacier, grounded 1,000 metres below sea level, is retreating quickly. If it all melted, that would raise global sea levels by 65 centimetres.
Such processes are happening right now and may not be stoppable - they certainly will not be if our CO2 emissions continue apace. But there’s another number to consider: 615 ppm. That is the CO2 level beneath which East Antarctica’s main ice sheet behaves in a mostly stable fashion. Go above that figure and the opposite occurs - major instability. And through our emissions, we’ve gone more than a third of the way there (320 to 420 ppm) since 1965. If we don’t curb those emissions, we’ll cross that line in well under a century.
Please use this form to provide feedback about this new "At a glance" section. Read a more technical version below or dig deeper via the tabs above!
Further details
Arguments that we needn't worry about loss of ice in the Antarctic because sea ice is growing or even that sea ice in the Antarctic disproves that global warming is a real concern hinge on confusion about differences between sea and land ice, and what our best information about Antarctic ice tells us.
As well, the trend in Antarctic sea ice is not a permanent feature, as we'll see. But let's look at the main issues first.
- Sea ice doesn't play a role in sea level rise or fall.
- Melting land ice contributes to sea level rise.
- The net, total behavior of all ice in the Antarctic is causing a significant and accelerating rise in sea level.
Antarctic sea ice is ice which forms in salt water mostly during winter months. When sea ice melts, sea level does not change.
Antarctic land ice is the ice which has accumulated over thousands of years in Antarctica by snowfall. This land ice is stored ocean water that once fell as precipitation. When this ice melts, the resulting water returns to the ocean, raising sea level.
What's up with Antarctic sea ice?
At both poles, sea ice grows and shrinks on an annual basis. While the maximum amount of cover varies from year to year, there is no effect on sea level due to this cyclic process.
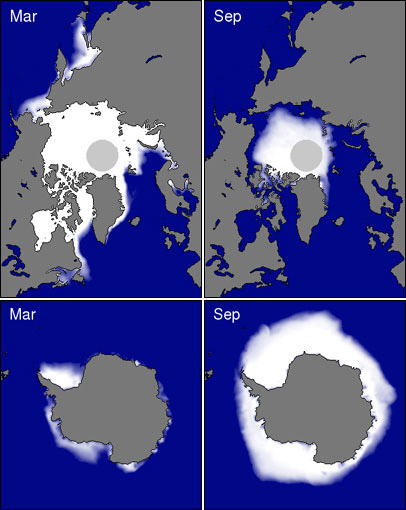
Figure 1: Coverage of sea ice in both the Arctic (Top) and Antarctica (Bottom) for both summer minimums and winter maximums. Source: National Snow and Ice Data Center
Trends in Antarctic sea ice are easily deceptive. For many years, Antarctic sea was increasing overall, but that shows signs of changing as ice extent has sharply declined more recently. Meanwhile, what's the relationship of sea ice to our activities? Ironically, plausible reasons for change may be of our own making:
- Ozone levels over Antarctica have dropped causing stratospheric cooling and increasing winds which lead to more areas of open water that can be frozen (Gillett & Thompson 2003, Thompson & Solomon 2002, Turner et al. 2009).
- The Southern Ocean is freshening because of increased rain and snowfall as well as an increase in meltwater coming from the edges of Antarctica's land ice (Zhang 2007, Bintanja et al. 2013). Together, these change the composition of the different layers in the ocean there causing less mixing between warm and cold layers and thus less melted sea and coastal land ice.
Against those factors, we continue to search for final answers to why certain areas of Antarctic sea ice grew over the past few decades (Turner et al. 2015).
More lately, sea ice in southern latitudes has shown a precipitous year-on-year decline (Parkinson 2019). While there's a remaining net increase in annual high point sea ice, the total increase has been sharply reduced and continues to decline.
How is Antarctic land ice doing?
We've seen that Antarctic sea ice is irrelevant to the main problem we're facing with overall loss of ice in the Antarctic: rising sea level. That leaves land ice to consider.

Figure 2: Total Antarctic land ice changes and approximate sea level contributions using a combination of different measurement techniques (IMBIE, 2017). Shaded areas represent measurement uncertainty.
Estimates of recent changes in Antarctic land ice (Figure 2) show an increasing contribution to sea level. Between 1992 and 2017, the Antarctic Ice Sheets overall lost 2,720 giga-tonnes (Gt) or 2,720,000,000,000 tonnes into the oceans, at an average rate of 108 Gt per year (Gt/yr). Because a reduction in mass of 360 Gt/year represents an annual global-average sea level rise of 1 mm, these estimates equate to an increase in global-average sea levels by 0.3 mm/yr.
There is variation between regions within Antarctica as can be seen in Figure 2. The West Antarctic Ice Sheet and the Antarctic Peninsula Ice Sheet are losing a lot of ice mass, at an overall increasing rate. The East Antarctic Ice Sheet has grown slightly over the period shown. The net result is a massive loss of ice. However, under a high-emissions scenario, ice-loss from the East Antarctic ice-sheet is expected to be a much greater in the decades after 2100, as reported recently by Stokes et al. (2022). That’s a scenario we must avoid at all costs.
Takeaway
Independent data from multiple measurement techniques (explained here) show the same thing: Antarctica is losing land ice as a whole and these losses are accelerating. Meanwhile, Antarctic sea ice is irrelevant to what's important about Antarctic ice in general.
Last updated on 14 February 2023 by John Mason. View Archives


bozzza @424,
For one theory see:
http://forum.arctic-sea-ice.net/index.php/topic,724.msg60178.html#msg60178
I believe that the current downward fluctuation in Antarctic Sea Ice Extent if likely associated with the influence of our currently strong El Nino on the average location of the Amundsen Bellingshausen Sea Low.
Cheers, Jim: I googled "Amundsen Bellingshausen Sea Low" and found one of the first articles, " Study shows acceleration in melting of Antarctic ice shelves" and found the below to be a most interesting paragraph...
..there seems to be conflict amongst the talking heads so many thanks for keeping the debate informative!
@ 426: the trend line could actually be getting steeper right this minute, apparently, ...according to the information in the graph itself [Trend line(regression 1979-2011) = 0.015 p.a.] could it not?
bozzza @428.
Do note that ice shelves and sea ice are not the same thing. (And also this thread is properly about ice sheets which is something else again entirely.)
bozzza @429.
While it is possible to consider fitting an upward curve to the graph @426 in place of the linear trend, the cause of the increases in Antarctic SIA/SIE would be worth looking at first.
Like the loss of ice from Antarctica, the increase of Antarctic SIA/SIE is the product of two competing trends. Parts of the ocean are increasingly icy but other parts are losing ice. Also a lot less is known prior to the arrival of good satellite data in 1979. Fan et al (2014) suggests that ice may have been on an earlier downward trend, shrinking markedly up to 1979, strains perhaps of long-term natural variation at work? While other, for instance recently Hansen et al (2015), see large levels of sea ice growth in Antarctica as a by-product of AGW, and perhaps a by-product we should be very worried about.
So, while fitting anything is possible, a reasoned fitment would be preferable to one that simply suits the mood of the author. In that regard, the linear trend provides a simple gauge of the situation, nothing more.
Recent study shows mass balance increasing.
http://phys.org/news/2015-10-mass-gains-antarctic-ice-sheet.html#jCp
Worth mentioning in the OP as an update? Or wait for the study to become available?
[JH] Link activated.
Like many of the SkS Rebuttal articles, the OP is in need of update. The all-volunteer SkS author team has embarked on an intitiative to update the Rebuttals.
"A new NASA study says that an increase in Antarctic snow accumulation that began 10,000 years ago is currently adding enough ice to the continent to outweigh the increased losses from its thinning glaciers.
The research challenges the conclusions of other studies, including the Intergovernmental Panel on Climate Change’s (IPCC) 2013 report, which says that Antarctica is overall losing land ice."
http://www.nasa.gov/feature/goddard/nasa-study-mass-gains-of-antarctic-ice-sheet-greater-than-losses
Does this make the myth true?
[JH] Link activated.
barry @431 & peter @432.
Be mindful that this is not the first time in which Zwally has proclaimed the ERS & ICESat data as showing a net rise in Antarctic ice. A workshop paper in 2012 (abstact & video with gap in coverage - here) also resulted in calls here at SkS for revision to this post (along with more forceful demands elsewhere by the likes of the Lord Protector of Wattsupia).
This time round, the journal article is so hot-off-the-press it has yet to appear on-line so it's a little early to be getting all excited. Until the new finding is appraised, best we make do with Hanna et al (2013) which is a paper co-authered by Zwally. It broadly discusses work in-hand plus future developments before concluding:-
Figure 1 from Hanna et al (2013) demonstrates this 'emergence'.
Figure 1 caption. Summary of Antarctic and Greenland mass-rate estimates. In the studies published before 20122 (left) and in 2012 (right) each estimate of a temporally-averaged rate of mass change is represented by a box whose width indicates the time period studied, and whose height indicates the error estimate. Single-epoch (snapshot) estimates of mass balance are represented by vertical error bars when error estimates are available, and are otherwise represented by asterisks. 2012 studies comprise IMBIE combined estimates2 (solid lines), and estimates by Sasgen and others16,20 and King and others11 (dashed lines), Zwally and others19 (dot-dashed lines), Harig and Simons89 and Ewert and others90 (dotted lines).
Note that it is not just a need to reconcile this most recent Zwally paper with the other methods employed to assess East Antarctic ice balance. Both the linked pages @431&432 quote Zwally pointing out that these ERS & ICESat data have to be also reconciled with SLR data.
And my answer to peter's question "Would this Zwally paper make the myth true?" that answer would be - "No". ERS & ICESat data continue to provide some evidential support for the 'Antarctica not losing ice' position which remains strongly a myth when presented as unequivocal fact, and doubly so when the mythical Antarctica ice balance is then presented as some natural global thermometer. Indeed, does it even work as a thermometer for Antarctica?
@ 431 & 432 (barry & peter),
Re: phys.org/news/2015-10-mass-gains-antarctic-ice-sheet.html#jCp
I read it a bit differently:
Although the article states:
A new NASA study says that an increase in Antarctic snow accumulation that began 10,000 years ago is currently adding enough ice to the continent to outweigh the increased losses from its thinning glaciers.
This should be put into context, as Zwally also says that within a couple of decades (should the current loss rate remain) the losses will catch up to the gainings: "If the losses of the Antarctic Peninsula and parts of West Antarctica continue to increase at the same rate they've been increasing for the last two decades, the losses will catch up with the long-term gain in East Antarctica in 20 or 30 years—I don't think there will be enough snowfall increase to offset these losses."
Am I correct to assume (if this study is correct), that net ice gain would only occur if we reduce the curret rate of ice loss?
Regarding MA Rodgers' response in 433... "Be mindful that this is not the first time in which Zwally has proclaimed the ERS & ICESat data as showing a net rise in Antarctic ice."
What happened with the previous claim? Was it shown to be in error in the 2013 paper co-authored by Zwally?
"Does this make the myth true?"
Myth? It's a new study. It's a good information service that points out uncertainties and alternative opinion. Such opinion may be weighed honestly against other opinion. The results here are a minority view (along with previous Zwally paper). Would it be good to give a robust appraisal of the topic, or reject alternative views if they interfere with the messaging?
Mod reply says SkS is updating old rebuttal posts. I like robust posts that include uncertainties, indicate alternative opinion and sum up honestly. I'm fairly confident that will happen.
(Thanks for the reply, JH)
[JH] You're welcome.
The issue of whether Anatartica is gaining or losing land ice is fairly complex and the all-volunteer author team is busy sorting through all of the recent research on this topic.
As I understand it, the GRACE results from NASA measure differences in gravitational pull to determine the mass of ice while the Zwally study (also NASA run) measures the height of the ice/snow cover, estimates how much of that height is ice vs snow, and then computes the resulting ice mass.
Is there evidence of significant error/uncertainty in the GRACE data? If not, wouldn't it be inherently more reliable than Zwally's method? Basically, Zwally's study gets to 'net ice gain' by making different assumptions about the amount of snow cover. Assume more snow and we're back to 'net ice loss'. Yet GRACE doesn't have that issue at all... it reacts to gravitational pull. Differences in ice/snow elevation would have a neglible impact on gravitational pull. Only the total mass would matter... so how could it be showing less gravitational pull if there were more mass?
Recommended supplemental reading:
Is Antarctica Gaining or Losing Ice? Hint: Losing., Phil Plait, Bad Astronomy, Slate, Nov 3, 2015
From the dictionary for Myth:
1. a person or thing having only an imaginary or unverifiable existence
2. an unfounded or false notion
With this new study and other earlier ones from Nasa, and even the continual record Antarctic sea ice extent lately, Myth isn't the right word for the statement "Antarctica is gaining ice". It's in fact got some fairly substantial factual backing.
At this point Zwally et al is quite the outlier, both from GRACE data alone and from the collection of other Antarctic mass balance work.
We're going to have to wait and see how the science progresses. At this point, however, most of the evidence indicates some mass loss from the Antarctic continent, Zwally et al is inconsistent with both the GRACE gravity data and estimates of the sea level rise budget, and we need to be careful not to fall prey to 'single-study syndrome'.
The Zwally et al (2015) pdf.
If Antarctica really has been gaining mass, we are in deeper doodoo than we knew, because sea level has been rising fast even without any contribution from Antarctica. As the years pass, Antarctica's lowering of sea level (by accumulating water as snow and ice) will decrease until eventually (20 years Zwally estimated) Antarctica will start to contribute to sea level rise. So I very much hope Zwally's new study turns out to be wrong.
The wind patterns around Antarctica have been changing over long term observation: the fact that the southern hemisphere is colder than the northern is the start of all methodical theory regarding climate change.
I can't believe Venus ever had water but if it did the science says our oceans will never boil away as there are too many negative feedbacks, the presence of Antarctica obviously being the main one!
It is common to assume that the Earth's crust is solid. It is not. The NASA study released 10/30/2015 concludes that Antarctica has been gaining ice mass for over 10,000 years. That mass of ice has pushed parts of the continent below sea level. It follows that the mantle around Antarctica should be similarly pushed up. This is all a dynamic process which has a long lag time. In short, Antarctica could be gaining ice mass and still causing the oceans to rise.
Venus is a very poor model for the Earth as also is Mars. Venus has four times the amount of nitrogen as the Earth which indicates that it started with an atmosphere of at least four times that of Earth. Even today, with an atmosphere of 96% CO2, the average temperature at an altitude of 55 km, which corresponds to 6 km on Earth, is only 27 degrees C (80.6F). Venus also receives twice the radiation from the sun as the Earth.
[PS] If read the papers, you will see that GIA is very much part of calculation (and a key uncertainty)
Please be careful to ensure comments do not drift offtopic. Nothing further on mars/venus here please.
dale38 @444, as I understand it, the study to which you refer (Zwally et al, 2015) estimates the bedrock under the East Antarctic Ice Sheet is sinking, whereas most other models and observations suggest that it is falling.
As to sea level rise due to displacement of mantle, because rock is denser than ice, more water must be drawn from the sea to displace the mantle than the volume of the mantle displaced. It follows that accumulation of ice must result in a fall in sea level, and vice versa.
My understanding is that the Arctic air temperatures are warming faster than the Antarctic. We know that most of the anthropogenic CO2 is released in the northern hemisphere, according to this NASA model https://www.nasa.gov/press/goddard/2014/november/nasa-computer-model-provides-a-new-portrait-of-carbon-dioxide/#.Vnf2ChWLTIU
CO2 lasts in the air for hundreds of years, but mixing of air between NH and SH is rather slow. Is there an appreciable lag between CO2 levels in the NH and those in the SH, and if so is it enough to contribute to the difference in warming between the Arctic and Antarctic?
Richard Lawson @446.
There is a lag but it measures months and does little more than ensure the annual cycle is missing over Antarctica. There is a graph of a model & there are fancy videos of it if you look. The fanciest is this NOAA graphic but that is a bit too fancy so it is less good at showing the lag that it should be.
Richard Lawson @446, MA Rodger is correct that the lag time between NH and SH is quite small, but I believe he understates it. To properly appreciate it, here are the annual average CO2 concentrations for four stations posted by Ferdinand Engelbeen in a discussion at Climate Etc:
Drawing a horizontal line at any level shows the South Pole Concentration to lag the Mauna Loa concentration by approximately 1.5 years. The SH lag to the NH will be about the same, slightly less for the lag to the global average. The model for the graph to which MA Rodger links uses a lag of 22 months for SH to NH. As MA Rodger notes, that is too small a lag to result in appreciable forcing differences, and makes almost no contribution to the different temperature histories.
The most probable explanation of the different temperature histories is geographical. Specifically while the Arctic is sea level sea ice surrounded by land, the Antarctic is a very high altitude plateau of land ice surrounded by ocean. These differences have the effect that:
1) The Antarctic climate is significantly isolated from the global climate by circumpolar winds and currents, actin as an insulating barrier against heat transfer to the Antarctic;
2) The high altitude of the Antarctic plateau keeps local weather conditions below freezing throughout the summer, limiting albedo changes in summer;
3) The ocean surrounding the Antarctic tends to melt any snowfall, limiting any albedo changes in winter (a factor partly offset by changes in the extent of sea ice).
In contrast, in the Arctic, Atlantic and to a lesser extent Pacific waters are actively channelled into the Arctic, thereby connecting Arctic temperature responses to those in the NH tropics and mid-latitudes. Arctic sea ice melts in summer to very high latitudes, and gains melt ponds and polynaya over its full extent. The sub arctic snow in winter primarilly falls on land where it can remain in situ and have a major contribution to albedo effects. The net effect is a much stronger albedo feedback in the NH than in the SH, enhance because the large land mass in the NH results in larger temperature fluctuations in any event.
Richard... There's also a really good animated graph from Carbon Tracker that shows the NH/SH trends in a really cool way. LINK
MA, Tom and Rob, Many thanks for your helpful responses, particularly for the beautiful dance of CO2 levels in Rob's link.