


 Arguments


Is the CO2 effect saturated?
What the science says...
| Select a level... |
 Basic
Basic
|
 Intermediate
|
 Advanced
| ||||
|
The notion that the CO2 effect is 'saturated' is based on a misunderstanding of how the greenhouse effect works. |
|||||||
Climate Myth...
CO2 effect is saturated
"Each unit of CO2 you put into the atmosphere has less and less of a warming impact. Once the atmosphere reaches a saturation point, additional input of CO2 will not really have any major impact. It's like putting insulation in your attic. They give a recommended amount and after that you can stack the insulation up to the roof and it's going to have no impact." (Marc Morano, as quoted by Steve Eliot)
At-a-Glance
This myth relies on the use (or in fact misuse) of a particular word – 'saturated'. When someone comes in from a prolonged downpour, they may well exclaim that they are saturated. They cannot imagine being any wetter. That's casual usage, though.
In science, 'saturated' is a strictly-defined term. For example, in a saturated salt solution, no more salt will dissolve, period. But what's that got to do with heat transfer in Earth's atmosphere? Let's take a look.
Heat-trapping by CO2 in the atmosphere happens because it has the ability to absorb and pass on infra-red radiation – it is a 'greenhouse gas'. Infra-red is just one part of the electromagnetic spectrum, divided by physicists into a series of bands. From the low-frequency end of the spectrum upwards, the bands are as follows: radio waves, microwaves, infrared, visible light, ultraviolet, X-rays, and gamma rays. Gamma rays thus have a very high-frequency. They are the highest-energy form of radiation.
As our understanding of the electromagnetic spectrum developed, it was realised that the radiation consists of particles called 'photons', travelling in waves. The term was coined in 1926 by the celebrated physicist Gilbert Lewis (1875-1946). A photon's energy is related to its wavelength. The shorter the wavelength, the higher the energy, so that the very high-energy gamma-rays have the shortest wavelength of the lot.
Sunshine consists mostly of ultraviolet, visible light and infra-red photons. Objects warmed by the sun then re-emit energy photons at infra-red wavelengths. Like other greenhouse gases, CO2 has the ability to absorb infra-red photons. But CO2 is unlike a mop, which has to be wrung out regularly in order for it to continue working. CO2 molecules do not get filled up with infra-red photons. Not only do they emit their own infra-red photons, but also they are constantly colliding with neighbouring molecules in the air. The constant collisions are important. Every time they happen, energy is shared out between the colliding molecules.
Through those emissions and collisions, CO2 molecules constantly warm their surroundings. This goes on all the time and at all levels in the atmosphere. You cannot say, “CO2 is saturated because the surface-emitted IR is rapidly absorbed”, because you need to take into account the whole atmosphere and its constant, ongoing energy-exchange processes. That means taking into account all absorption, all re-emission, all collisions, all heating and cooling and all eventual loss to space, at all levels.
If the amount of radiation lost to space is equal to the amount coming in from the Sun, Earth is said to be in energy balance. But if the strength of the greenhouse effect is increased, the amount of energy escaping falls behind the amount that is incoming. Earth is then said to be in an energy imbalance and the climate heats up. Double the CO2 concentration and you get a few degrees of warming: double it again and you get a few more and on and on it goes. There is no room for complacency here. By the time just one doubling has occurred, the planet would already be unrecognisable. The insulation analogy in the myth is misleading because it over-simplifies what happens in the atmosphere.
Please use this form to provide feedback about this new "At a glance" section. Read a more technical version below or dig deeper via the tabs above!
Further details
This myth relies on the use of a word – saturated. When we think of saturated in everyday use, the term 'soggy' comes to mind. This is a good example of a word that has one meaning in common parlance but another very specific one when thinking about atmospheric physics. Other such words come to mind too. Absorb and emit are two good examples relevant to this topic and we’ll discuss how they relate to atmospheric processes below.
First things first. The effect of CO2 in the atmosphere is due to its influence on the transport of 'electromagnetic radiation' (EMR). EMR is energy that is moving as x-rays, ultraviolet (UV) light, visible light, infrared (IR) radiation and so on (fig. 1). Radiation is unusual in the sense that it contains energy but it is also always moving, at the speed of light, so it is also a form of transport. Radiation is also unusual in that it has properties of particles but also travels with the properties of waves, so we talk about its wavelength.
The particles making up radiation are known as photons. Each photon contains a specific amount of energy, and that is related to its wavelength. High energy photons have short wavelengths, and low energy photons have longer wavelengths. In climate, we are interested in two main radiation categories - firstly the visible light plus UV and minor IR that together make up sunshine, and secondly the IR from the earth-atmosphere system.
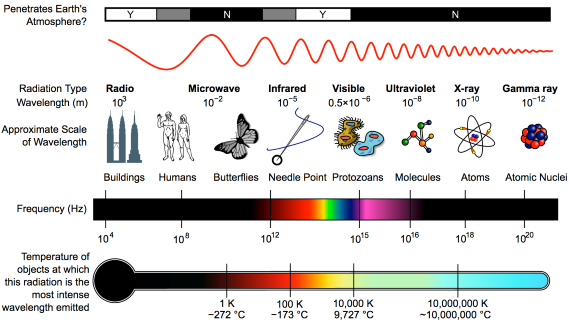
Fig. 1: diagram showing the full electromagnetic spectrum and its properties of the different bands. Image: CC BY-SA 3.0 from Wikimedia.
CO2 has the ability to absorb IR photons – it is a 'greenhouse gas'.So what does “absorb” mean, when talking about radiation? We are all familiar with using a sponge to mop up a water spill. The sponge will only absorb so much and will not absorb any more unless it's wrung out. In everyday language it may be described, without measurements, as 'saturated'. In this household example, 'absorb' basically means 'soak up' and 'saturated' simply means 'full to capacity'. Scientific terms are, in contrast, strictly defined.
Now let's look at the atmosphere. The greenhouse effect works like this: energy arrives from the sun in the form of visible light and ultraviolet radiation. A proportion reaches and warms Earth's surface. Earth then emits the energy in the form of photons of IR radiation.
Greenhouse gases in the atmosphere, such as CO2 molecules, absorb some of this IR radiation, then re-emit it in all directions - including back to Earth's surface. The CO2 molecule does not fill up with IR photons, running out of space for any more. Instead, the CO2 molecule absorbs the energy from the IR photon and the photon ceases to be. The CO2 molecule now contains more energy, but that is transient since the molecule emits its own IR photons. Not only that: it's constantly colliding with other molecules such as N2 and O2 in the surrounding air. In those collisions, that excess energy is shared with them. This energy-sharing causes the nearby air to heat up (fig. 2).
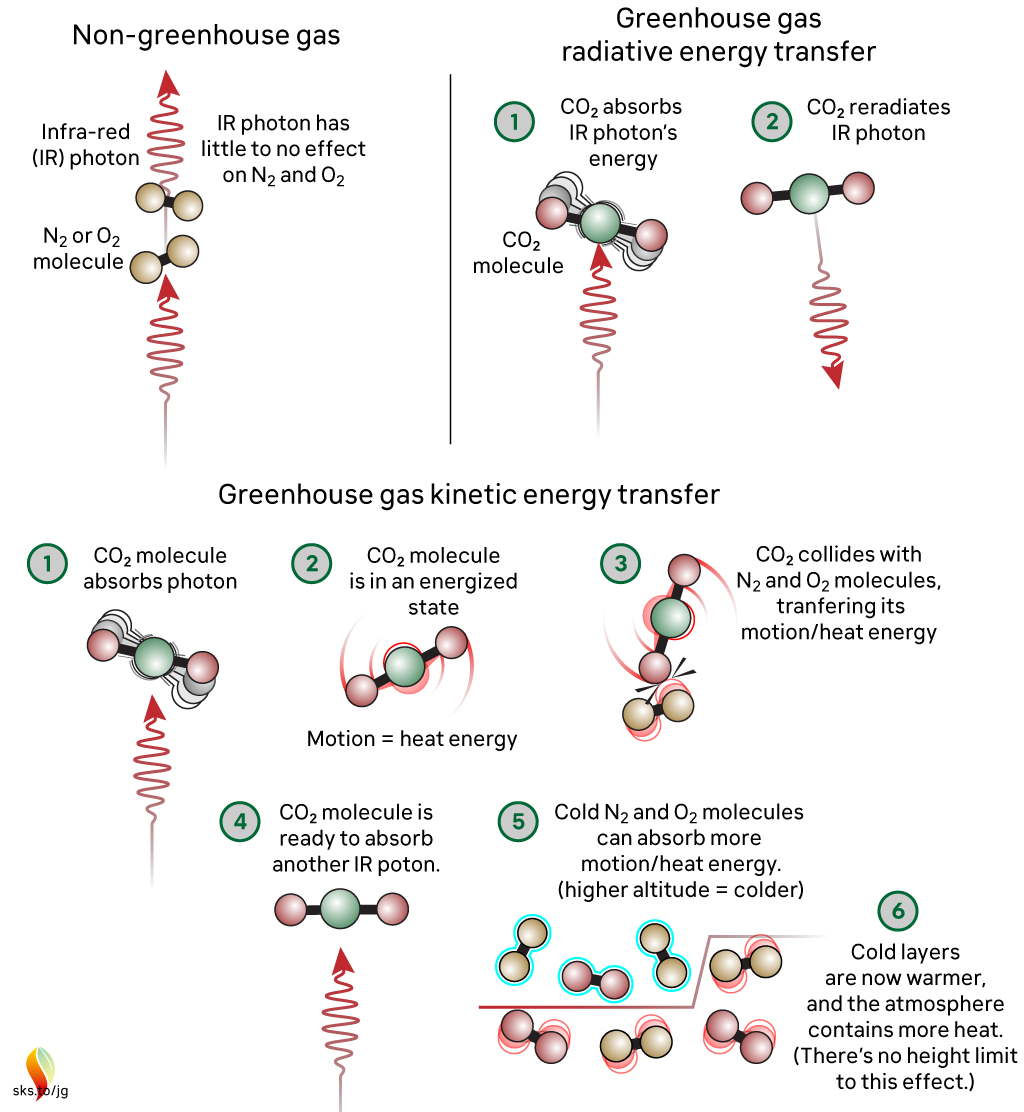
Fig. 2: The greenhouse effect in action, showing the interactions between molecules. The interactions happen at all levels of the atmosphere and are constantly ongoing. Graphic: jg.
The capacity for CO2 to absorb photons is almost limitless. The CO2 molecule can also receive energy from collisions with other molecules, and it can lose energy by emitting IR radiation. When a photon is emitted, we’re not bringing a photon out of storage - we are bringing energy out of storage and turning it into a photon, travelling away at the speed of light. So CO2 is constantly absorbing IR radiation, constantly emitting IR radiation and constantly sharing energy with the surrounding air molecules. To understand the role of CO2, we need to consider all these forms of energy storage and transport.
So, where does 'saturation' get used in climate change contrarianism? The most common way they try to frame things is to claim that IR emitted from the surface, in the wavelengths where CO2 absorbs, is all absorbed fairly close to the surface. Therefore, the story continues, adding more CO2 can’t make any more difference. This is inaccurate through omission, because either innocently or deliberately, it ignores the rest of the picture, where energy is constantly being exchanged with other molecules by collisions and CO2 is constantly emitting IR radiation. This means that there is always IR radiation being emitted upwards by CO2 at all levels in the atmosphere. It might not have originated from the surface, but IR radiation is still present in the wavelengths that CO2 absorbs and emits. When emitted in the upper atmosphere, it can and will be lost to space.
When you include all the energy transfers related to the CO2 absorption of IR radiation – the transfer to other molecules, the emission, and both the upward and downward energy fluxes at all altitudes - then we find that adding CO2 to our current atmosphere acts to inhibit the transfer of radiative energy throughout that atmosphere and, ultimately, into space. This will lead to additional warming until the amount of energy being lost to space matches what is being received. This is precisely what is happening.
The myth reproduced at the top – incorrectly stating an analogy with roof insulation in that each unit has less of an effect - is misleading. Doubling CO2 from 280 ppm to 560 ppm will cause a few degrees of warming. Doubling again (560 to 1130 ppm) will cause a similar amount of additional warming, and so on. Many doublings later there may be a point where adding more CO2 has little effect, but recent work has cast serious doubt on that (He et al. 2023). But we are a long, long way from reaching that point and in any case we do not want to go anywhere near it! One doubling will be serious enough.
Finally, directly observing the specific, global radiative forcing caused by well-mixed greenhouse gases has - to date - proven elusive. This is because of irregular, uncalibrated or limited areal measurements. But very recently, results have been published regarding the deep reinterrogation of years of data (2003-2021) from the Atmospheric Infrared Sounder (AIRS) instrument on NASA's Aqua Satellite (Raghuraman et al. 2023). The work may well have finally cracked the long-standing issue of how to make finely detailed, consistent wavelength-specific measurements of outgoing long-wave radiation from Earth into space. As such, it has opened the way to direct monitoring of the radiative impact (i.e. forcing + feedback) of greenhouse gas concentration changes, thereby complimenting the Keeling Curve - the longstanding dataset of measured CO2 concentrations, down at the planet's surface.
Note: Several people in addition to John Mason were involved with updating this basic level rebuttal, namely Bob Loblaw, Ken Rice and John Garrett (jg).
Last updated on 31 December 2023 by John Mason. View Archives


I understand you're saturation point now. Just be aware of your phrasing because this is often used by climate deniers to suggest there is no greenhouse effect. Relative to your questions about other bands outside of the 667cm-1 range, I think most of the other bands are overwhelmed by WV. It's that 667 window which has the primary scattering effect.
David Thorn @425, the specific absorption frequencies for different isotopologues of CO2 are available at Hitran (requires registration to download data). The difference in isotopes will make a difference, if only because the different isotopes will have a different velocity distribution at different temperatures due to differences in mass, and hence different doppler broadening patterns. This can be illustrated by this listing of relevant frequencies of a particular transition for different isotopologues:
Note that the transition in question is at too high a frequency to be relevant to the atmospheric greenhouse effect, but the small differences shown are likely to be typical at lower frequencies as well, although I have not specifically checked.
In any event, Hitran allows the downloading of a composite absorption spectrum for all isotopologues of CO2 at relative concentrations as found in the atmosphere; and it is likely that this is the data used in LBL models of radiation. Broad band models of radiation, and Global Circulation Models typically use lower resolution data in which the differences are not likely to be significant.
Bogfetto,
When you make posts with many questions if in impossible to answer them all in detail. Please ask one question at a time so that they can be answered. After the first misconception is cleared up we can then move on to the next misconception.
I will take a single example form your post to Tom Curtis. You claim:
"The only way to increase temperature of a radiating body, is to increase the temperature of the heat source heating it. And an increase in temperature always have to be initiated by a rising temperature of the radiating body, never by a decreasing temperature (and decreasing intensity) in a colder body heated by the hotter radiating body."
When I got out of bed this morning it was cold. I put on a cold shirt. My surface temeprature increased even though my rate of heat production remained the same. This is experimental evidence that your clain that " an increase in temperature always have to be initiated by a rising temperature of the radiating body" is incorrect.
It appears that you have a basic misunderstanding of how heat is transferred. I suggest you reread the posts you have questioned, and the OP, and ask questions about what seems off to you. Ask about one or two imortant items first. As those misconceptions are cleared up you will start to understand the basics. When you have the basics incorrect it is impossible to understand how the atosphere works.
Bogfetto @429:
1)
First, while the second sentence is entirely ungrammatical and difficult to interpret, if I interpret it as saying, "Your argument is based on [the fact] that this increase in volume is caused by an increase of a powerful heat absorber" your claim is false, and you have not understood my argument, or its basis at all. It is clear that it misrepresents my argument in that I limit the discussion to situations in which the mean altitude of radiation to space is lower than the tropopause. If it rises to the tropopause (and assuming the temperature structure with altitude remains constant), further increases will initially have no effect in temperature, and then reduce the Global Mean Surface Temperature. That despite the fact that the volume of gas below the mean altitude of radiation to space will continue to increase. In practise, the same increases in CO2 that increases the mean altitude in radiation to space will also cool the stratosphere, and sufficient CO 2 increase to raise the mean altitude of radiation to space into the current stratosphere may well cool the stratosphere sufficiently that it has a declining temperature with altitude, in which case that will result in further surface warming.
This discussion should make it very clear that my argument is based on the temperature of the mean altitude of radiation to space, something laid out very specifically in my article on the topic. I suggest you move further discussion of that particular point to that article, and make sure you read it before you do.
I will note that on rereading my comment from which you took the quotation, it was very clear and very specific. Your misinterpretation has no justification in the text, and is based entirely on your attempt to shoe horn that discussion into your very rudimentary grasp of physics. If you are going to persist in that behaviour, save us all some time and end the discussion now.
2)
If you have a radiant filament (such as in a light bulb) fed with a constant power source, and with a constant resistance, but place that filament in a gas that gradually corrodes its surface, thereby reducing emissivity, the filament will increase in temperature over time even though the amount of energy radiated will remain constant. That is a common place experience in cold climates where low emissivity films are placed over windows to increase the internal temperature while decreasing the power used in heating.
This is an analog the the greenhouse effect in which the increase in CO2 reduces the effective emissivity of the Earth over time in the IR bandwidth while not reducing the emissivity in visible light bandwidths (and therefore not decreasing the incoming energy). The result will be that:
When we compare the quasi-eqilibrium states before and after the introduction of the increased CO2:
1) The IR radiation to space will be the same in both cases (ignoring albedo feedbacks);
2) A reduced proportion of the IR radiation to space will come from CO2 because the CO2 will be radiating to space from a higher, and hence (typically colder) altitude;
3) Therefore the IR radiation from other components of the system, particularly the surface, will have to increase to compensate for that shortfall;
4) The only way for them to increase will be through a rise in temperature.
In the interval between when the first quasi-equilibrium state is perturbed by the addition of CO2 and reaching the second quasi-equilibrium state:
a) Total IR radiation will be decreased (ignoring albedo feedbacks);
b) The resulting energy imbalance will result in an increase in temperature over time; and
c) The time between the two quasi-equilibrium states will be a function of the heat capacity of the system (most of which is in the ocean) and the cumulative energy imbalance in the interval todate.
bogfetto @433:
In the theory of the greenhouse effect, all heat (ie, net energy flow) is from:
1) The Sun to the Earth's atmosphere and surface, with the vast majority going to the surface;
2) From the Earth's surface to the atmosphere and to space, with the majority going to the atmosphere; and
3) From the atmosphere to space.
In each case, the net energy flow is from a warmer to a colder object. If you do not think this is the case, you simply do not understand the theory. Period. This is so important that I would put it in all caps were that not forbidden by the comments policy.
And if you do not understand the theory, learn to understand it before you pretend to criticize it!
You will certainly doubt my claim about the direction of energy flow in the greenhouse theory. Very well. Here is the Earth's energy budget as determined by NASA:
It shows energy flows from the Sun, to and from the surface, to and from the atmosphere, and to space. Sum the energy flow across any boundary between the Earth and the Atmosphere, and the Atmosphere and Space and you will find the incoming and outgoing energy are approximately equal, with only a 0.6 W/m^2 net imbalance. Sum the energy flows between any warmer and colder object, and you ill find more energy flows from the warmer to the colder object than the reverse.
Attn moderators: I have no strong interest in playing whack-a-mole on these issues again with somebody who cannot bother actually learning the theory they purport to criticize. Would you please restrict bogfetto's responses to just this issue until such time that he acknowledges the simple truth, or proves he is incapable of doing so by excessive repetition. At your discretion, I will shift the discussion to the 2nd Law of Thermodynamics thread, where it is far more on topic.
[JH] Bugfotto has relinquishd his privilege of posting comments on this site.
bogfetto, you claimed "The atmosphere is air that moves freely."
But the atmosphere does not move freely into outer space. Only trivial amounts of atmosphere escape to space. So outer space is the equivalent of the shirt. The atmosphere is the equivalent of the air inside the shirt. The atmosphere insulates the surface from the cold of space. The air trapped inside the shirt insulates the skin from the cold of the air outside the shirt.
Tom Dayton @440, that is not an improvement of the analogy. Specifically, the air between the shirt and the skin quickly obtains the same temperature as the skin, which does not occur in the atmosphere. A better defense of the analogy is to point out that there is a temperture gradient within the fabric of the shirt, with the inner most layer of the shirt being skin temperature, and the outermost layer being room temperature. That is, as bogfetto points out, because of the restricted circulation of air within the shirt - but such restricted circulation is not necessary to set up a temperature gradient, and thereby an insulating effect. Specifically, the troposphere also has a distinct energy gradient which is a product of the inefficiency of energy transfer within the atmosphere. Absent convection, it would be even more inefficient and the surface temperature would be higher (as shown by Manabe). If the atmosphere were perfectly efficient at transfering energy, as appears to be assumed by bogfetto, then the temperature of the atmosphere would be constant with altitude.
This picture shows at least three layers of the atmosphere that do not mix. This disproves the wild claim that the atmsosphere "moves freely"
Heat is ony transferred slowly by wind and thermals through the troposphere. Uninformed people think it is fast because they do not consider how big the Earth is. Wind takes days to cross even the distance across a single ocean. It takes weeks and months to transfer energy to the Arctic from the equator. The Atmosphere has many layers that do not freely mix. IR transfer of heat is much faster than thermal transfer. IR heat is blocked by CO2, causing greenhouse warming.
Bogfetto,
Please provide data to support your wild claim that the atmosphere "moves freely" at a rate that is significant to release of energy from the top of the atmosphere. I have provided data showing that the atmosphere does not freely mix to a significant extent.
[JH] Bugfotto has relinquishd his privilege of posting comments on this site.
Interesting picture of a cloud showing at least five atmospheric layers that are not mixing.
Tom Curtis at 10:19 AM on 12 March, 2017
[DB] The user is a sock puppet of a previously banned user, which was also a sock puppet of another previously banned user. Posting rights rescinded.
[JH] The person behind the bogfetto screen has retuurned as beardface. All of his/her posts will be summarily deleted.
As time permits, I will also delete all of bogfetto's prior posts.
I am having trouble following an argument that doesn't take into account the mass of the individual gases. CO2 weighs almost three times what oxygen does and takes up two thirds the space. Direct tests have shown a sharp drop in CO2 with altitude. At the tropopause there is a sharp drop of CO2 presence into the stratosphere demonstrating that while mixing may occur in the heavier, lower, atmosphere the fact that CO2 is a heavier component is still there and CO2 is still much higher near the ground than higher. In the heavier troposphere most of the transmission of heat is due to conduction and not radiation. This leaves one wondering why we are even considering 100 ppm change in a minority gas, that has a lower heat content than other gases, being considered as any sort of problem.
Wake... "Direct tests have shown a sharp drop in CO2 with altitude."
I don't think so...
[Source]
Here's another graph showing the vertical profile of 4 major greenhouse gases.
Source: Earth and Planetary Sciences » "Global Warming - Causes, Impacts and Remedies", book edited by Bharat Raj Singh , ISBN 978-953-51-2043-8, Published: April 22, 2015
If you look at http://www.nature.com/nature/journal/v221/n5185/abs/2211040a0.html you will see that through direct measurements there is a 3-5 ppm step from the tropopause to the stratosphere. The stratosphere starts at about 15 km altitude and that step is not shown on that graph of yours. I would therefore question that source.
And in any case isn't the more important point that the lower atmosphere transfers heat more in conduction mode that radiation? If this is so we can assume that heat is reaching the upper atmosphere via the entire atmosphere and not any specific gas. Once above the cloud levels it would appear that the lower latent heat content of CO2 and Tom Curtis' explantion of heat radiation would be more applicable.
I would also question Michael Sweet's idea that the atmosphere doesn't have large scale mixing by showing unusual conditions of atmospheric layering.
[PS] Fixed link
Wake,
This graph, originally posted above at 430 (and many other locations) by Tom Curtis,
shows that only 20% of energy transfer in the Troposphere is from conduction and latent energy according to measured data. Please provide a reference to support your claim that " the lower atmosphere transfers heat more in conduction mode that radiation". Since measured data indicates that the majority of energy is transferred by radiation, CO2 is indeed more important than conduction.
Mixing is very slow compared to radiation transfer of energy. The atmosphere is always layered. Look at the clouds. Many days there are two or three (or more) layers of clouds. The first picture is visible on any long airplane trip.
A change of 4 ppm at the Tropopause is too small to be visible on the graphs Rob Honeycutt posted. It is an insignificant change. It was an interesting factoid for me to learn. The scientists who study the atmosphere undoubtedly already know this factoid.
Wake @436, I would certainly be interested in a citation of the scientific article from which you conclude that at"... the tropopause there is a sharp drop of CO2 presence into the stratosphere ...". I am aware of Georgii and Jost (1969) who find a "quite sudden change of about 3–5 p.p.m. CO2 is usually observed at the transition from tropospheric into stratospheric air and vice versa". I am also aware of Bischof et al (1980) and there conclusion that "...the CO2 mixing ratio is not constant with altitude but rather decreases in the stratosphere, by about 7 p.p.m.v., between the tropopause and 33 km", along with their speculation that the variation is because "...recently increased concentrations of CO2 in the troposphere have not propagated far into the stratosphere". I am further aware that up to the mesopause, CO2 concentrations stay within 16 ppmv of contemporary surface values:
{Source: Emmert et al (2012) ; 2004-2012 mean of upper atmosphere CO2 concentrations. Contemporary surface value (Mauna Loa): 385.7 ppmv}
My problem is that none of these seem qualified as "a sharp drop". Indeed, even the 16 ppmv difference between the tropopause and the mesopause represents only a difference in radiative forcing of 0.2 W/m^2 if it were applied across the whole atmosphere. It applies, however, not across the whole atmosphere but over that part which has an optical depth of less than one, ie, were IR radiation typically escapes straight to space with the consequence of minimal further impact on the greenhouse effect.
Regardless of impact on the greenhouse effect, the fact that CO2 concentrations at 80 Km altitude are a close approximation of those at 10 Km altitude refutes the idea that there is significant gravitational sorting of concentration below the thermosphere. That is further refuted by Aoki et al (2003) who show from d13C concentrations that:
In terms of how far CO2 measurement has improved since Wake's 1969 paper, see Fouchier 2011. And for spatial mixing, it is hard to beat NASA's 1 year video of CO2 from NASA
Michael Sweet @440, the graph doesn't show that.
Rather, it shows energy transfers across the surface/atmosphere and atmosphere/space boundaries. It does not show the relative proportions of energy transport at any particular altitude (or averaged across all altitudes) within the troposphere. The former because that will change with altitude, and the later because of its design.
Further, even if it did show the proportion of the energy transfer mix within the troposphere, the relevant values would be net radiant energy transfer (57.9 W/m^2) vs energy transfer by convection (86.4 W/m^2) and latent heat transfer (18.4 W/m^2) giving respective percentages of 35.6%, 53.1% and 11.3%.
Thanks Tom, I misread the graph. I will have to read your posts about this graph more closely.
Tom Curtis - Thought you may not have seen this and since actual measurements are a lot more indicative of the real world than computer modeling it could be of interest.
http://www.biocab.org/Overlapping_Absorption_Bands.pdf
[PS] Fixed link please learn to do this yourself using the link tool in the comment editor. Discussions here could be more fruitful if you tried applying some of your skepticism to your own sources.
Wake, your link points to a non-peer reviewed article with questionable conclusions, not to raw data as implied by your description of it as "actual measurements".
I will let more knowledgeable people comment on the alleged science in the article, but the article has not even been edited by someone who speaks English as their first language. If an article is to be taken seriously, proof-reading it is a minimum first step, followed by peer review.
Wake @445:
1) If you are going to say "actual measurements are a lot more indicative of the real world than computer modeling" you should at least point me to actual measurements rather than just a crude mathematical model (which is what Nahle's calculations amount to).
2) Nahle uses surface values for CO2 and H2O concentration. Therefore, even if calculated correctly, he would only be calculating relative emissivity for back radiation at the surface - not the effective emissivity for radiation to space which is the basis of the greenhouse effect. Therefore, the best that can be said for Nahle's calculations is that he simply does not understand the theory of the greenhouse effect.
3) Nahle uses the formula for the emissivity of a 128.2:1 H2O/CO2 isothermal gas mixture. Therefore, at best all he shows is that if the an isothermal gas in a container was 100% water vapour, adding 0.78% CO2 would reduce the emissivity of the gas mixture relative to the 100% water vapour. He goes on to demonstrate that adding oxygen to the H2O/CO2 mixture would further reduce emissivity. The obvious point is that if adding oxygen to a H2O/CO2 mix decreases emissivity, adding a H2O/CO2 mix to an oxygen atmosphere will increase emissivity. That is, it will induce a greenhouse effect. For a more detailed exposition of this point, go here.
To summarize, Nahle's calculations do not apply to the atmosphere as a whole because it is not isothermal; do not calculate the strength of the greenhouse effect because they apply to the surface layer only, and cannot calculate the effect of the change in outgoing radiation due to the presence or absense of a gas; and are incorrectly applied in any event. Worse, they are not observations and do not produce an observationally testable hypothesis with regard to atmospheric radiation. In contrast, the theory he wishes to rebut is based on models that apply the type of formula he is using radiation band by radiation band, layer by layer across a large number of layers in the atmosphere, each of which is small enough to be approximately isothermal. Those models produce observationally testable predictions which have been compared to actual observations as with this example from 1969:
Those detailed, band by band, layer by layer models also predict a greenhouse effect from CO2.
Wake @445,
The denialist paper you link to is actually five years old now, one of a number of crazy climatological ideas promulgated by Nasif Nahle. Concerning that particular paper, Walter Hannah of the Lawrence Livermore National Lab addressed Nasif Nahle’s Shaky Math last year.
Considering the rebuttals by Tom Curtis @447 and by Walter Hannah at MA Rodger's link @448, the paper linked by Wake appears to be incredibly poorly conceived... But even if its flaws were more difficult to spot, it should be clear that any valid paper disproving the greenhouse effect would make its author both rich and famous. Not only would the author become the new darling of the Koch Bros, touring the world giving triumphant defences of BAU fossil-fuel policy, the author would collect the Nobel Prize and all the other accolades befitting a genuine Galileo who had successfully overturned decades of understanding. Instead, the paper remains deservedly unpublished and largely obscure, and not even the denialists have bothered funding a round of much-needed editing for this paper. Thus, even for those unable or unwilling to follow the scientific rebuttal, there are ample clues that this is nonsense. Wake might want to consider what it is about his own world views that made him miss those clues.
Nahle's incompetence isn't confined to how the greenhouse effect actually works.
He has claimed (nearly halfway down this page) that this sequence of pictures proves that Mars was warming between 1995 and 2005 because the polar caps were shrinking, implying that it must be the sun.
He apparently didn't understand (or forgot to tell his readers!) that each picture was taken a little more than one Martian year after the previous one, and that the changes in the polar caps are almost entirely due to seasons! (more on that in the thread Mars is warming)
A similar sequence at 13 months intervals of the Arctic from September 2005 to March 2012 would seemingly show a nearly 3-fold increase in sea ice extent, but we know what really happened in September 2012, don't we?