


 Arguments


1934 is the hottest year on record
What the science says...
| Select a level... |
 Basic
Basic
|
 Intermediate
| |||
|
Globally the year 1934 was cooler than the 20th century average. |
|||||
Climate Myth...
1934 - hottest year on record
Steve McIntyre noticed a strange discontinuity in US temperature data, occurring around January 2000. McIntyre notified NASA which acknowledged the problem as an 'oversight' that would be fixed in the next data refresh. As a result, "The warmest year on US record is now 1934. 1998 (long trumpeted by the media as record-breaking) moves to second place." (Daily Tech).
The year 1934 was a very hot year in the United States, ranking sixth behind 2012, 2016, 2015, 2006, and 1998. However, global warming takes into account temperatures over the entire planet, including the oceans. The land area of the U.S. accounts for only 2% of Earth's total surface area. Despite the U.S. sweltering in 1934, that year was not especially hot over the rest of the planet, as you can see on the 1934 map below. Globally, 1934 temperatures were actually cooler than average for the 20th century.
1934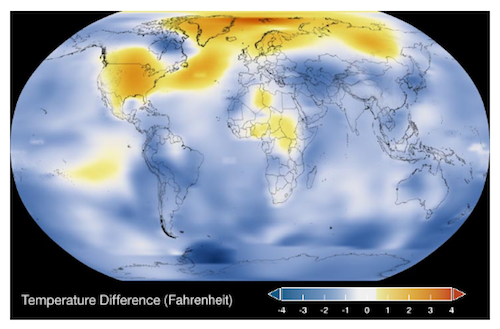
2016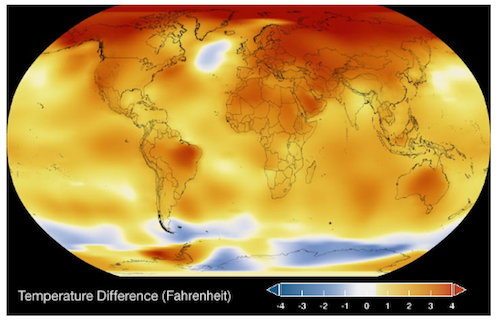
Figure 1. Global temperature maps for 1934 (top) and 2016 (bottom). Source NASA.
Climate change skeptics have pointed to 1934 in the U.S. as proof that recent hot years are not unusual. Choosing the year 1934 is an obvious example of "cherry-picking" a single fact that supports a claim, while ignoring the rest of the data. In fact they have to cherry pick both a location (the U.S.) and a year (1934) to find data that is far from the global trend. Globally, the years 2014, 2015 and 2016 are the hottest on record, so far.
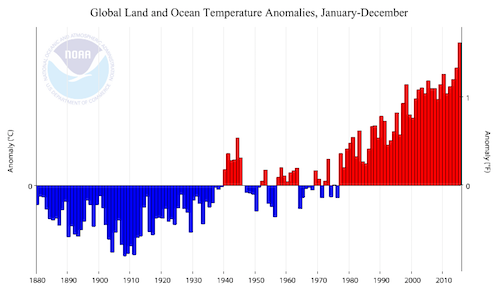
Figure 2. Global land and ocean temperatures from 1880 to 2015. Source: National Climate Data Center
The fact that there were hot years in some parts of the world in the past is not an argument against global climate change. Regional and year-to-year temperature variations will always occur. The reason we are worried about climate change is that on average, over the entire world, the long term trend shows an undeniable increase in global surface temperatures and global ocean temperatures. This rapid global heating is dramatically altering the planet we live on.
Last updated on 7 August 2017 by Sarah. View Archives


Where is your source for the 48 states being only 2% of earth's land mass? Why do you only use the 48 states and why only land mass?
Scott4,
1. where does it say land "mass"? It's surface area.
2. What is the surface area of the Earth? Wiki says it's 510,072,000 km2. Now, what is the surface area of the 48 contiguous? Wiki says 8,080,464.3 km2. Divide one by the other. Maybe wiki is wrong, but I suspect that someone would have noticed by now.
3. How many states were there in 1934?
To add to the existing answers from DSL, in response to scott's question "Why do you only use the 48 states ...?"
because the temperature of the contiguous US states (i.e. the USA excluding Alaska and Hawaii) is a temperature index widely used by US national meterological organizations, such as NOAA (the National Temperature Index).
It may be worth noting, 1934 was also the first year of te Dust Bowl, a human-asued natural disaster in the American Southwest. It seems likely the exteme heat in the continental US that year was, in some part, due to the destruction of grasslands and the immense dust storms. Barren land absorbs more heat than grasslands do.
Pointing out how hot 1934 was in the contiental US is a good way to stress the adverse effects of human activity on the climate and the weather.
This video shows how temperatures of the 2010s compare to those of the 1930s in the US. The hot area of the 1930s is clearly limited to a small band, with most of the US being warmer now. It also applies mainly to daily maximum temperatures, with daily minimums being higher now in the vast majority of the US:
The issue isn't how hot the U.S. was in the 1930s compared to other parts of the world. The issue is how hot U.S. temperatures NOW compared to the 1930s: https://www.youtube.com/watch?v=Gh-DNNIUjKU&feature=youtu.be&t=808
During the 1930’s, more than 70% of the US reached 100F every year, but now less than 30% of the US typically reaches 100F: http://realclimatescience.com/2016/07/record-breaking-heatwave-in-the-us/
DarkMath, why the heck is only the U.S. "the" issue? It's only 2% of the freakin' globe. But at least for the contiguous 48 states, you are incorrect anyway according to NOAA.
DarkMath @45, the highest values in the US Heatwave Index are found in (in decreasing order of intensity) 1936, 1934, 1931 and 1930, with the values of 1936 and 1934 in particular, being significantly greater than any other including recent years:
(Source)
Further, 1936 still holds the record for the percentage of area of the contiguous USA with an unusually hot summer, followed closely by 2012 and 1934:
(Source)
But a greater percentage of the contiguous USA had an unusually cold winter in 1936 than had an unusually warm summer. Indeed, 1936 recorded the second highest percentage of area with a cold winter in the contiguous USA on record:
(Source)
The combination of cold winters with hot summers resulted in 1936 only being the 49th warmest year, and 1934 (whose winters were warmer) being the 5th warmest year in the contiguous USA. In general, recent years have been significantly warmer than the 1930s:
(Source)
There is a reason for the combination of warm summers and cold winters in the 1930s:
Low soil moisture also allows unusually cold nights and winters, which moderated mean temperatures in the 1930s back below typical 21st century temperatures in most years. In contrast, global warming warms nights faster (although the effect is slight) and winters faster than summer (which effect is not slight) so that modern US annually averaged temperatures are greater than those of the 1930s.
So, were the 1930s more uncomfortable to live in than the 21st century in the contiguous USA? Undoubtedly, the combination of drought, cold winters, hot summers and dust bowl made those years hellish - but the cause of the hot summers was also the cause of unusually cold winters. Are typical (record) annually averaged tempertures in the contiguous USA of the 21st century warmer than typical (record) years in the 1930s? Again, undoubtedly yes. Citing the the first fact does not change the second. Rather, it is a piece of misdirection. It is also a piece of misdirection in that the dust bowl and accompanying heat waves were largely anthropogenic (through poor farming practices). The 1930s contiguous USA is not an example of natural variability.
And all of this leaves untouched the fundamental point that concentrating on the contiguous USA rather than global temperatures is a cherry pick of mammoth proportions.
Tom Curtis, you're referencing NASA/NOAA land temperature data that has been adjusted or even estimated in the case of weather stations that no longer exist.
When you take out the adjustments and estimates 2012 is no longer the hotest July on record:
Of course you're going to see a warming trend of late if you base your temperature estimates on a climate model that has warming built into it.
But that's not science. ;-)
[JH] The last two paragraphs constitute sloganeering which is prohibited by the SkS Comments Policy.
Please note that posting comments here at SkS is a privilege, not a right. This privilege can be rescinded if the posting individual treats adherence to the Comments Policy as optional, rather than the mandatory condition of participating in this online forum.
Please take the time to review the policy and ensure future comments are in full compliance with it. Thanks for your understanding and compliance in this matter.
[PS] This post also promulgates the idea that temperature record is adjusted for some nefarious purpose (effectively an accusation of fraud). If you think the record can be represented better, then please discuss here supporting your case with data and preferrably peer-reviewed publications but spare us the wild fantasies of Heller et al. If you honestly believe that you can usefully compare data from site before and after fitting say a Stevenson screen, without adjustment, then this is not the site for you.
DarkMath - "Of course you're going to see a warming trend of late if you base your temperature estimates on a climate model that has warming built into it." represents either an accusation that climate scientists are idiots, or is a conspiracy theory. Neither is justified.
As Tom pointed out, summer only temperatures, let alone a focus on only a few percent of the Earth's surface area, are significant cherry-picks, and those choices on your part don't support your argument. The climate is considerably warmer now than it was in the 1930s.
http://www.skepticalscience.com/comments_policy.shtmlDarkMath,
You may come to SkepticalScience and debate the science but be aware that if you are going to pronounce "But that's not science. ;-)" it is actually beholden on you to properly explain what the "that" is which you are asserting "is not science." Otherwise "That (ie your comment) is not (real) science." Do not be deceived by the names that deluded climate deniers like Steve Goddard/Tony Heller pick to name their websites.
[JH] I have flagged the sentence you cite as sloganeering and have advised Dark Math to read and adhere to the SkS Comments Policy.