Climate Science Glossary

Term Lookup

Enter a term in the search box to find its definition.

Settings

Use the controls in the far right panel to increase or decrease the number of terms automatically displayed (or to completely turn that feature off).

Term Lookup

Settings


All IPCC definitions taken from Climate Change 2007: The Physical Science Basis. Working Group I Contribution to the Fourth Assessment Report of the Intergovernmental Panel on Climate Change, Annex I, Glossary, pp. 941-954. Cambridge University Press.

Home Arguments Software Resources Comments The Consensus Project Translations About Support

Bluesky Facebook LinkedIn Mastodon MeWe

Twitter YouTube RSS Posts RSS Comments Email Subscribe


Climate's changed before
It's the sun
It's not bad
There is no consensus
It's cooling
Models are unreliable
Temp record is unreliable
Animals and plants can adapt
It hasn't warmed since 1998
Antarctica is gaining ice
View All Arguments...


Username
Password
New? Register here
Forgot your password?

Latest Posts

Archives

Comparing past climate change to recent global warming

What the science says...

Statistical analysis of the rate of warming over different periods find that warming from 1970 to 2001 is greater than the warming from both 1860 to 1880 and 1910 to 1940.

Climate Myth...

It warmed just as fast in 1860-1880 and 1910-1940

“In fact, the rate of warming from 1975-2001, at 0.16 °C per decade, was the fastest rate to be sustained for more than a decade in the 160-year record, but exactly the same rate occurred from 1860-1880 and again from 1910-1940, when we could not possibly have had anything to do with it.” (Christopher Monckton)

Let’s have a look at some warming rates of the periods of interest from several different temperature records:


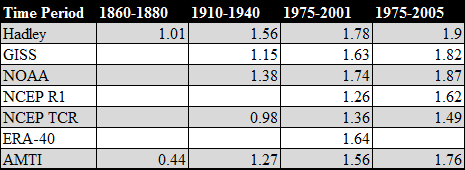
Table 1: Rate of warming for given indices in °C/century.

First we can conclude that Monckton's statement that 1975-2001 was the fastest warming rate for longer than a decade is absolutely wrong as a much higher rate is demonstrated for 1975-2005 in row 5. Secondly, to compare the three periods in Table 2, the only index which covers that period is Hadley, making his 1.6°C per century number wrong for 1975-2001 as it is actually much higher at 1.78°C per century.


Based upon the evidence presented here, he cannot support his statement that 1860-1880 had a similar warming rate as it was demonstratively lower than the 1975-2001 warming rate and nearly half the 1975-2005 rate. Finally, regarding the 1910 to 1940 warm period, evidence presented here suggests that only 1 out of the 4 major indices indicates a rate of warming within 0.25°C per century and none within 0.2°C. His claim that the rates are similar is dubious at best.

Last updated on 31 January 2011 by robert way.

Printable Version  |  Offline PDF Version  |  Link to this page

Argument Feedback

Please use this form to let us know about suggested updates to this rebuttal.

Comments

Prev  1  2  3  4  5  Next

Comments 51 to 75 out of 109:

  1. Muoncounter, I have already read your cosmic ray article, and most of it I think I can indeed answer. Look, Svensmark's cosmic ray theory is supported by dozens of peer reviewed papers. See here and look in the cosmic ray section. I also suggest you watch the documentary 'The Cloud Mystery', which explains about his work. Part 1 Part 2 Part 3 Part 4 Part 5
    Response: When someone points you to a more relevant thread, you must not only read the original post there; you must also continue your comments there. This comment of yours is off topic here.
  2. Dikran I am not cherry picking. There is a huge difference in the rate of warming showed in the satellite temperature data and the surface station data. Satellite data is much more reliable at measuring global temperature. Therefore all the evidence would suggest that the surface station data is unreliable at actually monitoring temperature changes.
    Response: [DB] I'm glad you feel satellites are reliable. Because once again, Tamino's graph is based on satellite data and surface data, which (as those with eyes that see can plainly see) agree. Glad that's settled. BTW, you must have missed the preliminary news release from BEST, which showed virtually no issues with the surface station record. May want to note that in your Poptech links.
  3. Adam, "The radiosonde data shows a lot less warming over the past 30 years than the surface station data." That statement was and is simply false. I find it astounding that you can so easily dismiss data from NCDS/NOAA. You also seem to be focussed on tropical temperatures, when we are dealing with an increase in mean global temperature. Cherry pick much? You are deluding only yourself Adam. Re the reliability of the various temperature records. Each and every dataset has issues-- yet they agree remarkably well. You claim that radiosonde data are more reliable, and they agree very well with the NOAA data, as do the satellite data, and the re-analysis data.... [Source]
    Response: [DB] Classic goal-post shifting by Adam. First (on the Greenland/Zebra thread) it was Arctic/Greenland temps. Then various layers of the atmosphere. Now a retreat into the tropics. What next, the tropospheric hot spot & Spencers "Clouds-cause-ENSO" pet toy? Or perhaps a resurrection of the Iris-thingy? The convolutions & contortions are fascinating...
  4. Adam#51: This discussion belongs on the cosmic ray thread. "See here" Thanks, you've confirmed my suspicions with your link to our old friend PopTech.
  5. Muoncounter, Maybe Adam is Poptech ;)

    Response:

    [DB] No.

  6. @Albatross #55 Yes, indeed!
  7. Adam - "KR I have never claimed that CO2 is the only driver of climate change. Could you please point out where in my comments I said that?" Every single time you claimed or plotted CO2 versus temperature, and asked "Why don't they correlate?". Temperatures correlate extremely well with the set of forcings, one of which is CO2. That CO2 forcing is becoming more and more dominant now; we would be seeing declining temperatures, about 0.8C cooler globally, without the CO2 forcing. But by claiming that a lack of exact correlation between a single forcing and temperatures disproves CO2 forcing, you are posing a strawman argument, claiming that CO2 is the only driver. It isn't that simple. If you don't understand that, I despair of you understanding most of climate science.
  8. KR @ 57... Exactly! I've tried to say the same thing several times. If you do one small experiment and remove the accumulated radiative forcing from century scale temperature trend you get a very different picture. The difference is AGW. Us.
  9. Daniel Bailey and Albatross, if there is no warm bias in the surface temperature record could you please explain why there is such a huge difference between satellite data and thermometer readings? Read the following paper: 'An alternative explanation for differential trends at the surface and in the lower troposphere' by Klotzbach et published in the 'Journal of Geophysical Research (2009)
    Response: [Dikran Marsupial] This has been discussed elsewhere, see e.g. this RealClimate article and links therein.
  10. Daniel Bailey Tamino's graph was indeed a mixture of all the datasets, but the satellite trends were mostly covered up by the surface temp trends. I am not 'goal shifting'. I was focusing on Greenland temps, but Albatross was the one who made the claim that the sun could not have caused post 1970 climate change. I was simply answering, and providing a paper counter to his opinion, which simply involved tropospheric data. KR if CO2 was having at least some effect, then you would expect there to be a correlation. You're argument that there is no correlation because co2 is not the only driver of climate, pretty much shows that natural forces will always overwhelm the effect caused by CO2. The Greenland warming of 60 years ago was just the same as the current warming. They were exactly parallel to each other. I don't believe that it just a simple coincidence. Once again could you please state what forcing caused the previous Greenland warming of 60 years ago, and why you don't believe it is causing the current one?
    Response: [Dikran Marsupial] If the satelite trends were mostly covered up by the surface trends, does that not imply that the satelite tends are essentially the same as the surface trends? You might want to clarify that.
  11. Dikran once again, blog posts (real climate) are not published and do not warrant a reply. Only published criticism counts. Anyway, the real climate article in question has indeed been refuted. See here and here.
    Response: [Dikran Marsupial] Very few papers that are incorrect are ever the subject published comments, generally the just get ignored and end up with few citations. It is also too early to be sure that any comments papers have appeared yet, they take time to write and to get through peer review. If you are only going to accept published refutations then it is obviously disingenuous to raise a paper for discussion before there has been a proper chance for those refutations to have appeared. Besides that, if blog posts don't count, that means you will not accept any refutation given here anyway, so what is the point in anyone discussing it with you?
  12. Dikran Tamino used several datasets in his graph, using more more surface station data than satellite data. The fact that his graph used mainly surface data (which showed higher warming trends), would cover up the smaller trends shown in the satellite data. Once again, I suggest you read the paper I gave you.
    Response: [Dikran Marsupial] If the satellite trends lie within the spread of the surface station data, that means the satellite and surface station trends are statistically similar (within their respective uncertainties). If there was a meaningful difference between the surface station trends and the satellite trends, the satellite trends would not be covered up by the surface station trends.
  13. @Adam Why did you change from "Poptech" to "Adam"?
  14. 60, Adam,
    ...could you please state what forcing caused the previous Greenland warming of 60 years ago, and why you don't believe it is causing the current one?
    Um, actually, this isn't how science works. We have an established, explicable mechanism (GHG theory), supported by empirical evidence, which explains the recent warming in Greenland. We do not have the same for the warming 60 years ago (partly because there is no way to go back in time and get measurements that weren't taken), but we know that it could not have been greenhouse gases. That's all fine. Nothing in proving GHG theory requires us to explain all climate events prior to the current period. If you wish to argue that whatever caused the warming in Greenland 60 years ago is also the current cause, then it falls to you to first develop a hypothesis, then test it and find evidence to support it, and then to put forth that hypothesis for current warming, and then further test that, and find evidence to support that. The argument that it must be proven that the cause of prior recent warming events is not the cause of current warming is like arguing that before anyone can be accused of a recent murder, the DA must first prove that all previous convicted murderers were not guilty of the latest crime.
  15. Dikran the paper I gave you was published 17 months ago. That is plenty of time for a comment to have been submitted to the Journal and published. Yet there have been none. Dikran there has been no published critsicm of Klotzbach et al, and the points raised in the real climate article you gave me were, as shown by the authors, either erroneous or irrelevant. Dikran once again, in his graph Tamino used more surface data than satellite data. The use of those datasets would have obscured the trends in the satellite data. Anyway, it is pretty well established that the satellite data is different from the surface data, since it shows virtually no warming from 1979-1997. And compare it with the graph presented in this article There is a very clear warm bias in the surface temperature record. Once again I suggest you actually read Klotzbach's paper.
    Response: [Dikran Marsupial] I am writing a reply to a paper at the moment, the original paper was published in 2009, mine isn't even submitted yet. The paper refuting Morners assertions about the satellite sea level data wasn't published until a couple of years later. So your initial comment is at variance with my personal experience. Your second comment is merely restating the comment I had addressed. That is a very weak rebuttal indeed. BTW, I only pointed you at the RealClimate page FYI, I didn't claim Klotzbach was wrong, and if you read the blog articles, they seem to view the paper as a bit of a curates egg and most of the problem is in the reporting of the paper in skeptical blogs. The silly ad-hominem (the source of an argument is irrelevant, correct science ocurs on blogs, incorrect science sometimes makes it through peer-review, rejecting information from a blog because it is from a blog is denialism) and demonstration of ignorance of scientific publishing hasn't done you any favours.

    If you want to compare the satelite and surface data, then try using plots for the same period on the same axes, woodfortrees is an excellent resource for that. Here is a comparison of UAH and HADCRUT datasets:

    Click the image for the source. Looks pretty similar to me. The slight displacement of one relative to the other is small, and due to (i) they use different baseline periods and (ii) they don't actually measure quite the same thing, so some difference is to be expected. The trends for this period are very similar 0.14 per decade for UAH and 0.15 per decade for HADCRUT. Play with the other dataset on woodfortrees for yourself - it is an excellent resource for checking up on claims about trends etc.

    I've just noticed that Woodfortrees already has a pre-prepared plot where they have adjusted for the difference in baseline periods used to define the anomalies for each products, there is no clear difference between the satellite products and the surface station data. The satellite products do have slightly lower trends, but that isn't unduly surprising, they are not measuring surface temperature, but a weighted average temperature of a thick slab of the lower troposphere.

    p.s. please use width=400 when posting images so they don't mess up the formatting on the site. I have inserted them for you on this occasion.

  16. Sphaerica "We have an established, explicable mechanism (GHG theory), supported by empirical evidence, which explains the recent warming in Greenland." If so, could you please point out on the graph of Greenland temperatures, when anthropogenic supposedly started having an effect. And remember that for every year other than 2003 and 2010, Greenland temperatures did not exceed what it was 60 years ago. "We do not have the same for the warming 60 years ago (partly because there is no way to go back in time and get measurements that weren't taken), but we know that it could not have been greenhouse gases. That's all fine. Nothing in proving GHG theory requires us to explain all climate events prior to the current period." Sphaerica what it shows is that forces other than greenhouse gases have played and are most likely still playing, a major role in Greenland's climate. The Greenland warming of the past 20 years is exactly parallel to the one 60 years ago. ONce again, I don't think this is just a simple coincidence. If other forces caused a Greenland warming very similar to the current warming, then there is no reason to belive why it shouldn't be those forcings, which are causing the current warming. Unless of course you can provide proper empirical evidence that post 1980 Greenland warming is caused by humans and not simply a natural cyclic phenomenon. "If you wish to argue that whatever caused the warming in Greenland 60 years ago is also the current cause, then it falls to you to first develop a hypothesis, then test it and find evidence to support it, and then to put forth that hypothesis for current warming, and then further test that, and find evidence to support that." Sphaerica, I have provided evidence that oceanic oscilations like the Arctic multidecadal oscilation is the major cause of Greenland warming. I provided a paper for this. I do not find Tamino's argument against it very convincing. Anyway, you believe that the Greenland warming of the past 20 years, so it is up to you to prove that hypothesis as well. So Sphaerica could you please provide proper empirical evidence that post 1980 Greenland warming is due to humans? "The argument that it must be proven that the cause of prior recent warming events is not the cause of current warming is like arguing that before anyone can be accused of a recent murder, the DA must first prove that all previous convicted murderers were not guilty of the latest crime. " Sphaerica in science, if you are trying to prove a hypothesis, such as one of causation, then you need to eliminate all other possible causes. Anyway, as I explained all I am saying is that current Greenland climate is not unprecedented in it's history.
  17. Adam says Anyway, it is pretty well established that the satellite data is different from the surface data, since it shows virtually no warming from 1979-1997. Pay attention to the scale used. Reading the axis is a very basic skill to analyse this. And don't rely so heavily in eyeballing a graph. To determine a trend you'd better use at least a linear regression.
    Response: [Dikran Marsupial] I have provided him with plots of the data on a common axis - with linear regression of the trends; however as he doesn't accept information from blogs, I don't suppose he will accept that either. I have said enough, I only commented to give him a helpful pointer to other comments on the Klotzbach paper, I dind't expect the Spanish inquisition!
  18. Adam wrote
    Sphaerica in science, if you are trying to prove a hypothesis, such as one of causation, then you need to eliminate all other possible causes. Anyway, as I explained all I am saying is that current Greenland climate is not unprecedented in it's history.
    Adam, your view of science is overly simplistic--the sort of view people acquire in grade school, introductory high school science classes, and unfortunately even in some introductory college classes. Just like all other decision making, it's done based on weight of evidence. You can never, ever, eliminate all other possible causes, in any field of inquiry.
    Response: [Dikran Marsupial] Indeed, as I have explained to Gilles at some length it is fundamentally impossible to prove a causal hypothesis anyway; they can only be falsified or at best corroborated - but never proven (see the work of Karl Popper).
  19. 66, Adam,
    If so, could you please point out on the graph of Greenland temperatures, when anthropogenic supposedly started having an effect.
    Silly, blatant debate tactic. Obviously there are many factors in climate, and tying any one directly to a specific location and point in time is futile. This proves nothing.
    And remember that for every year other than 2003 and 2010, Greenland temperatures did not exceed what it was 60 years ago.
    Which means absolutely nothing.
    ...forces other than greenhouse gases have played...
    Obviously.
    ...and are most likely still playing...
    Why? Yes, obviously, as already stated, there are many factors in climate. No one disputes that. But why "most likely" and "a major role" other than because you say so? You've presented no evidence other than assumption (= wishful thinking) that there is some magical force which you cannot identify which is therefore responsible for all warming, despite the logic behind and evidence for GHGs.
    The Greenland warming of the past 20 years is exactly parallel to the one 60 years ago...
    The sun came up this morning exactly as it did 60 years ago. This means absolutely nothing.
    Unless of course you can provide proper empirical evidence that...
    There is adequate evidence the GHG theory is true and is warming the globe. As already stated, your personal requirement that the theory be explicitly tied to one spot on the globe in a specific time period, just because you need to see it, isn't a requirement of science, or proving the theory. It's just you demanding that other people meet your own requirements, which you carefully select so that they can't be met... and all the while being unable to provide the slightest shred of evidence for your own belief.
    ...oceanic oscilations like the Arctic multidecadal oscilation...
    First, the AOM is not a thing, it's just a collection of measurements. It's a set of observations, not a mechanism. Can you explain the physics behind the AOM? Can you predict the AOM? No. If not, then how can you predict something supposedly triggered by AOM? Second, the AOM can only affect regional temperatures. Even if there is some oscillating warming/cooling cycle in the system, it cannot account for an overall upward trend in the entire system (i.e. the globe). Again, you are focusing on a single spot on the globe, seemingly because it lets you fabricate erroneous arguments, stomp your feet, and demand that other people meet your own requirements. You prove nothing.
    ...then you need to eliminate all other possible causes...
    But you haven't provided an alternate cause. This statement is like saying that before the theory can be accepted, we must first prove that the warming is not caused by voodoo, dreams, warmth fairies, or Eurasian leprechaun farts. One must only disprove a competing theory if a reasonably valid theory is put forth, along with some evidence that it should be taken seriously. "I don't believe it" is not a theory, it's your personal position. No one needs to refute that.
    Response: [DB] Well-stated, and well-played sir. Nicely done.
  20. Regarding Dikran's moderator's comment on my previous comment: Popper gets mentioned a lot here on Skeptical Science and elsewhere. I'm not a fan of Popper. There is no such thing as absolute falsification, because you never can be absolutely sure that the falsification conditions were correct. Better to say that all decisions involve uncertainty, though sometimes the uncertainty is vanishingly small.
    Response: [Dikran Marsupial] IIRC, Popper's most important book spends many chapters dealing with probabilistic falsification. It generally doesn't get mentioned much because it gets rather too complicated for the needs of most discussions. The basic idea, that the more falsifiable a theory is (i.e. the more things is rules out) the better seems sound and the idea that you can't prove anything encourages us always to keep an open mind, which is no bad thing. I am a Bayesian myself, so I also take a probabilistic view, with the addition of a strong prior that the probability an hypothesis is true is never one, but it might be zero. In short, I agree!
  21. Dikran inline response to my #67 Sometimes I wonder if engaging in such discussions is productive at all. The person does not understand, and it comes to a point that "not understanding" starts to be an argument in itself. And the attention received (certainly well intended and commendable) may even give the impression that it is a fair point being raised. It is not like explaining calculus to a colleague who did not understand the lecture. The "skeptic" comes with low understanding of the subject, and full of suspicion and preconceived ideas about The Great Conspiracy. There is no attention to evidence. On the contrary, evidences must be avoided at all costs, otherwise they feel they would (God forbid) be convinced and give in to The Great Conspiracy. So if someone shows some compelling evidence here, the "skeptic" feels he should quickly change to some other talking point and just press on. This is no criticism to the great moderation work all you guys do here. It's just a thought I felt was worth sharing.
    Response: [Dikran Marsupial] Yes, it is an interesting issue. The hope is that by presenting a brief answer in moderators comment, other posters won't need to bother.
  22. Dikran, I find it very interesting that the surface data you have used in your graph is the hadcrut 3 data. It has been repeatedly claimed on this website that that dataset is unreliable because it doesn't cover the Arctic, which is 'warming the fastest'. And therefore claimed that it would understimate the warming. http://www.skepticalscience.com/global-warming-stopped-in-1998.htm http://www.skepticalscience.com/climate-shift-synchronized-chaos.htm http://www.skepticalscience.com/CFCs-global-warming.htm http://www.skepticalscience.com/1998-is-not-the-hottest-year-on-record.html http://www.skepticalscience.com/3-levels-of-cherry-picking-in-a-single-argument.html http://www.skepticalscience.com/Graphs-from-the-Zombie-Wars.html http://www.skepticalscience.com/Arctic_Temperature_Change.html http://www.skepticalscience.com/Ten-temperature-records-in-a-single-graphic.html Dikran why are you using a dataset, which your own website has claimed is unreliable, and underestimates the warming? Your second graph isn't very clear, and doesn't really make the trends clear. The fact is that satellites show no statistically significant warming from 1979-1997, yet the GISS data (which is used frequently on this website) does indeed show significant warming from 1970-1997. It's either one dataset or the other, which is wrong.
    Response: [Dikran Marsupial] I did say that you should experiment with the other datasets for yourself. Did it not occur to you why I said that? It is because I knew you wouldn't accept it, whatever I plotted. If you are going to raise the arctic coverage issue, then it cuts both ways, the satelite data doesn't cover the artcic either, so there is a good reason why GISTEMP which does exhibits a higher trend. You can't have it both ways. I used the dataset that gives the most direct comparison with the satellite products. If the second plot isn't clear, follow the link to woodfortrees.org and arrange it the way you want to make your point and post the result here. It isn't rocket science.

    The point about UAH not having significant warming from 1979-1997 by GISSTEMP showing warming from 1970-1997, is as laughable bit of cherry picking as you could want to see. I wonder why the GISSTEMP trend isn't measured from 1979-1997 like the UAH one. It couldn't be because trends pass test of statistical significance more easily over longer timeframes, that would be just disingenuous (of whichever blog you borrowed it from). ROFL.

  23. Sphaerica "You've presented no evidence other than assumption (= wishful thinking) that there is some magical force which you cannot identify which is therefore responsible for all warming, despite the logic behind and evidence for GHGs." Obviously you haven't read my comments. Once again I'll refer you to Chylek's 2006 paper http://www.joelschwartz.com/pdfs/Chylek.pdf "The sun came up this morning exactly as it did 60 years ago. This means absolutely nothing." Once again read Chylek's paper. The fact that it was just as warm 60 years ago shows that their is nothing unprecedented or unusual about Greenland's climate. "Second, the AOM can only affect regional temperatures. " And Sphaerica as you have pointed out Greenland is not the whole world, so therefore it can indeed be possible for the AMO to effect it's temperature changes. Read Chylek's 2009 paper. "Again, you are focusing on a single spot on the globe, seemingly because it lets you fabricate erroneous arguments, stomp your feet, and demand that other people meet your own requirements." The reason why I was focusing on Greenland, was because that was what the article I first commented on was about. Like I've said polar regions are different from the rest of the world. They are especially sensitive. Therefore they are the first places we need to look if we want to detect a CO influence. And basically all of Greenland's data pretty much makes us come to the conclusion that CO2 is not playing any major role. "This statement is like saying that before the theory can be accepted, we must first prove that the warming is not caused by voodoo, dreams, warmth fairies, or Eurasian leprechaun farts." See here
  24. Quick, someone please call a behavioural psychologist, I think there might just be enough information here for them to write a note on denialism ! :) And should there be interest in such a thing, "internet trolling". Alexandre @71, you make some excellent points, although I must admit i am having a little trouble hearing you ver the annoying background noise ;) Ultimately this type of exercise only reflects incredibly poorly on the "skeptics". What I find annoying though is that is detracts from the science and reasoned, rational and factual discussion. i mean how the heck does one deal with this kind of denialism and cherry-picking? "The fact is that satellites show no statistically significant warming from 1979-1997"
  25. Alexandre "The "skeptic" comes with low understanding of the subject, and full of suspicion and preconceived ideas about The Great Conspiracy. There is no attention to evidence. On the contrary, evidences must be avoided at all costs, otherwise they feel they would (God forbid) be convinced and give in to The Great Conspiracy. So if someone shows some compelling evidence here, the "skeptic" feels he should quickly change to some other talking point and just press on." I have repeatedly asked for empirical evidence that Greenland temperature variations are caused by humans. So far nobody on this website has provided. Alexandre could you please point out where anybody on this website has provided actual proper evidence in response to my comments. Since I have been here, most of the time people are repeating the same arguments again and again, which still doesn't answer my points. ALexandre, once again I'll ask you, if you think that I am in denial (which is pretty much what you're comment is saying, right?) then why don't you provide empirical evidence that post 1980 Greenland warming is down to human emissions of greenhouse gases? It shouldn't be a hard challenge since you have claimed that there is lots of evidence.

Prev  1  2  3  4  5  Next

Post a Comment

Political, off-topic or ad hominem comments will be deleted. Comments Policy...

You need to be logged in to post a comment. Login via the left margin or if you're new, register here.

Link to this page


The Consensus Project Website

THE ESCALATOR

(free to republish)


© Copyright 2024 John Cook
Home | Translations | About Us | Privacy | Contact Us