


 Arguments


How reliable are CO2 measurements?
What the science says...
| Select a level... |
 Basic
Basic
|
 Intermediate
| |||
|
CO2 levels are measured by hundreds of stations across the globe, all reporting the same trend. |
|||||
Climate Myth...
CO2 measurements are suspect
"The Keeling curve, which is widely used to show the increase in CO2 emissions, is based on data from the top of Mount Mauna Loa in Hawaii. Mauna Loa is a volcano and it doesn’t seem to me that a volcano is the best place to be taking CO2 measurements" (disinter)
At a glance
Mauna Loa is an active volcano on 'Big Island', the largest of the chain that makes up the state of Hawaii. It does not erupt that often; the last four times at the time of writing (2023) were in 1950, 1975, 1984 and 2022-23. The summit is 4,169 metres (13,679 feet) above sea level.
The observatory that takes regular CO2 measurements is situated some 6.4 kilometres (4 miles) from the summit, on the volcano's northern slopes. Here, the prevailing winds are the north-easterly Trades, blowing in clean air off the Pacific Ocean. Hour to hour CO2 levels in this airflow vary by no more than 0.3 parts per million (ppm).
Light southerly winds, bringing air from the volcano, can however occur under very specific weather conditions, normally late at night. Such conditions are readily detectable because unlike the steady 'baseline' readings, CO2 levels suddenly start to jump up and down wildly. These highly erratic CO2 levels are so different from the baseline data that they can easily be filtered out with mathematics. During the 2022-23 eruption, measurements from Mauna Loa Observatory had to be suspended from Nov. 29, 2022 and observations from then until July 4, 2023 were from the Mauna Kea Observatories, approximately 21 miles north of Mauna Loa.
Measurements of CO2 at Mauna Loa commenced in 1958. NOAA’s Earth Science Research Laboratory program also measures CO2 in over 60 locations around the world, taking air samples in flasks. Flask measurements and the Mauna Loa data show excellent agreement. This confirms that occasional detections of volcanic CO2 at Mauna Loa do not affect the final results. The data-filtering process paints a true picture of the situation.
The upward-sloping trend in CO2 concentrations at Mauna Loa is a reflection of human activity. It represents our burning of fossil fuels and other types of carbon emissions. Superimposed on that upward trend is an annual wiggle. The wiggle represents the Fast Carbon Cycle, involving photosynthetic plants in the Northern Hemisphere. That's where most of the planet's landmasses happen to be. Every spring the plants become more active as the growing season starts and CO2 levels start to drop. But autumn comes along, the leaves shrivel and fall and CO2 rises again. It's like the heartbeat of the planet, superimposed on the upwards slope that very definitely represents us.
In conclusion, scientists know all about the volcanic activity at Mauna Loa and the specific conditions in which volcanogenic gas emissions will be and are detected. To suggest otherwise is an example of the misrepresentation often required in order to promote the talking-points of science-denial.
Please use this form to provide feedback about this new "At a glance" section. Read a more technical version below or dig deeper via the tabs above!
Further details
This myth is a classic example of ignoring critically relevant evidence in order to state a conclusion. Misrepresentation is the technical term. The fact that Mauna Loa is a volcano is of course well-known among Earth scientists. Mauna Loa observatory is, however, situated some 6.4 kilometres (4 miles) from the crater, on the volcano's northern slopes. Here, the prevailing north-easterly Trade Winds blow in clean air off the Pacific Ocean. Hourly measured CO2 levels in this airflow vary by no more than 0.3 parts per million (ppm) (fig. 1).
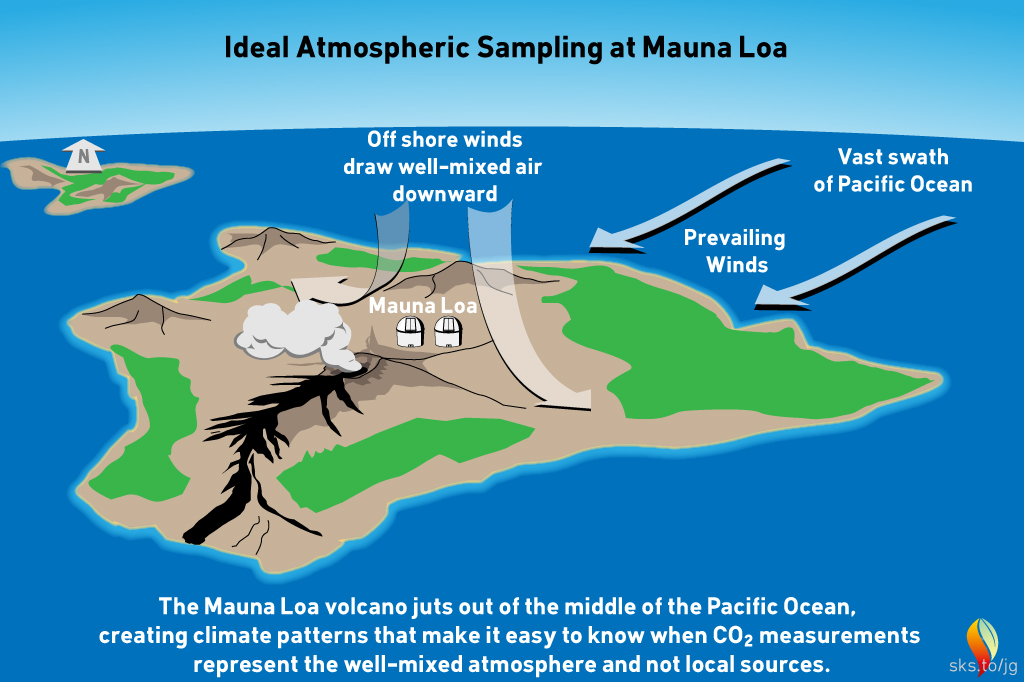
Fig 1: geography and typical meteorology of the Mauna Loa district. Graphic: jg.
Light southerly winds, bringing air from the volcanic vents, can however occur under specific weather-conditions. In such circumstances, a temperature inversion can form over the fumaroles around the summit. The inversion traps volcanic CO2 emissions that drift northwards on that southerly breeze. Such conditions only occur late at night. Their effect is readily detected. Unlike the steady 'baseline' readings from the trade winds, when the southerly wind is blowing, CO2 levels start to fluctuate wildly. These highly erratic CO2 levels differ so much from the baseline measurements that they are easy to spot. They can be removed by mathematical data-filtering. Essentially they represent sporadic outbreaks of 'noise'.
The following graph (fig. 2) shows atmospheric CO2 levels over the last 10,000 years. It includes ice core data for CO2 levels before 1950. For values after 1958, direct measurements from the Mauna Loa Observatory on Hawaii were used.
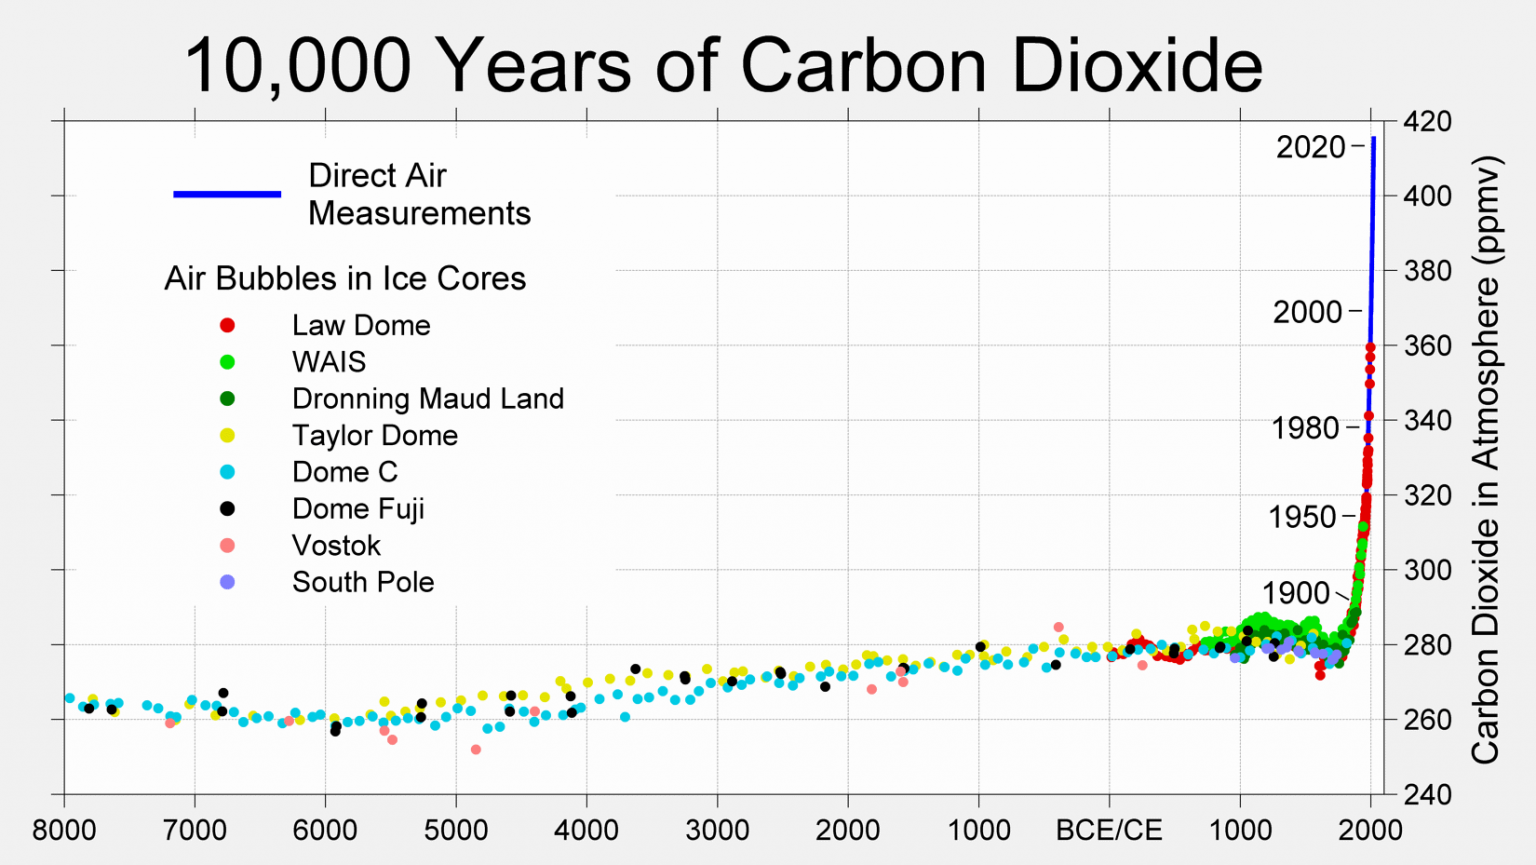
Figure 2: CO2 levels (parts per million) over the past 10,000 years. Source: Berkeley Earth
Mauna Loa is often used as an example of rising carbon dioxide levels (fig. 3) because it is the longest, continuous series of directly measured atmospheric CO2, the so-called 'Keeling Curve', that we have. The reason why it's acceptable to use Mauna Loa as a proxy for global CO2 levels is because CO2 mixes well throughout the atmosphere. Consequently, the trend in Mauna Loa CO2 (1.64 ppm per year when this rebuttal was first written in 2010, now 2.69 ppm, July 2022-2023) is statistically indistinguishable from the trend in global CO2 levels (fig. 4). If global CO2 was used in figure 2 above, the resulting "hockey stick" shape would be identical.
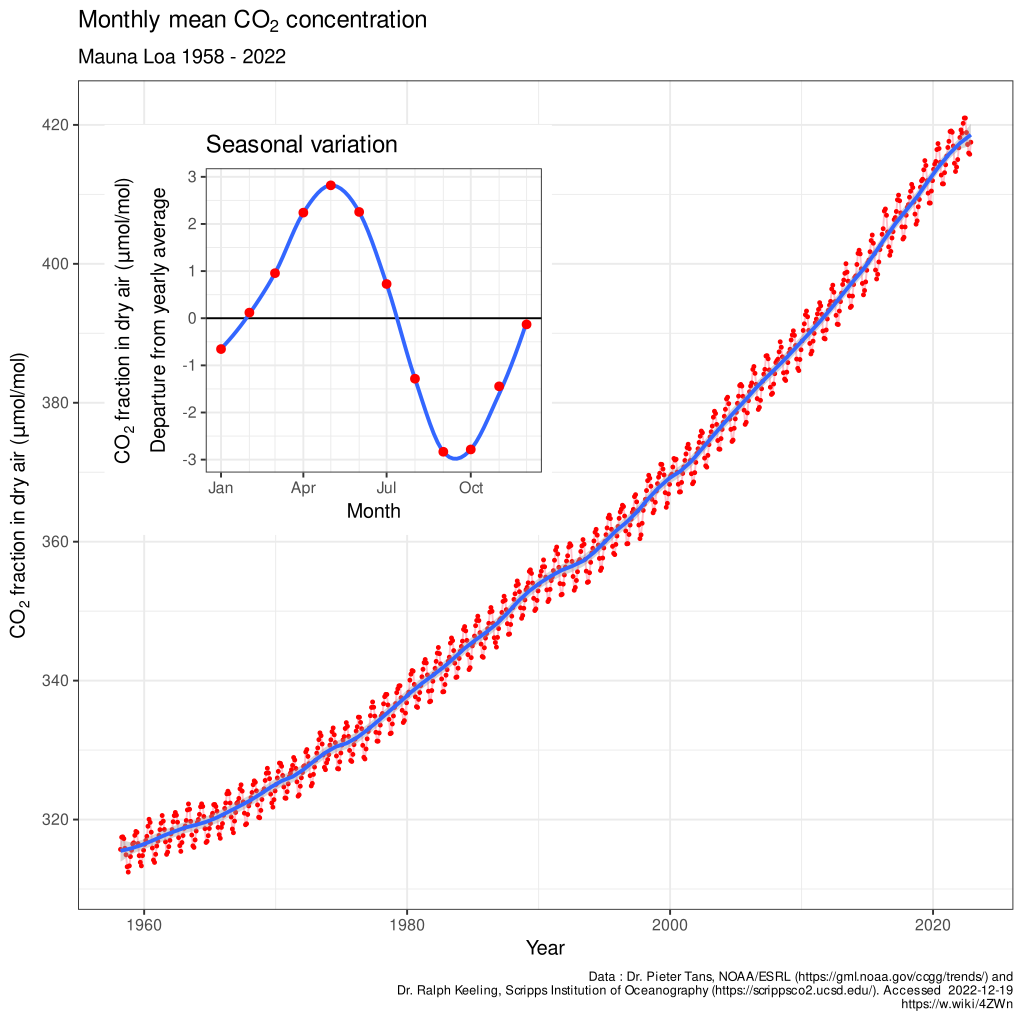
Figure 3: The Keeling Curve - monthly mean CO2 concentration data (with the occasional volcanic anomaly filtered out), Mauna Loa Observatory, 1958-2022. Inset shows the annual 'wiggle' caused by seasonal plant-growth and dieback in the Northern Hemisphere. Image licensed under the Creative Commons Attribution-Share Alike 4.0 International licence.
This video is an excellent graphic example of where our data for CO2 levels come from and how the wiggles vary. It shows surface measurements of CO2 varying over different latitudes from 1979 to 2006. The graph is created by Andy Jacobson from NOAA and includes a global map displaying where the measurements are coming from, a comparison of Mauna Loa CO2 to South Pole CO2 and the graph expands at the end to include ice core measurements back to the 19th Century. The key point is that the wiggles are of low magnitude near the equator but are bigger in the north, as might be expected because seasonality is more pronounced at higher latitudes.
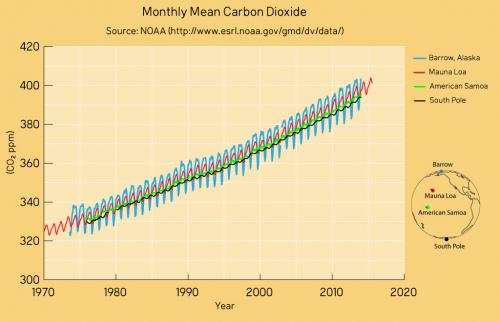
Figure 4: CO2 measurements from Mauna Loa and some other global sampling stations over recent decades. The trends are identical as are the positions of the wiggles that vary in magnitude according to seasonality in the Northern Hemisphere. Data from NASA; graphic by jg.
Satellite data is also consistent with surface measurements. This video shows the global distribution of mid-tropospheric carbon dioxide. The data comes from the Atmospheric Infrared Sounder (AIRS) on the NASA Aqua spacecraft. Superimposed over the global map is a graph of carbon dioxide observed at the Mauna Loa observatory. However CO2 levels are measured, the same trend is observed. Upwards and upwards and upwards.
Last updated on 1 October 2023 by John Mason. View Archives


How can we be confident that the CO2 concentration measurements from the ice core samples, which may have been contaminated in some way, either historically through leakage or in the recent withdrawal process, gives a reading comprable to those from Mauna Loa? Has there been a good rebuttal to the work of Zbigniew Jaworowski in this area. I have not done exhaustive research in the area (really just debating amongst non-science friends), but one brought up this line of argument to discredit the top graph here on historical CO2 concentrations. In researching the issue of comparability and the reliability of the CO2 measurements, I found Jaworowski and few folks countering his arguments. I'm genuinely not trolling here, just interested in the topic.
ajc, which of ZJ's claims would you like a response to? Tamino responded to the "too smooth" concern here.
It's hard to take ZJ seriously, but for detailed look at the ice core CO2 process and validation, see Etheridge 1996.
and follow cites for more recent work. For a direct rebuttal, see here. The consilience of CO2 levels between ice cores from different location (eg Greenland, Antarctica) would be big hint that the method is fundamentally sound. Furthermore, the idea that AGW is based on icecore data is hopelessly wrong. ZJ would appear to be a classic case of a scientist "gone emeritus"
ajc... Watch this small section of the Richard Alley lecture and he tells it like it is on this point. Start at min 12:10.
A good way to check on claims that have been made in journal papers is to use Google Scholar to identify papers that have cited the paper and see if any of them are critical or provide evidence that answers the claims made. I this case, I found
T. GüllükF. SlemrB. Stauffer, "Simultaneous measurements of CO2, CH4, and N2O in air extracted by sublimation from Antarctica ice cores: Confirmation of the data obtained using other extraction techniques", Journal of Geophysical Research: Atmospheres (1984–2012)l Volume 103, Issue D13, pages 15971–15978, 20 July 1998
A sublimation technique has been developed to extract air samples from polar ice cores for subsequent simultaneous measurement of several trace gases by frequency-modulated tunable diode laser absorption spectroscopy. This extraction and analysis technique is shown to be suitable as an extraction method for the determination of concentrations of the greenhouse gases CO2, CH4, and N2O in air samples of ∼1–5 cm3 recovered from ice samples of 10–50 g. Air samples from the Siple ice core have been analyzed covering the period between 1772 and 1973. In addition, a few samples from two different ice cores from Vostok station have been analyzed. Our results are in a good agreement with results obtained by other researchers using melting and crushing extraction techniques. This agreement indicates that processes connected with the formation of clathrates in ice under high pressure at greater depths and their destruction after drilling are not affecting the CO2, CH4, and N2O measurements significantly.
[emphasis mine]
Which appears to provide experimental evidence directly refuting one of Jaworowski's arguments (in addition to that provided by Etheridge). Essentially the scientists that work on ice core data do know what they are doing and do their best to examine possible sources of bias or error and eliminate them, as these two papers demonstrate.
humanity can take spot CO2 measurements but this assumes homogeneous concentrations, which are not always true. The Committee has often spoken and said, on gases, most of Earth's heat is internal, the reason similar temperatures are found a certain distance below the surface no matter where they are taken. Under Antarctica or along the equator will have similar temperatures at a certain depth (I think it’s fairly shallow, also) Sunlight and surface heat causes daily weather and seasons, of course, but this cycle is on top of the underlying base, natural heat. This is what controls climate, says The Committee.
Greater CO2 and heat cause greater evaporation, more rainfall and both carbon dioxide and rainfall encourage plant growth which consumes the CO2 to produces oxygen. The equilibrium of oxygen and CO2 has been reached long ago and fluctuates along a very narrow band too small to have climate effect. This they say, is because of the principal atmospheric gas, nitrogen, which as we know, dominates.
They say CO2 emissions caused by human activity are insufficient to alter the equilibrium; the plant response to increased rain and carbon dioxide is very efficient. The proportion remains well inside the narrow band that does not affect weather.
Earth climate is affected by the magnetosphere and the planet's molten iron core, from which heat dissipates. Most of Earth's surface is ocean; heat reaches the seafloor, where we do not and cannot measure temperatures. This affects sea water temperatures and currents, much more sensitive to small changes. (liquids much denser than gases) These are the causes of the erratic weather patterns we have felt on Earth, attributed erroneously to manmade global warming.
Welcome to Sks. Please take the time to study the comments policy on this site. When you make a claim that is contrary to well known facts, then you should provide link to the sources of your information. Whatever your "committee" is, it's source of information is laughably and grossly wrong. Please dont waste people's time by commenting on an article you obviously havent bothered to read.
For the point of this article, note the linked video showing the variation of CO2 both vertically and horizontally. Note also this image which demonstrably show no such assumption of uniformity is made. You might like to also note the OCO-2 satellite which continuously measures CO2 concentration.
I suggest you take time to read some of the climate myth articles to become better informed before commenting further. And note that the extra heating from CO2 is around 100x greater than the total geothermal heat flux.
Offtopic comment has been deleted but a commentator has helpfully provided you with more information. See here
@25, heat is the last form of energy... it is not a physical object like CO2 therefore they obey completely different rules!
Hello,
Can somebody please explain why only ice core data is used for the pre-instrumental measurement period? I understand that stomatal index data has certain problems, but then so does ice core data. Fossilized stomata data is used for the more distant past, and some Holocene studies seem pretty robust and use multiple locations, e.g. Steinthorsdottir et al. (2013).
Surely any issues with the stomatal data could be taken into account and it could be combined with ice core data to make a more accurate reconstruction of past CO2 levels. Is there simply not enough of it?
Stomata studies showing high levels of CO2 in the relatively recent past are being used to suggest that current levels are not unusual in human history, even though this contradicts ice core data. I understand the obvious problems with the Beck (2007) work for example, but what about studies suggesting higher CO2 at the end of the Younger Dryas?
It's not. Temperature measurements began in 1659. Stations were added throughout the centuries since then, becoming a truly global network beginning in 1880. Multiple proxy records extend that record literally millions of years into the past.
http://www.ncdc.noaa.gov/paleo/globalwarming/instrumental.html
http://www.ncdc.noaa.gov/oa/climate/research/1998/anomalies/anomalies.html
http://www.ncdc.noaa.gov/ghcnm/v3.php
http://www.ncdc.noaa.gov/data-access/paleoclimatology-data/datasets
http://www.realclimate.org/index.php/data-sources/
http://en.wikipedia.org/wiki/Instrumental_temperature_record
Multiproxy reconstructions are now commonplace. For example, per the PAGES 2000 reconstruction, current global surface temperatures are hotter than at ANY time in the past 1,400 years, and that while the Medieval Warm Period and Little Ice Age are clearly visible events in their reconstruction, they were not globally synchronized events.
http://www.skepticalscience.com/pages2k-confirms-hockey-stick.html
From the peak temps and CO2 at the height of the Holocene Climatic Optimum some 7,000 years ago, temps and CO2 went into a long, slow decline, until about 100 years ago. Global temperatures dropped about 0.8 degrees C.
Over the past 100 years we have entirely erased that 5,000+ years of natural cooling (Marcott et al 2013), with global temperatures rising a full degree C:
http://www.realclimate.org/images//Marcott.png
http://climatedesk.org/wp-content/uploads/2013/03/marcott-B-1000.jpg
http://www.realclimate.org/index.php/archives/2013/09/paleoclimate-the-end-of-the-holocene/
http://www.sciencemag.org/content/339/6124/1198
Given that orbital forcing is still negative, and will continue to be negative for the next several thousand years, natural forcings are not responsible for this current warming period.
Please place relevant comments and questions on the pertinent thread.
@Daniel Bailey
Sorry, perhaps I didn't phrase my question clearly enough. My question was specifically about reconstructions of CO2 levels, not temperature data.
I'm aware of the multiple proxies used for temperature reconstruction, but I can't find reconstructions of CO2 levels over the last several thousand years that use anything other than ice core data, although reconstructions over millions of years use stomata and ocean sediment for the earliest periods.
Given that stomata-based data indicate higher levels of CO2, how do we know ice core data for CO2 levels is more reliable? Once local variability and other factors are taken into account, aren't stomata indices useful proxies? Are there other proxies which could be used to back up ice core CO2 results?
APT - It is easier to have a discussion when you properly cite the papers you are referring to. I assume it is this.
My understanding is that problems with stomata are much larger than with ice core and only used when ice core is unavailable. You might like to read the published comment on your reference before being so sure of the superiority of the stomata record.
There are two further points of note:
1/ the record of high CO2 at time of Younger Dryas is being presented to support that rapidly rising CO2 levels cause climate change.
2/ The isotope signatures of CO2 at YD indicate different CO2 source to what is present today.
Feel free to delineate what you feel those limitations might be and cite your sources. The ice core data are among the best we have for the past 800,000 or so years for atmospheric gases. You're going to have to do better than just an argument from incredulity.
"seem" is hardly an objective assessment.
Surely. But still an argument from incredulity. This venue deals in evidence. Since you seem bent on making an assertion about ice core CO2 data, the burden of proof is on you, the claimant, to mount an evidence-based claim and to support it with links to the primary literature.
Citation, please.
Nebulous assertion; citation please.
Off the top of my head, Ziegler et al 2013 does just that. Further, it covers the period of the past 360,000 years.
How do you know that ice core data is less reliable than stomata data?
Yep. When used with proper contexts. Which is how they are used.
There are. I gave you a link to them in my previous comment. Here it is, again.
@Scaddenp
My apologies for not giving a full reference or link to the relevant paper. I will do so in future posts. The one you've linked to is indeed the one I was referring to, and I thank you for including the published comment on it, I had read the reply to that comment but not the comment itself, which looks like it contains the kind of information I was looking for.
At no point did I say I was sure of the superiority of stomatal records. Far from it in fact. I simply requested information about them in order to be able to explain why ice core data was considered more reliable. I am also well aware that far from being an argument against AGW, that paper supports the consensus. I'm sorry to say that I find your response to my simple and polite request for information to be rather hostile in tone and not very encouraging for those seeking information.
@Daniel Bailey
Thank you for the link to the Zeigler et al. paper. That's interesting and useful.
Since you had misunderstood my previous request, I had assumed that the link to the NOAA paleoclimate data related to temperatures rather than CO2 levels, but I see know that there are data relating to other factors affecting climate. It would be useful to know which ones relate specifically to CO2 levels but I'll search through and find them.
The rest of your post is, unfortunately, unhelpful, since I wasn't putting forward an argument of any kind but simply seeking information to counter an argument put forward by someone else. As a response to a polite request for information it is, like saddenp's, rather hostile in tone.
Even if I had been trying to cast doubt on climate science, which I wasn't, this type of response is uncalled for and hardly conducive to promoting understanding.
APT... "...how do we know ice core data for CO2 levels [are] more reliable?"
Perhaps because ice core data are actually measuring CO2 concentrations. It's a direct measurement of CO2 (or as direct as you can get before Keeling). Whereas, somata are clearly only a proxy for CO2.
APT - sorry if tone appeared hostile. We get a lot of pseudo-skeptics here with faux arguments, so knee-jerk reactions are hard to avoid. You said "used to suggest that current levels are not unusual in human history," from which I thought you were implying the "skeptic" corrollary "so no need to worry" despite YD being in our pre-civilization past. Genuine inquiry is actually very welcome so apologies.
What have read that casts doubt on ice-core measurements for CO2? A reference would be helpful.
@Rob Honeycutt - Thanks. That's a good answer, my favourite so far.
@scaddenp - As someone who's defended the science on public forums, I understand the frustration of dealing with pseudo-scientists and conspiracy theorists. In fact, that was the reason for my request. However, as friendly advice, I suggest you tone it down a bit, since such defensiveness is more likely to provoke suspicion than promote understanding.
I was able to deal with the other references I was given, since some weren't even peer-reviewed science and I was able to find strong rebuttals of those that were. The only one that seemed to cast any real doubt on the reliability of ice core data was the Steinthorsdottir (2013) paper. Incidentally, there was a response to Kohler's comment on the paper, which you can read here: LINK
Having briefly read through it all, I'd still conclude that the ice-core data is more reliable, but the issue of disagreement between ice-core data and these results doesn't seem to be fully resolved.
Steinthosdottir references two papers regarding intra-ice diffusion, Ikeda et al (2000) and Ahm et al (2008). It seems to me that these might reflect problems of identifying short term variability rather than concentration in general, but I'm no expert on such things. Is this a real issue with ice core data? Is it accounted for?
[RH] Shortened link.