


 Arguments


How do we know more CO2 is causing warming?
What the science says...
| Select a level... |
 Basic
Basic
|
 Intermediate
|
 Advanced
| ||||
|
An enhanced greenhouse effect from CO2 has been confirmed by multiple lines of empirical evidence. |
|||||||
Climate Myth...
Increasing CO2 has little to no effect
"While major green house gas H2O substantially warms the Earth, minor green house gases such as CO2 have little effect.... The 6-fold increase in hydrocarbon use since 1940 has had no noticeable effect on atmospheric temperature ... " (Environmental Effects of Increased Atmospheric Carbon Dioxide)
At-a-glance
To make a statement like, "minor greenhouse gases such as CO2 have little effect", is to ignore 160 years of science history. So let's look at who figured out the heat-trapping properties of carbon dioxide and when.
Experiments involving various gas mixtures had demonstrated the heat-trapping properties of water vapour, CO2 and methane in the 1850s. But those effects were yet to be quantified - there were no meaningful numbers. It was to be another 40 years before that happened.
Swedish scientist Svante Arrhenius (1859-1927) was the person who crunched the numbers. The results were presented in a remarkable paper, "On the Influence of Carbonic Acid in the Air upon the Temperature of the Ground", in 1896.
The many calculations in the 1896 paper include estimates of the amounts of CO2 increase or decrease required to drive the climate into a different state. One example used was the Hothouse climate of the Cenozoic, around 50 million years ago. Another was the glaciations of the last few hundred millennia.
To get a temperature rise of 8-9°C in the Arctic, Arrhenius calculated that CO2 levels would have to increase by 2.5 to 3 times 1890s levels. To lower the temperature 4–5°C to return to glacial conditions, he calculated a drop in CO2 was needed of 0.62-0.55 times 1890s levels.
We know CO2 levels in the 1890s from ice-core data. They were around 295 ppm. Let's do the sums. A reduction factor of 0.55 to 0.62 on 295 ppm gives 162.2-183.9 ppm. Modern ice-core measurements representing the past 800,000 years show that in glacial periods, CO2 levels fell to 170-180 ppm.
What we now know due to additional research since 1896 when Arrhenius worked on this, is that CO2 was an essential 'amplifying feedback'. That means changes triggered by long term, cyclic variations in Earth's orbit cause warming or cooling and CO2 release or entrapment in turn. Those changes in CO2 levels affected the strength of Earth's greenhouse effect. Changes in the strength of the greenhouse effect then completed the job of pushing conditions from interglacial to glacial - or vice-versa.
Arrhenius also made an important point regarding water vapour: "From observations made during balloon voyages, we know also that the distribution of the aqueous vapour may be very irregular, and different from the ideal mean distribution." This statement holds true today: water vapour is a greenhouse gas but because water exists in gas, liquid and solid forms in the atmosphere, it is continually cycling in and out of the air. It is distributed in a highly uneven fashion and is uncommon in the upper atmosphere. That's where it differs from CO2.
Once CO2 is up there, it's up there for a long time. As a consequence it has a pretty even distribution: 'well-mixed' is the term. As Arrhenius quantified all that time ago, once it's up there it constantly absorbs and re-radiates heat in all directions. That's why dumping 44 billion tons of it into our atmosphere in just one year (2019 - IPCC Sixth Assessment Report 2022) is a really bad idea.
Please use this form to provide feedback about this new "At a glance" section. Read a more technical version below or dig deeper via the tabs above!
Further details
Good scientific theories are said to have ‘predictive power’. In other words, armed only with a theory, we should be able to make predictions about a subject. If the theory’s any good, the predictions will come true.
Here’s an example: when the Periodic Table of the chemical elements was proposed in 1869, many elements were yet to be discovered. Using the theory behind the Periodic Table, the Russian chemist Dmitri Mendeleev was able to predict the properties of germanium, gallium and scandium prior to their discovery in 1886, 1875 and 1879 respectively. His predictions were found to be correct.
The effect on Earth's greenhouse effect of adding man-made CO2 is predicted in the theory of greenhouse gases. This theory was first proposed by Swedish scientist Svante Arrhenius in 1896, based on earlier work by Fourier, Foote and Tyndall. Many scientists have refined the theory since Arrhenius published his work in 1896. Nearly all have reached the same conclusion: if we increase the amount of greenhouse gases in the atmosphere, the Earth will warm up.
Where there is less agreement is with respect to the exact amount of warming. This issue is called 'climate sensitivity', the amount the temperatures will increase if CO2 is doubled from pre-industrial levels. Climate models have predicted the least temperature rise would be on average 1.65°C (2.97°F) , but upper estimates vary a lot, averaging 5.2°C (9.36°F). Current best estimates are for a rise of around 3°C (5.4°F), with a likely maximum of 4.5°C (8.1°F). A key reason for this range of outcomes is because of the large number of potential climate feedbacks and their variable interactions with one another. Put simply, some are much better understood than others.
What Goes Down…
The greenhouse effect works like this: Energy arrives from the sun in the form of visible light and ultraviolet radiation. The Earth then emits some of this energy as infrared radiation. Greenhouse gases in the atmosphere 'capture' some of this heat, then re-emit it in all directions - including back to the Earth's surface.
Through this process, CO2 and other greenhouse gases keep the Earth’s surface 33°Celsius (59.4°F) warmer than it would be without them. We have added 42% more CO2, and temperatures have gone up. There should be some evidence that links CO2 to the temperature rise.
So far, the average global temperature has gone up by more than 1 degrees C (1.9°F):
"According to an ongoing temperature analysis led by scientists at NASA’s Goddard Institute for Space Studies (GISS), the average global temperature on Earth has increased by at least 1.1° Celsius (1.9° Fahrenheit) since 1880. The majority of the warming has occurred since 1975, at a rate of roughly 0.15 to 0.20°C per decade."
The temperatures are going up, just like the theory predicted. But where’s the connection with CO2, or other greenhouse gases like methane, ozone or nitrous oxide?
The connection can be found in the spectrum of greenhouse radiation. Using high-resolution FTIR spectroscopy, we can measure the exact wavelengths of long-wave (infrared) radiation reaching the ground.
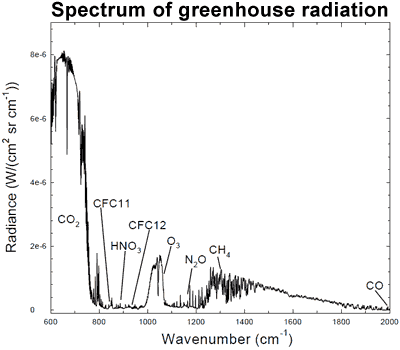
Figure 1: Spectrum of the greenhouse radiation measured at the surface. Greenhouse effect from water vapour is filtered out, showing the contributions of other greenhouse gases (Evans 2006).
Sure enough, we can see that CO2 is adding considerable warming, along with ozone (O3) and methane (CH4). This is called surface radiative forcing, and the measurements are part of the empirical evidence that CO2 is causing the warming.
...Must Go Up
How long has CO2 been contributing to increased warming? According to NASA, “Two-thirds of the warming has occurred since 1975”. Is there a reliable way to identify CO2’s influence on temperatures over that period?
There is: we can measure the wavelengths of long-wave radiation leaving the Earth (upward radiation). Satellites have recorded the Earth's outgoing radiation. We can examine the spectrum of upward long-wave radiation in 1970 and 1997 to see if there are changes.
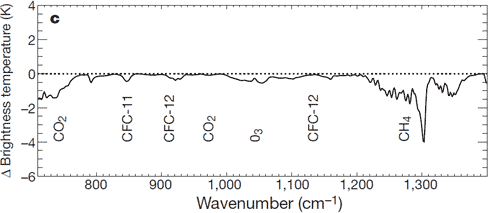
Figure 2: Change in spectrum from 1970 to 1996 due to trace gases. 'Brightness temperature' indicates equivalent blackbody temperature (Harries et al. 2001).
This time, we see that during the period when temperatures increased the most, emissions of upward radiation have decreased through radiative trapping at exactly the same wavenumbers as they increased for downward radiation. The same greenhouse gases are identified: CO2, methane, ozone and so on.
The Empirical Evidence
As temperatures started to rise, scientists became more and more interested in the cause. Many theories were proposed. All save one have fallen by the wayside, discarded for lack of evidence. One theory alone has stood the test of time, strengthened by experiments.
We have known CO2 absorbs and re-emits longwave radiation, since the days of Foote, Tyndall and Arrhenius in the 19th Century. The theory of greenhouse gases predicts that if we increase the proportion of greenhouse gases, more warming will occur.
Scientists have measured the influence of CO2 on both incoming solar energy and outgoing long-wave radiation. Less longwave radiation is escaping to space at the specific wavelengths of greenhouse gases. Increased longwave radiation is measured at the surface of the Earth at the same wavelengths.
Last updated on 16 July 2023 by John Mason. View Archives


The data from The European Project for Ice Coring in Antarctica shows results that are inconsistent with those presented here. I did a scatter plot of CO2 vs. temperature for the 800,000 years represented by that study. The first thing I noted was that the current point is way, way, way far away from the other 799. That suggests by itself that there is a fundamental structural difference in what’s going on today vs. the past. Next, I plotted the climate equation using the maximum value of λ, 1.2. It was way below the actual data points. Then I estimated the value of λ which would best fit the historical data (leaving out the current point because it is so far off). The result was a value of 20.7 which is an order of magnitude larger than the maximum value stated here of 1.2. Finally, I fit the best linear relationship. It’s R square, .79, was better than that of the log fit, .76. Can anyone give me a scientific explanation of what’s going on here?
Regarding post # 64 by Stephen Baines:
I asked a question about the law of conservation in a different thread and rceived some very interesting and compelling - to me - answers from Tom Curtis and Bob Loblaw. They were clear and very helpful!
Philosophically, I think it is important to be skeptical AND curious because the two fundamentally drive knowledge. The two above mentioned men have been extremely helpful in presenting science as I remembered it, but with much more fidelity.
I can only add here, questioning the limits our predictive powers, is that mother nature freely associates. I trust the science and I consider models as useful tools to help point to a condition that is possibly very harmful to our future. I cannot ignore, however, what I see...and for me it is sobering.
I did not read this entire thread, so forgive my question.
There was a discussion above about co2 sequestration. I understand that the ocean's ability to 'buffer' additional co2 can be helpful at first blush. But buffering mechanisms, to my way of thinking, are trade-offs if you like. From my own botany and soil science background I understand that the chemical equation will 'buffer' in the other direction as well if conditions permit. Doesn't the buffered co2 bother us? I don't see it as a long term benefit; if we stop introducing co2 into the air today, the level can drop to a point where some of the co2 is re-released into the atmosphere...or is my science off?
Not sure its been covered yet, Is a 250ppm co2 laden atmosphere thinner than a 400ppm co2 laden atmosphere.
Is it thicker in depth and does it let the same amount of solar radiation through?
vonnegut, This is covered by the post from Tom Curtis at 125, CO2 is not a big absorber of visible light or ultra violet or the wavelengths of much of the IR we recieve from the sun.
Incidentally, see my post at 126 for an example of how to deal with getting something wrong.
I’m interested in the effects of CO2 on outgoing radiation, I have some questions.
1. If an infinitely thin line were extended out perpendicular from the earth, how far would it extend before it reached a 99.9% probability (aprox.) of coming in contact with a CO2 molecule? At 280 ppm and 400 ppm.
2. When a CO2 molecule re-radiates, what is its efficiency? I.e. energy in vs energy out. An analogy would be a number of steel balls in a row, each ball does not impart all of its energy to the next. After a certain number of balls the output is almost zero. The energy is absorbed as heat in the balls.
3. Would the long wave radiation in the CO2 bands ever reach the top of the atmosphere by the relay mode?
4. What other gases emit long wave radiation when heated. I.e. the IR we see at the top of storm clouds.
5. How much would the earth’s temperature rise if all long wave radiation (CO2 bands) were filtered and showed up as heat in the lower atmosphere?
Others might have the numbers at their fingertips but here is some very quick answers.
1/ To make any sense of this question, I think you are really meaning, how far would a photon of suitable wavelength travel before it hit a CO2 molecule. I dont know the exact no.s but pretty much 100% by 10m.
2/ you are mixing up macroscopic (heat) and microscopic here. Think what "heat" means in the collision between photon and CO2. As such, the "efficiency" is 100%.
I think you get a better idea of what is going on if you look up Radiative Transfer Equation for the diffusion model, and also Beers Law (Beer's-Lambeth law). A bit much for a comment reply.
3/ Yes - pretty much the only way IR exits the atmosphere.
4/ Not sure I follow you but do you mean what are the other greenhouse gases, then prominent are water vapour, CH4, O3,NO.
5/ Dont really follow this at all. What CO2 does is absorb outgoing IR and then when it reradiates some of that re-radiation is going down (and by same path warms the surface). The gas itself doesnt heat.