


 Arguments


Do volcanoes emit more CO2 than humans?
What the science says...
| Select a level... |
 Basic
Basic
|
 Intermediate
| |||
|
Humans emit 100 times more CO2 than volcanoes. |
|||||
Volcanoes emit more CO2 than humans
"Human additions of CO2 to the atmosphere must be taken into perspective.
Over the past 250 years, humans have added just one part of CO2 in 10,000 to the atmosphere. One volcanic cough can do this in a day." (Ian Plimer)
At a glance
The false claim that volcanoes emit more CO2 than humans keeps resurfacing every so often. This is despite debunkings from bodies like the United States Geological Survey (USGS). Such claims may be easy to make, but they fall apart once a little scientific scrutiny is applied. So, to settle this once and for all, let's venture out into the fascinating world of geology, plate tectonics and volcanism.
According to the USGS, there are 1,350 active volcanoes on Earth at the moment. An active volcano is one that can erupt, even if it's decades since it last did so. As of June 2023, 48 volcanoes were in continuous eruption, meaning activity occurs every few weeks. Out of those, around 20 will be erupting on any particular day. Several of those will have erupted by the time you have finished reading this.
People are familiar with a typical volcano, an elevated area with one or more craters or fissures from which lava periodically erupts. But there are also the submarine volcanoes such as those along the mid-oceanic ridges. These vast undersea mountain ranges are a key component of Earth's Plate Tectonics system. The basalts they continually erupt solidify into the oceanic crust making up the flooring of the deep oceans. Oceanic crust is constantly moving away from any mid-ocean ridge in the process known as 'sea-floor spreading'.
Oceanic crust is chemically reactive. It reacts with seawater, allowing the formation of huge quantities of minerals including those carrying carbon in the form of carbonate. But oceanic crust is geologically young. That is because it is also being consumed at subduction zones - the deep ocean 'trenches' where it is forced down into Earth's mantle.
When oceanic crust is forced down into the mantle at subduction zones, it heats up and begins to melt into magma. Carbonate minerals in that crust lose their carbon - it is literally cooked out of them. Magmas then transport the CO2 and other gases up through Earth's crust and if they reach the surface, volcanic eruptions occur and the CO2 and other gases leave the magma for the atmosphere.
So here you can see a long-term cycle in which carbon gets trapped in the sea-floor, subducted into the mantle, liberated into new magma and erupted again. It's a key part of Earth's Slow Carbon Cycle.
Volcanoes are also dangerous. That's why we have studied them for centuries. We have hundreds of years of observations of all sorts of eruptions, at Earth's surface and beneath the oceans. Those observations include millions of geochemical analyses of both lavas and gases.
Because of all of that data collected over so many years, we have a very good idea of the amount of CO2 released to the atmosphere by volcanic activity. According to the USGS, it is between 180 and 440 million tons a year.
In 2019, according to the IPCC's Sixth Assessment Report (2022), human CO2 emissions were:
44.25 thousand million tons.
That's at least a hundred times the amount emitted by volcanoes. Case dismissed.
Please use this form to provide feedback about this new "At a glance" section. Read a more technical version below or dig deeper via the tabs above!
Further details
Beneath the surface of the Earth, in the various rocks making up the crust and the mantle, is a huge quantity of carbon, far more than is present in the atmosphere or oceans. As well as fossil fuels (those still left in the ground) and limestones (made of calcium carbonate), there are many other compounds of carbon in combination with other chemical elements, making up a range of minerals. According to the respected mineralogy reference website mindat, there are 258 different valid carbonate minerals alone!
Some of this carbon is released in the form of carbon dioxide, through vents at volcanoes and hot springs. Volcanic emissions are an important part of the global Slow Carbon Cycle, involving the movement of carbon from rocks to the atmosphere and back on geological timescales. In this part of the Slow Carbon Cycle (fig. 1), carbonate minerals such as calcite form through the chemical reaction of sea water with the basalt making up oceanic crust. Almost all oceanic crust ends up getting subducted, whereupon it starts to melt deep in the heat of the mantle. Hydrous minerals lose their water which acts as a flux in the melting process. Carbonates get their carbon driven off by the heating. The result is copious amounts of volatile-rich magma.
Magma is buoyant relative to the dense rocks deep inside the Earth. It rises up into the crust and heads towards the surface. Some magma is trapped underground where it slowly cools and solidifies to form intrusions. Some magma reaches the surface to be erupted from volcanoes. Thus a significant amount of carbon is transferred from ocean water to ocean floor, then to the mantle, then to magma and finally to the atmosphere through volcanic degassing.
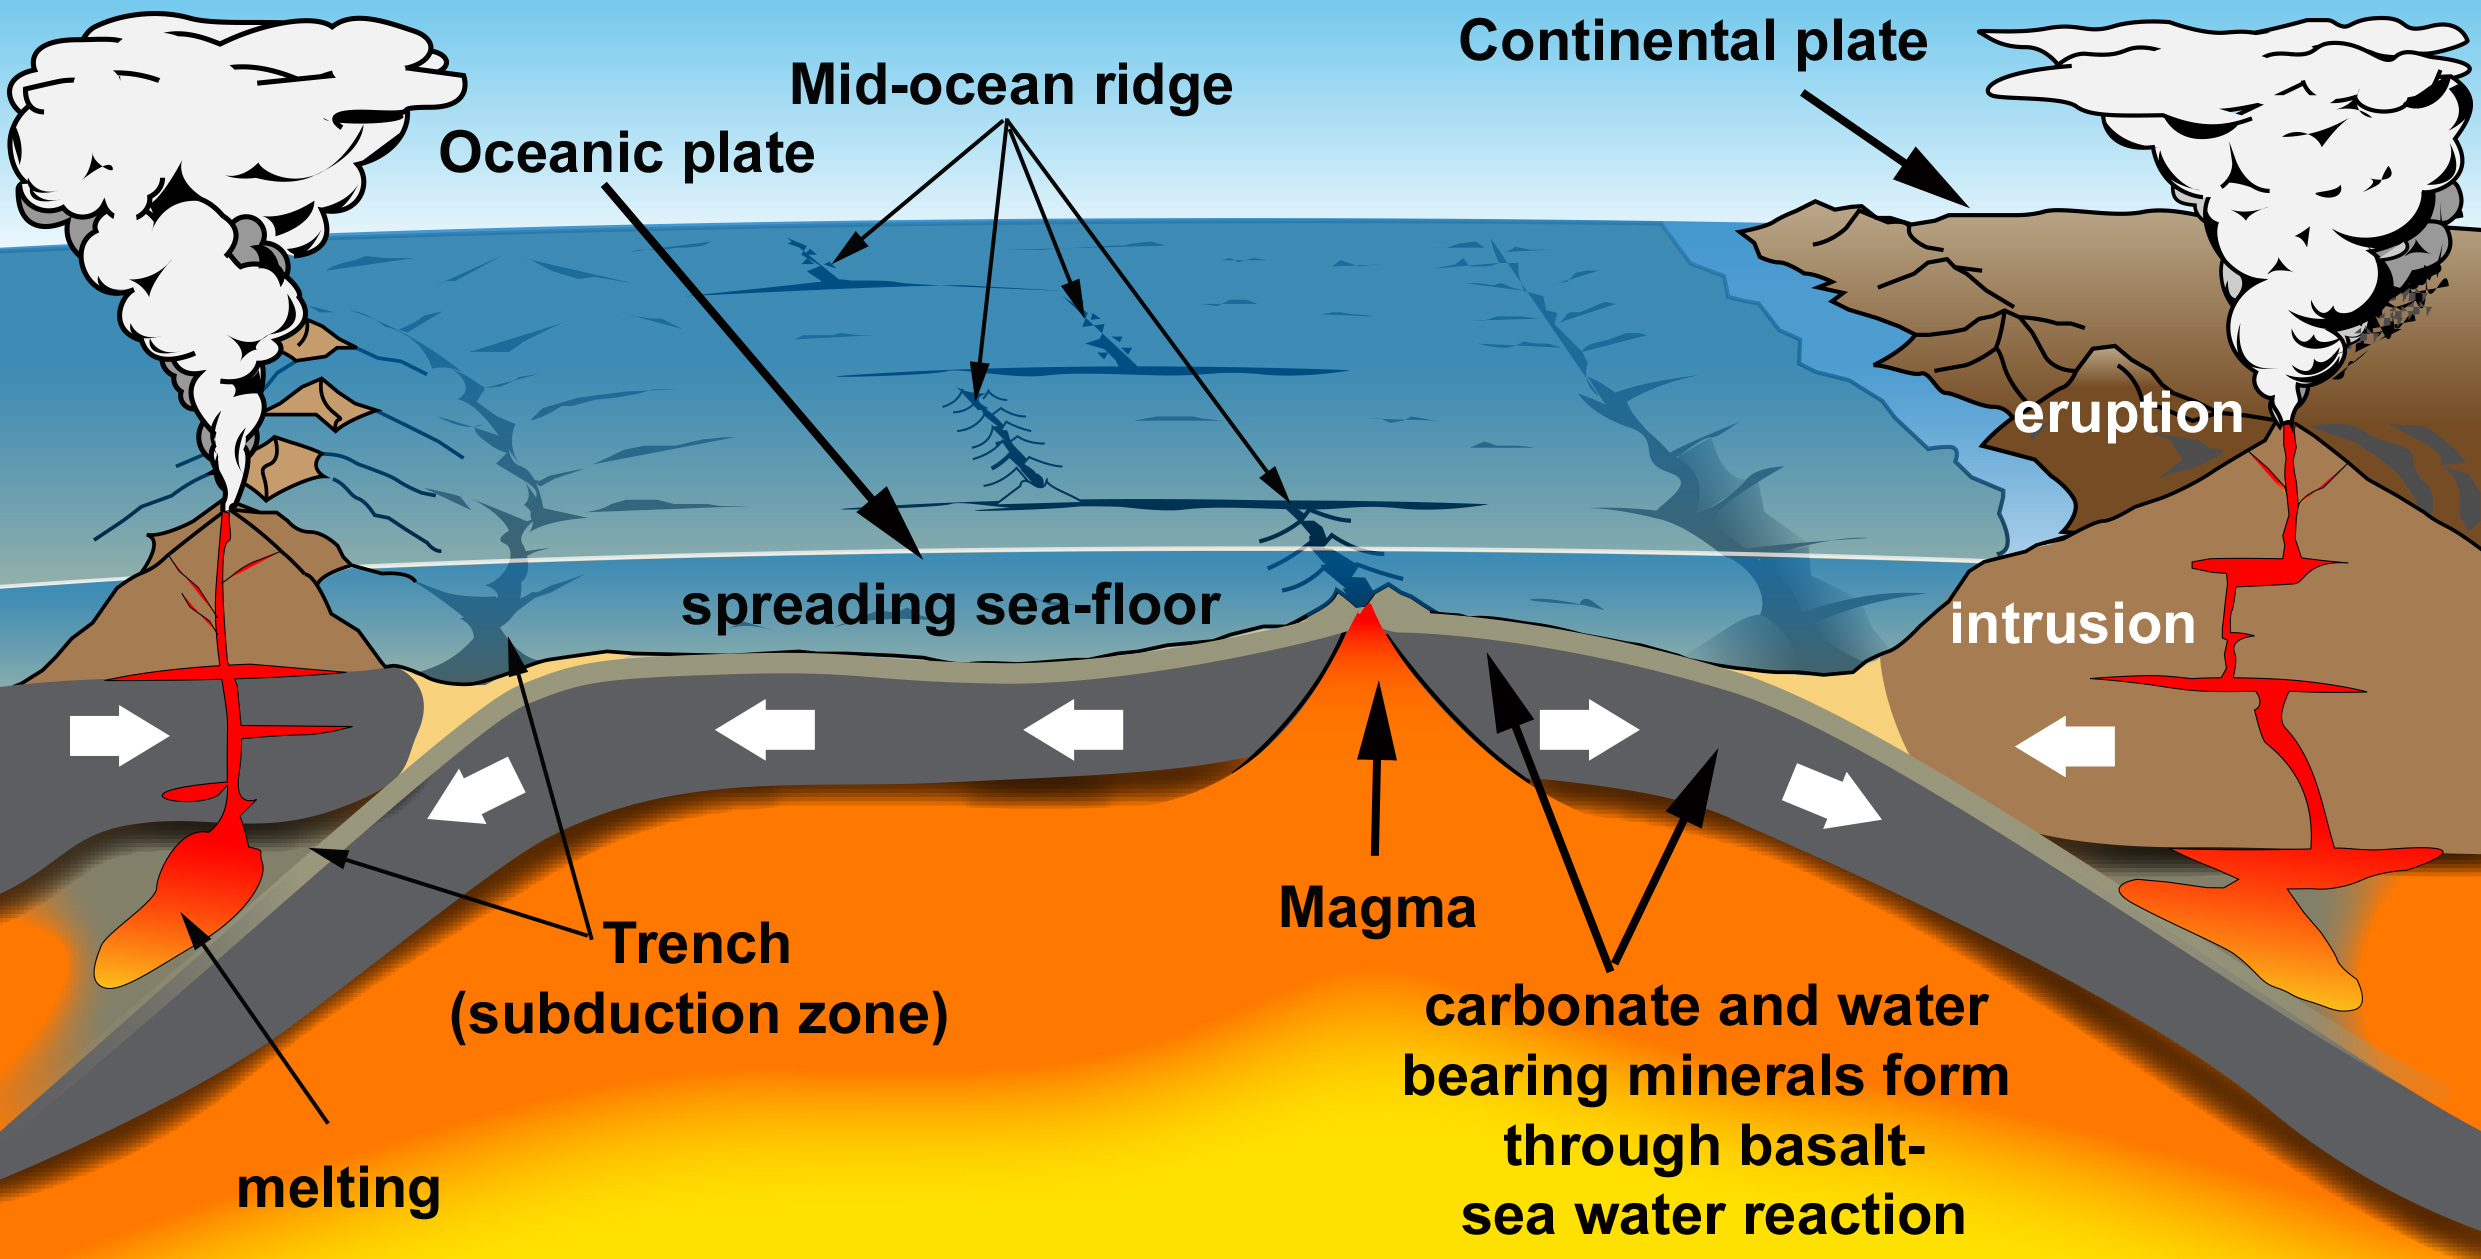
Fig. 1: An endless cycle of carbon entrapment and release: plate tectonics in cartoon form. Graphic: jg.
Estimates of the amount of CO2 emitted by volcanic activity vary but are all in the low hundreds of millions of tons per annum. That's a fraction of human emissions (Fischer & Aiuppa 2020 and references therein; open access). There have been counter-claims that volcanoes, especially submarine volcanoes, produce vastly greater amounts of CO2 than these estimates. But they are not supported by any papers published by the scientists who study the subject. The USGS and other organisations have debunked such claims repeatedly, for example here and here. To continue to make the claims is tiresome.
The burning of fossil fuels and changes in land use results in the emission into the atmosphere of approximately 44.25 billion tonnes of carbon dioxide per year worldwide (2019 figures, taken from IPCC AR6, WG III Technical Summary 2022). Human emissions numbers are in the region of two orders of magnitude greater than estimated volcanic CO2 fluxes.
Our knowledge of volcanic CO2 discharges would have to be shown to be very mistaken before volcanic CO2 discharges could be considered anything but a bit player in the current picture. They have done nothing to contribute to the recent changes observed in the concentration of CO2 in the Earth's atmosphere. In the Slow Carbon cycle, volcanic outgassing is only part of the picture. There are also the ways in which CO2 is removed from the atmosphere and oceans. If fossil fuel burning was not happening, the Slow Carbon Cycle would be in balance. Instead we've chucked a great big wrench into its gears.
Some people like classic graphs, others prefer alternative ways of illustrating a point. Here's the graph (fig. 2):
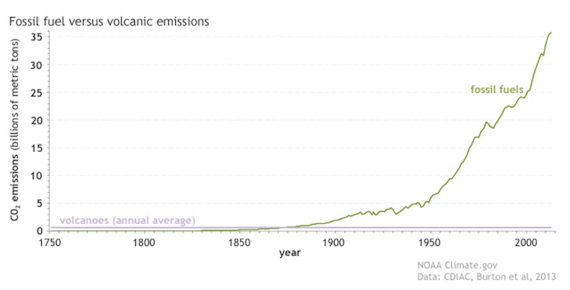
Fig. 2: Since the start of the Industrial Revolution, human emissions of carbon dioxide from fossil fuels and cement production (green line) have risen to more than 35 billion metric tons per year, while volcanoes (purple line) produce less than 1 billion metric tons annually. NOAA Climate.gov graph, based on data from the Carbon Dioxide Information Analysis Center (CDIAC) at the DOE's Oak Ridge National Laboratory and Burton et al. (2013).
And here's a cartoon version (fig. 3):
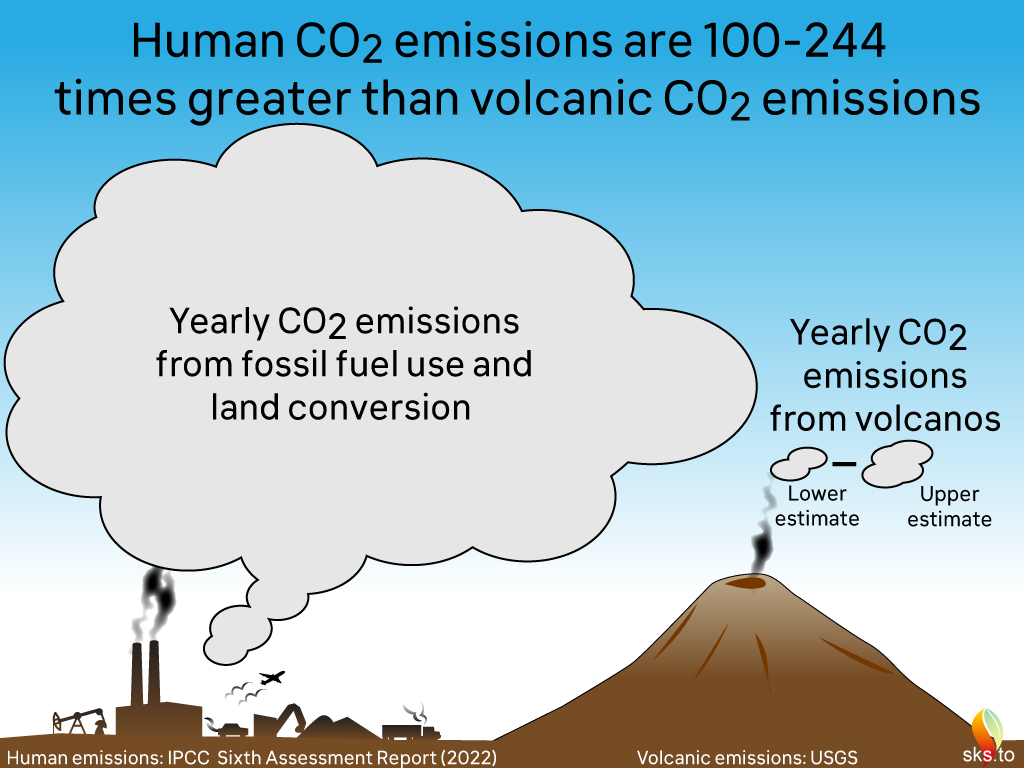
Fig. 3: Another way of expressing the difference between current volcanic and human annual CO2 emissions (as of 2022). Graphic: jg.
Volcanoes can - and do - influence the global climate over time periods of a few years. This is occasionally achieved through the injection of sulfate aerosols into the high reaches of the atmosphere during the very large volcanic eruptions that occur sporadically each century. When such eruptions occur, such as the 1991 example of Mount Pinatubu, a short-lived cooling may be expected and did indeed happen. The aerosols are a cooling agent. So occasional volcanic climate forcing mostly has the opposite sign to global warming.
An exception to this general rule, however, was the cataclysmic January 2022 eruption of the undersea volcano Hunga Tonga–Hunga Ha'apai. The explosion, destroying most of an island, was caused by the sudden interaction of a magma chamber with a vast amount of seawater. It was detected worldwide and the eruption plume shot higher into the atmosphere than any other recorded. The chemistry of the plume was unusual in that water vapour was far more abundant than sulfate. Loading the regional stratosphere with around 150 million tons of water vapour, the eruption is considered to be a rare example of a volcano causing short-term warming, although the amount represents a small addition to the much greater warming caused by human emissions (e.g. Sellitto et al. 2022).
Over geological time, even more intense volcanism has occurred - sometimes on a vast scale compared to anything humans have ever witnessed. Such 'Large Igneous Province' eruptions have even been linked to mass-extinctions, such as that at the end of the Permian period 250 million years ago. So in the absence of humans and their fossil fuel burning, volcanic activity and its carbon emissions have certainly had a hand in driving climate fluctuations on Earth. At times such events have proved disastrous. It's just that today is not one such time. This time, it's mostly down to us.
Last updated on 10 September 2023 by John Mason. View Archives


Climate Myth...