Climate Science Glossary

Term Lookup

Enter a term in the search box to find its definition.

Settings

Use the controls in the far right panel to increase or decrease the number of terms automatically displayed (or to completely turn that feature off).

Term Lookup

Settings


All IPCC definitions taken from Climate Change 2007: The Physical Science Basis. Working Group I Contribution to the Fourth Assessment Report of the Intergovernmental Panel on Climate Change, Annex I, Glossary, pp. 941-954. Cambridge University Press.

Home Arguments Software Resources Comments The Consensus Project Translations About Support

Twitter Facebook YouTube Mastodon MeWe

RSS Posts RSS Comments Email Subscribe


Climate's changed before
It's the sun
It's not bad
There is no consensus
It's cooling
Models are unreliable
Temp record is unreliable
Animals and plants can adapt
It hasn't warmed since 1998
Antarctica is gaining ice
View All Arguments...


Username
Password
New? Register here
Forgot your password?

Latest Posts

Archives

The 97% consensus on global warming

What the science says...

Select a level... Basic Intermediate Advanced

97% of climate experts agree humans are causing global warming.

Climate Myth...

There is no consensus

"[...] And I'll mention that the stat on the 97% of - of scientists is based on one discredited study." (Ted Cruz)

At a glance

What is consensus? In science, it's when the vast majority of specialists agree about a basic principle. Thus, astronomers agree that the Earth orbits around the Sun. Biologists accept that tadpoles hatch out from frog-spawn and grow into adult frogs. Almost all geologists agree that plate tectonics is real and you'd be hard-placed to find a doctor who thinks smoking is harmless.

In each above case, something has been so thoroughly looked into that those who specialise in its study have stopped arguing about its basic explanation. Nevertheless, the above examples were all once argued about, often passionately. That's how progress works.

The reaching of scientific consensus is the product of an often lengthy time-line. It starts with something being observed and ends with it being fully explained. Let's look at a classic and highly relevant example.

In the late 1700s, the Earth-Sun distance was calculated. The value obtained was 149 million kilometres. That's incredibly close to modern measurements. It got French physicist Joseph Fourier thinking. He innocently asked, in the 1820s, something along these lines:

"Why is Planet Earth such a warm place? It should be an ice-ball at this distance from the Sun."

Such fundamental questions about our home planet are as attractive to inquisitive scientists as ripened fruit is to wasps. Fourier's initial query set in motion a process of research. Within a few decades, that research had experimentally shown that carbon dioxide has heat-trapping properties.

Through the twentieth century the effort intensified, particularly during the Cold War. At that time there was great interest in the behaviour of infra-red (IR) radiation in the atmosphere. Why? Because heat-seeking missiles home in on jet exhausts which are IR hotspots. Their invention involved understanding what makes IR tick.

That research led to the publication of a landmark 1956 paper by Gilbert Plass. The paper's title was, “The Carbon Dioxide Theory of Climatic Change”. It explained in detail how CO2 traps heat in our atmosphere. Note in passing that Plass used the term "Climatic Change" all the way back then. That's contrary to the deniers' frequent claim that it is used nowadays because of a recent and motivated change in terminology.

From observation to explanation, this is a classic illustration of the scientific method at work. Fourier gets people thinking, experiments are designed and performed. In time, a hypothesis emerges. That is a proposed explanation. It is made on the basis of limited evidence as a starting point for further investigation.

Once a hypothesis is proposed, it becomes subject to rigorous testing within the relevant specialist science groups. Testing ensures that incorrect hypotheses fall by the wayside, because they don't stand up to scrutiny. But some survive such interrogation. As their supporting evidence mounts up over time, they eventually graduate to become theories.

Theories are valid explanations for things that are supported by an expert consensus of specialists. Gravity, jet aviation, electronics, you name it, all are based on solid theories. They are known to work because they have stood the test of time and prolonged scientific inquiry.

In climate science today, there is overwhelming (greater than 97%) expert consensus that CO2 traps heat and adding it to the atmosphere warms the planet. Whatever claims are made to the contrary, that principle has been established for almost seventy years, since the publication of that 1955 landmark paper.

Expert consensus is a powerful thing. None of us have the time or ability to learn about everything/ That's why we frequently defer to experts, such as consulting doctors when we’re ill.

The public often underestimate the degree of expert consensus that our vast greenhouse gas emissions trap heat and warm the planet. That is because alongside information, we have misinformation. Certain sections of the mass-media are as happy to trot out the latter as the former. We saw a very similar problem during the COVID-19 pandemic and it cost many lives.

For those who want to learn more, a much longer detailed account of the history of climate science is available on this website.

Please use this form to provide feedback about this new "At a glance" section. Read a more technical version below or dig deeper via the tabs above!


Further details

We know full well that we don’t have the time or capacity to learn about everything, so we frequently defer to the conclusions of experts. Without experienced people using their expertise to perform many vital tasks – and without new people constantly entering such occupations – society would quickly disintegrate.

The same is true of climate change: we defer to the expert consensus of climate scientists. Indeed, public perception of the scientific consensus with regard to global warming has been found to be an important gateway into other enlightened climate-related attitudes - including policy support. 

Nine consensus studies

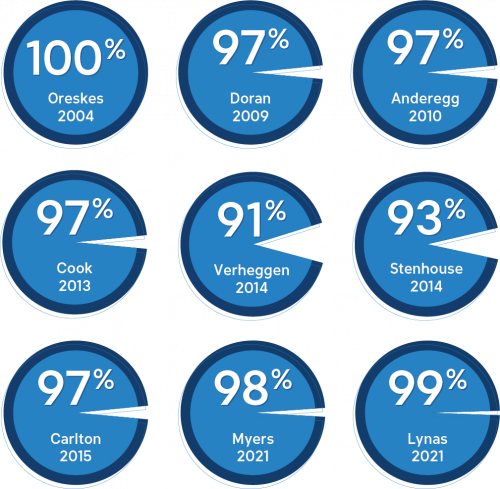
Let's take a look at summaries of the key studies, featured in the graphic above, into the degree of consensus. These have been based on analyses of large samples of peer-reviewed climate science literature or surveys of climate and Earth scientists. These studies are available online through e.g. Google Scholar. That slightly different methodologies reached very similar conclusions is a strong indicator that those conclusions are robust.

Oreskes 2004

In this pioneering paper, a survey was conducted into all peer-reviewed abstracts on the subject 'global climate change', published between 1993 and 2003. The work showed that not a single paper, out of the 928 examined, rejected the consensus position that global warming is man-made. 75% of the papers agreed with the consensus position while 25% made no comment either way.

Doran & Zimmerman 2009

A survey of 3,146 Earth scientists asked the question, "Do you think human activity is a significant contributing factor in changing mean global temperatures?" Overall, 82% of the scientists answered yes. However, what was most interesting was the type of response compared to the level of expertise in climate science. Of scientists who were non-climatologists and didn't publish research, 77% answered yes. In contrast, 97.5% of actively-publishing climatologists responded yes. As the level of active research and specialization in climate science increases, so does agreement that humans are significantly changing global temperatures. The paper concludes:

"It seems that the debate on the authenticity of global warming and the role played by human activity is largely non-existent among those who understand the nuances and scientific basis of long-term climate processes. The challenge, rather, appears to be how to effectively communicate this fact to policy makers and to a public that continues to mistakenly perceive debate among scientists."

Anderegg et al. 2010

This study of 1,372 climate science researchers found that (i) 97–98% of the researchers most actively publishing in the field support the tenets of anthropogenic climate change (ACC) as outlined by the IPCC and (ii) the relative climate expertise and scientific prominence of the researchers unconvinced of ACC are substantially below that of the convinced researchers. 

Cook et al. 2013

A Skeptical Science-based analysis of over 12,000 peer-reviewed abstracts on the subject 'global climate change' and 'global warming', published between 1991 and 2011, found that over 97% of the papers taking a position on the subject agreed with the consensus position that humans are causing global warming. In a second phase of the project, the scientist authors were emailed and rated over 2,000 of their own papers. Once again, over 97% of the papers taking a position on the cause of global warming agreed that humans are causing it.

Verheggen et al. 2014

Results were presented from a survey held among 1868 scientists studying various aspects of climate change, including physical climate, climate impacts, and mitigation. The survey was at the time unique in its size, broadness and level of detail. Consistent with other research, it was found that as the level of expertise in climate science grew, so too did the level of agreement on anthropogenic causation. 90% of respondents with more than 10 climate-related peer-reviewed publications (about half of all respondents), explicitly agreed with anthropogenic greenhouse gases (GHGs) being the dominant driver of recent global warming. The respondents’ quantitative estimate of the GHG contribution appeared to strongly depend on their judgement or knowledge of the cooling effect of aerosols.

Stenhouse et al. 2014

In a survey of all 1,854 American Meteorological Society members with known e-mail addresses, achieving a 26.3% response rate, perceived scientific consensus was the strongest predictor of views on global warming, followed by political ideology, climate science expertise, and perceived organisational conflict.

Carlton et al 2015

Commenting that the extent to which non-climate scientists are skeptical of climate science had not so far been studied via direct survey, the authors did just that. They undertook a survey of biophysical scientists across disciplines at universities in the Big 10 Conference. Most respondents (93.6%) stated that mean temperatures have risen. Of the subset that agreed temperatures had risen, the following question was then asked of them: "do you think human activity is a significant contributing factor in changing mean global temperatures?" The affirmative response to that query was 96.66%.

Cook et al. 2016

In 2015, authors of the above studies joined forces to co-author a paper, “Consensus on consensus: a synthesis of consensus estimates on human-caused global warming”. Two key conclusions from the paper are as follows:

(i) Depending on exactly how you measure the expert consensus, somewhere between 90% and 100% of climate scientists agree humans are responsible for climate change, with most of our studies finding 97% consensus among publishing climate scientists. (ii) The greater the climate expertise among those surveyed, the higher the consensus on human-caused global warming.

Lynas et al. 2021

In this paper, from a dataset of 88,125 climate-related peer-reviewed papers published since 2012, these authors examined a randomly-selected subset of 3000 such publications. They also used a second sample-weighted approach that was specifically biased with keywords to help identify any sceptical papers in the whole dataset. Twenty-eight sceptical papers were identified within the original dataset using that approach, as evidenced by abstracts that were rated as implicitly or explicitly sceptical of human-caused global warming. It was concluded that the scientific consensus on human-caused climate change, expressed as a proportion of the total publications, exceeds 99% in the peer reviewed scientific literature.

Myers et al. 2021

This study revisited the 2009 consensus among geoscientists, while exploring different ways to define expertise and the level of agreement among them. The authors sent 10,929 invitations to participate in the survey, receiving 2,780 responses. In addition, the number of scientific publications by these self-identified experts in the field of climate change research was quantified and compared to their survey response on questions about climate change. Perhaps not surprisingly, the study found that agreement on anthropogenic global warming was high at 91% to 100% and generally increases with expertise. Out of a group of 153 independently confirmed climate experts, 98.7% of those scientists agreed that the Earth is warming mostly because of human activities such as burning fossil fuels. Among the subset with the highest level of expertise, these being independently-confirmed climate experts who each published 20+ peer-reviewed papers on climate change between 2015 and 2019, there was 100% agreement.

Public Polls and Consensus

Opinion polls are not absolute in the same way as uncontestable scientific evidence but they nevertheless usefully indicate in which way public thinking is heading. So let's look at a couple taken 13 years apart. A 15-nation World Public Opinion Poll in 2009 PDF), with 13,518 respondents, asked, among other questions, “Is it your impression that among scientists, most think the problem is urgent and enough is known to take action?” Out of all responses, just 51% agreed with that. Worse, in six countries only a minority agreed: United States (38%), Russia (23%), Indonesia (33%), Japan (43%), India (48%), and Mexico (48%). Conversely, the two highest “agree” scores were among Vietnamese (69%) and Bangladeshis (70%) - perhaps unsurprisingly.

The two other options people had to choose from were that “views are pretty evenly divided” (24% of total respondents), or “most think the problem is not urgent, and not enough is known to take action“ (15%). American and Japanese respondents scored most highly on “views are pretty evenly divided” (43 and 44% respectively).

How such a pervasive misperception arose, regarding the expert consensus on climate change, is no accident. Regular readers of this website's resources will know that instead, it was another product of deliberate misinformation campaigning by individuals and organizations in the United States and other nations around the world. These are people who campaign against action to reduce carbon emissions because it suits their paymasters if we continue to burn as much as possible. 

Step forward to 2022 and the situation has perhaps improved, but there's still some way to go. A recent poll, Public Perceptions on Climate change (PDF), was conducted by the Policy Institute, based at King's College London, UK. It quizzed samples of just over 2,000 people from each of six countries (UK, Ireland, Norway, Poland, Italy and Germany). The survey asked the question: “To the best of your knowledge, what percentage of climate scientists have concluded that human-caused climate change is happening?” The following averages were returned: the UK sample thought 65%, the average of the whole survey was 68% and the highest was Ireland at 71%. Clearly, although public perception of expert consensus is growing, there's still plenty of room for strategies to communicate the reality and to shield people from the constant drip-feed of misinformation.

Expert and Public Consensus

Finally, let's consider the differences between expert and public consensus. Expert consensus is reached among those who have studied complex problems and know how to collect and work with data, to identify what constitutes evidence and evaluate it. This is demanding work requiring specific skill-sets and areas of expertise, preparation for which requires years of study and training. 

Public consensus, in contrast, tends to occur only when something is blindingly obvious. For example, a serial misinformer would struggle if they tried running a campaign denying the existence of owls. Everyone already knows that of course there are owls. There is public consensus because we see and hear owls, for real or on the TV or radio. But complex issues are more prone to the antics of misinformers. We saw examples of misinformation during the COVID pandemic, in some cases with lethal outcomes when misinformed people failed to take the risks seriously. There's a strong parallel with climate change: it is imperative we accept the expert consensus and not kick the can down the road until the realisation it is real becomes universal – but utterly inescapable.


Update May 26, 2023: The "At a glance" section was updated to improve readability.

Last updated on 26 May 2023 by John Mason. View Archives

Printable Version  |  Offline PDF Version  |  Link to this page

Argument Feedback

Please use this form to let us know about suggested updates to this rebuttal.

Related Arguments

Further reading

Richard Black at the BBC investigates whether there is a bias against skepticism in the scientific community.

More on what we're talking about when we say "scientific consensus,"  in an essay founded on Denial101x and scientific literature: Scientific Consensus isn’t a “Part” of the Scientific Method: it’s a Consequence of it. (or via archive.org)

Further viewing

The "Climate Denial Crock of the Week" video series examines the list of "32,000 leading skeptical scientists."

Naomi Oreskes gives a thorough presentation of the development of our scientific understanding of anthropogenic global warming:

Lead author John Cook explains the 2016 "Consensus on consensus" paper.

Here is a video summary of the various studies quantifying the scientific consensus on human-caused global warming, as well as the misinformation campaigns casting doubt on the consensus.

Acknowledgements

Many thanks to Joe Crouch for his efforts in tracking down scientific organizations endorsing the consensus as well as links to their public statements.

Update

On 21 Jan 2012, we revised 'the skeptic argument' with a minor quote formatting correction.

Comments

Prev  1  2  3  4  5  6  7  8  9  10  11  12  13  14  15  16  17  18  19  20  Next

Comments 151 to 175 out of 524:

  1. Oops - in a key sentence, I used angle brackets and it mkes no sense now. Let's try: The danger of a "concensus" is its use in the non-scientific arena, as in: "If CONCENSUS then ACTION".
  2. So where does the Scientific Method inject "consensus" into conclusion? Consensus, by definition, is a social and political construct that has no use in real science.
  3. Wow, Quietman, you actually agree with this drivel spouted by Bruce in 137 and 138? I was enjoying reading your posts, but Bruce is just spouting random bits of exaggerated BS full of spelling errors, ad hominems, straw men and insults all of which are completely devoid of facts and none of which are referenced for our edification (dang that pesky need to support your statements on a science oriented forum!). I suppose I would personally be more reluctant to acknowledge and agree with bumbling ignorance, even if it did indirectly support my position. Bruce, your words make my blood boil. I read nearly every post of Quietman (and the extent of the ongoing discussion) with thoughtful speculation and an open mind. Your rant, however, does a great disservice to the spirit of intelligent discussion and has no place in this forum. There seems to be a big hullabaloo about the semantics of “consensus;” clearly a poor word choice. Of course everyone will be all over me on this, but, it appears that it is a word used to categorize the empirical findings of climate related research. As such, theoretically a paper is critically examined and peer reviewed, then receives the somewhat nebulous classification of “for” (supporting/confirming etc.) or “against” (fail to support/reject alt hypoth/accept null/disconfirm) the argument that the earth is warming and human CO2 emissions are to blame (AGW/ACC). So, for the sake of clarifying semantics, the IPCC has created two piles and thus far (according to their review) the “consensus” or majority of papers demonstrate support for AGW as an alternative hypothesis to…whatever the null may be. I suppose the big sticking point in the use of consensus, as Tiranse [152] points out, is that it is a political/social construct. Thus, we often introduce the scientists as the targets of the discussion, and whether or not such individuals or their respective organizations support AGW theory, as opposed to the papers themselves and the merit of the evidence and methodological rigor contained therein. This then leads to counting exercises and comparing our respective clans of scientists as opposed to the collection of evidence that is available. Please don’t hate the messenger.
  4. As an Earth Science scientist with 40 years experience and as someone who has written technical papers and reviewed others, I think it is misleading to talk about consensus in matters of science. A scientific hypothesis has to stand or fall on the data and evidence which supposedly supports that hypothesis. Comments by Al Gore to the effect that "the debate is over, we have a consensus" only go to show his lack of knowledge about science and perhaps throw some light on the political nature of the global warming debate as opposed to its scientific merits. The sad thing about this debate is that it seems just about impossible to obtain any raw, unbiased data on the subject. There are so many sources of temperature data for example and many sets of data have been adjusted for one reason or another. Therefore for every "real " graph you post on your website , I can find another apparently "real" graph based on real data which contradicts your graph. So where does that leave us in trems of finding the truth about global warming? In future I will be posting some speific questions for you, but for now, I would like to make these few general observations based on my experience. 1. Climate can change over time due to natural causes - I don't think you would have a problem with this statement. I therefore scratch my head in disbelief when people talk about combatting climate change as if a changing climate is something new and has to be stopped. 2. The IPCC ( UN ) is a political organisation and the reports of the UN naturally reflect the in-vogue political beliefs prevalent at the time. Remember the hole-in- the-ozone-layer crisis? Whatever happened to that ? So it is even more important to look closely at any claims made by the IPCC. The data on which their claims are based have to be scrutinised very carefully. I must say that to date I have not seen any hard data to show that the earth is warming at an unusual and alarming rate. And even less evidence to show that this is caused by man-made CO2 emissions. 3. There are many tens of thousands of reputable scientists, including some who used to work on the UN climate change panel, who are skeptical of the IPCC's claims on global warming. In my field of expertise, amongst my colleagues, most are skeptical of the IPCC's claims, but, interestingly, few will speak their mind publicly on this matter because it is not seen as politically correct.It could also adversely affect their careers. 4. Scientific theories can be falsified and in the case of the IPCC's claim regarding global warming, I believe this claim can be and has been falsified even using the IPCC's own data. However when this is done the global warming supporters reply with statements like " you should not have used the unadjusted satellite temperature data. You should have used data set X or data set Y " ( depending on what result they want to show ). The mere fact that there does not seem to be one definitive and acccepted set of temperature data shows how difficult it is to come up with a real value for the average global temperature to within say 0.5 degrees of accuracy let alone explain the cause of any such minor anomalies. Yet these are the sorts of minor anomalies that the IPCC is using to justify its claim of catastrophic man-made global warming. Not forgetting that the IPCC itself also adjusts the original data for various reasons. These adjustments alone can be of a similar size to the temperature anomalies which are being sought.
  5. re #153 Yes, that's well said Ex Scienta Vera (your comments on the semantics of the word "consensus"). I think your comments constitute a rather obvious statement of the meaning of "consensus" in the scientific arena, namely that it relates to an informed, critical and tested asessment of the evidence. In other words a scientific consensus arises when the evidence on a particular subject becomes sufficiently strong that a broadly consistent informed opinion arises. Of course those that wish to manufacture an impression of uncertainty in scientific fields love "arguments" based on mangling semantics, and in this particular case it's very common to read assertions that "consensus" is something like a body of opinion that is chosen based on some sort of undefined preference, much in the way I and a group of friends might come to a "consensus" on what film we should go and see tonite! This is very widespread and examples can be found all over this website. Here's an example in a recent thread: " If hypotheses A & B are equally likely to be true(based on the evidence), then the fact that most scientists believe A to be valid and most plumbers believe B to be valid, doesn't mean that we should take the *beliefs* of scientists to be more likely true." Good, yes?! Of course if two imaginary undefined hypothesed are "equally likely to be true (based on the evidence!)" then why should we believe the opinions of anyone in particular? However that's obviously not how a scientific consensus arises. First of all we have to define exactly what the consensus refers to specifically, and having done this we could (if we wanted to) assess the evidence base from which that particular consensus was informed. We generally find that a strong consensus has a strong evidence base. Pretty obvious really.
  6. re #154 neilperth
    As an Earth Science scientist with 40 years experience and as someone who has written technical papers and reviewed others, I think it is misleading to talk about consensus in matters of science.
    It's an interesting point, and there's no doubt that the notion of "consensus" in science has been usurped by some rather dubious self interests. However, it is useful (since the question does occasionally arise!) to test informed opinion in relation to a specific scientific issue. This is obviously important on medical issues, for example, where best practice can be assessed in relation to clinical treatments and outcomes, and a consensus formulated based on the evidence. I would have thought one could similarly assess the consensus on specific matters relating to Earth Science. For example, I'm sure informed opinion would reveal rather strong consensus on the following specific issues: 1. the origin of the ice age cycles of the last several hundred 1000 years. 2. the formation of the Alps 3. The reason that Scotland is slowly gaining altitude while Southern England is sinking somewhat. (etc., one could obviously come up with many, many examples). Of course these aren't issues that are particulalry amenable to political misrepresentation (outside the creationist community anyhow), and so one doesn't generally hear people whining about "consensus", and pretending that these issues are merely matters of "opinion" amongst a set of scientists! So if one is honest and careful over the semantics of "consensus", it's a rather useful concept in science, and indeed in the communication of science to the general public....
  7. hmmm, my last post didn't post properly, here it is again... re #154 Neilperth
    The sad thing about this debate is that it seems just about impossible to obtain any raw, unbiased data on the subject. There are so many sources of temperature data for example and many sets of data have been adjusted for one reason or another.
    Well yes there are many sources of temperature data. There is the temperature data compiled by NASA GISS [*], by the UK Hadley Centre [**], by the NOAA [***], there are sea surface temperature data from direct measurements and from satellites. There is the temperature data from the US Climate Reference Network [****]. One can even construct a temperature record by analysis of the retreat of mountain glaciers [*****]…and so on…. These all lead to a rather similar conclusions with respect to local and global scale warming of the last century. I'm not sure what kind of temperature data you want! We do seem to have quite a lot of it. Of course many scientific measurements are adjusted. However we can if we want to look at some unadjusted data sets (e.g. the NASA GISS temperature data with all of the adjusted urban sites removed), or a subset of the US surface measures based only on the "best" set of stations, as described here [******]. Again, these lead to very similar conclusions as those derived from the full datasets.
    Therefore for every "real " graph you post on your website , I can find another apparently "real" graph based on real data which contradicts your graph. So where does that leave us in trems of finding the truth about global warming?
    That's an interesting point. I assume that, as a scientist, you obtain much of your information on scientific issues from the scientific literature and from well-validated sources like the data repositories of NOAA, NASA and such like. Thus you are bemoaning the abundant misrepresentations of the science that exists on the internet..yes? Assuredly there is loads of rubbish on the web (a few posters on this site occasionally bring it to our attention!). Obviously "finding the truth about global warming" involves being rather sensible about data sources – but I'm sure as a scientist you practice that. I guess a good way of assessing your "apparently "real" graph based on real data which contradicts your graph", would be for you to post some examples. Your points are interesting with respect to "consensus" (the subject of this thread) and it does bear on the question why some rather large "chunks" of the general public in the US are poorly informed (and rather astonishingly, seem actively to choose to be poorly informed) on some rather straightforward scientific issues. That's a whole other subject! [*] http://data.giss.nasa.gov/gistemp/ [**] papers describing Hadley Hadcrut methodologies here: http://www.cru.uea.ac.uk/cru/data/temperature/#sciref [***] http://www.ncdc.noaa.gov/gcag/index.jsp [****] http://www.ncdc.noaa.gov/crn/ [*****] J. Oerlemans (2005) Extracting a Climate Signal from 169 Glacier Records Science 308, 675 – 677 abstract: I constructed a temperature history for different parts of the world from 169 glacier length records. Using a first-order theory of glacier dynamics, I related changes in glacier length to changes in temperature. The derived temperature histories are fully independent of proxy and instrumental data used in earlier reconstructions. Moderate global warming started in the middle of the 19th century. The reconstructed warming in the first half of the 20th century is 0.5 kelvin. This warming was notably coherent over the globe. The warming signals from glaciers at low and high elevations appear to be very similar. [******] http://www.skepticalscience.com/Is-the-US-Surface-Temperature-Record-Reliable.html
  8. Thanks for your comments Chris. The data I look at does come from reputable sources like NOAA, Hadcrut and GISS. Often the way the data is presented as graphs puts a certain "spin" on the data depending on what the author wants to show. I did come across one interesting graph which shows the apparent increase of global temperature with time which is not plotted in the usual form of anomalies from an arbitrarily selected base-case. On the same graph is plotted the amount of CO2 in the atmosphere plotted as a function of its % contribution to the atmosphere. This graph shows the global temperature / CO2 data in a more realistic perspective. I will post the graph for you to see when I relocate it. Regarding consensus in science, my main point was that in the case of global warming / CO2 studies, by the very nature of what is being studied (very small changes in a massive and complex climate system about which we understand little and then projecting these relationships into the future) there is considerable room for doubt regarding the findings of the IPCC. The UN and world governments apparently intend to spend hundreds of billions of dollars combatting global warming based on some very shaky temperature trends. It is of some concern therefore that the "consensus" which is being touted is a consensus apparently within the IPCC ( UN ) itself. This is the same group that presents the climate data and which is pushing for massive expenditure to combat so called climate change. There is an obvious conflict of interest here and to talk about a consensus on man-made global warming within the IPCC (UN) under such circumstances is rather circular logic. Of course there would be consensus within the IPCC on this subject. The very existence of the IPCC relies on the supposed threat from man-made global warming. It is a bit like asking the National Rifle Asoociation if there is a consensus within the NRA that people should be allowed to own guns. In the wider scientific community there exists considerable skeptism regarding the claims of the IPCC.
  9. Chris, the graph I mentioned above can be found at www.junkscience.com/MSU_Temps/Warming_Look.html#RSS It is the graph at the bottom of the page on the left. Actually the Y scale does show the temperature as an anomaly rather than an absolute figure. I had intended to change this, but I could not do so. However, if you look at the graph and assume the 0 mark on the Y scale is say 16 degrees, you can see that the global temperature in 1856 was about 15.8 degrees and "now" ( say year 2005 on the graph ) the temperature is about 16.4 degrees. On the same graph is shown the amount of CO2 in the atmosphere for the same time period. The source of the data is shown on the graph. I think this graph gives a better perspective of the changes in temperature and CO2 over that time period. The website also gives some good examples of how you can influence the wiewer of any graph by changing the scale of the graph.
  10. re #159 Goodness Neil, that really is junk! I assume that the graph at the bottom left of the page that you refer to is to illustrate how one can "magic" the disappearance of real changes in observables, and thus remove essentially all information from the reader! The data in a graph should pretty much fill the space available. After all the point of presenting a graph is to inform the reader, and (I'm sure you know this as someone who has written and reviewed technical papers) this is best done by allowing the data to fill the graph (i.e. don't show unnecesary empty space by having axes that extend way beyond the actual data). In fact as I'm sure you know, this is standard practice in presenting scientific data. I've reproduced a paragraph on data presentation from the "Instructions to Authors" of a scientific journal below (The Biochemical Journal as it happens, 'though one could choose many examples) which emphasises this very obvious point [***] The other point of course, is that a graph is never the only bit of information a reader will see, and there will always be some context. So for example a presentation of 20th century temperature evolution and atmospheric CO2 rise might be accompanied by the following relevant information: 1. It's not possible to reproduce the temperature evolution using known climate contributors without incorporating anthropogenic greenhouse forcing. 2. The temperature rise observed during the last 100 or so years is aproaching around 1/6th of the total temperature rise during the 5000 years of the last glacial to interglacial transition. 3. The very large rise in atmospheric CO2 since the pre-industrial age (around 115 ppm) is already larger than the CO2 rise during the entire 5000 years of the last glacial to interglacial transition, and has taken atmospheric CO2 levels to a concentration not reached during the last million years at least. 4. Current understanding of the relationship between earth surface temperature and greenhouse gas concentrations indicates that doubling of atmosphere CO2 results in an equlibrium temperature rise of the order of 3 oC. 5. The equilibrium temperature rise expected from levels of atmospheric CO2 that will be reached by mid 20th century, are similar to those exisiting during the last interglacial period when sea levels were around 4 metres higher than now... etc. etc. [***] from the "Instructions to Authors" (my highlights):
    Figures will usually be reduced in size to occupy a single column (width 8.5 cm) or less unless a larger format is necessary for clarity. All lettering and symbols should be produced to be at least 1.5 mm, but not more than 3 mm, after reduction. All curves and lines should be drawn clearly, and of a line thickness that allows for the reduction in size on final printing. Axes should not extend appreciably beyond the curves, and it is often unnecessary for an axis scale to start at 0; only the part of the scale relevant to the curves should be given.
    pretty standard stuff..
  11. Any graph can be made to emphasise what the maker of the graph wants to show. The IPCC is particularly good at this, even going as far as shading in the green ( good ) bits and the red ( bad ) bits on some of their graphs. The graph example I gave simply shows the data from a different perspective. I assume you have no problem with the actual data plotted on the graph, only the way it is presented? In terms of what the graph is designed to show, it is correct. If it does not clearly show the IPCC's "catastrophic" temperature increases of 0.5 degrees or so, that is because the graph is not designed to show that. There are many other graphs which show that. Anyone interested in AGW will no doubt look at many graphs and hopefully he/she will understand what is shown on each graph and understand how it has been presented. Why did you send me information regarding how graphs should be presented in a scientific journal. When the graph I mentioned was never made to be presented in a scientific journal.
  12. Chris. Regarding your point 1 above "1. It's not possible to reproduce the temperature evolution using known climate contributors without incorporating anthropogenic greenhouse forcing." As I understand it, the authors of chapter 1 of "Climate Change 2001 - The Climate System : An overview" wrote : " The fact that global temperature has increased since the late 19th century and that other trends have been observed does not necessarily mean that an anthropogenic effect on climate has been identified. Climate has always varied on all time scales, so the observed change may be natural".
  13. Neil, if one is going to cite the IPCC (or science in general!) one should recognise that knowledge and understanding advances. Rather than refer to 10 year old science in a report prepared 9 years ago and published 8 years ago, it makes sense to address the most up to date IPCC report (if one wishes to obtain the IPCC position). This can be found here: http://www.ipcc.ch/publications_and_data/publications_ipcc_fourth_assessment_report_synthesis_report.htm a good starting point is the Summary for Policymakers which can be found here: http://www.ipcc.ch/pdf/assessment-report/ar4/syr/ar4_syr_spm.pdf and the relevant information can be found on pages 5 and 6. This indicates that even the presentation of the rather conservative IPCC are quite consistent with my statement that: It's not possible to reproduce the temperature evolution using known climate contributors without incorporating anthropogenic greenhouse forcing. Of course that's simply a statement of fact. One can address this further by going back to the original scientific literature, particularly the science published in the last few years since the 2007 IPCC report urled just above.....
  14. re #161 re your question: "Why did you send me information regarding how graphs should be presented in a scientific journal. When the graph I mentioned was never made to be presented in a scientific journal?" The answer is that this statement in the "Instructions to Authors" of a scientific journal simply reiterates what all scientists know already, namely that in presenting scientific data in graph form, one should allow the data to fill the available space. It's only those that have something to hide that would present the ludicrous graph that you drew to our attention! as for: "If it does not clearly show the IPCC's "catastrophic" temperature increases of 0.5 degrees or so, that is because the graph is not designed to show that." That's silly 'though isn't it. If the temperature rise is 0.5 oC (or whatever) that should certainly be apparent in a graph designed to present the temperature rise! Otherwise someone is trying very hard to present a dishonest depiction of the data. Of course if you're an Earth Science scientist with 40 years experience and as someone who has written technical papers and reviewed others, you surely know that...
  15. Chris, there is considerable skeptisism regarding the claim made by the IPCC that man-made CO2 emissions are causing catastrophic global warming. That is why websites such as this exist and why you and I and others are discussing this issue. Therefore your quoting the IPCC's viewpoint on this as being the "truth" is rather cirular logic. A bit like a Christian arguing that the Bible is true because the Bible says it is true. Your satement that : "It's not possible to reproduce the temperature evolution using known climate contributors without incorporating anthropogenic greenhouse forcing" carries little weight with me, I assume you are referring to the IPCC's computer models and predictions based on these models. Models are models, they are not reality. In any event, the model averages plotted in many IPCC diagrams result in a smoothing of the simulated natural variations that are present in individual GCM model runs.In fact most model runs actually show short periods of cooling over periods of say 10 years. Thus some infer from this that the lack of warming since 1998 is caused by a natural cooling forcing of sufficient strength to temporarily  overcome the assumed longer‐term carbon dioxide‐forced warming. However, the IPCC has argued that the climate system possesses only limited internal variability, which is why carbon dioxide forcing came to assume special importance in the first place. Therefore even the IPCC's own studies show that there is not a simple relationship between CO2 increase and temperature rise. The IPCC itself admits that temperature can vary due to several factors including natural factors which can overome man-made temperature rises at least for periods of say 10 years. So it is not a clear cut case of > CO2 means > temperature.
  16. Not really Neil. You were the one that quoted the IPCC. I'm pointing out that you’re out of date since you resorted to a quote from an old IPCC report. If you wish to use an isolated IPCC statement to attempt to make a point, you can hardly complain if I use a more scientifically accurate IPCC presentation to address the same point! If you don't consider that the IPCC reports have merit, why bother to quote from them in the first place? Anyway you seem rather hung up with the IPCC, if I may say so. It's not the IPCC that have shown that it's not possible to reproduce 20th century warming using known natural contributions and their amplitudes, and that this can only be reproduced by incorporating the anthropogenic greenhouse component. That's the work of a large number of scientists published in a significant body of scientific papers. The IPCC merely collate and summarise scientific data and present rather conservative interpretations. The attributions of contributions to 20th century temperature evolution doesn't come from modelling. We know, for example, that solar contributions can have made only minor contributions to 20th century warming since direct empirical analysis of the sun informs us so (e.g. [*]). We know that ocean current changes have made a negligible net contribution to 20th century warming, because empirical and theoretical analysis informs us of that (e.g. [**]). And so on... we can incorporate this empirical and theoretical knowledge into a model. But we don't need modelling of the sort you’re talking about to know that known natural contributions can't have made much of a contribution to the warming of the last 100 years. It is a pretty clear cut case that >CO2 means >temperature. There's lots of empirical data that indicates that the earth tends towards a new equilibrium temperature that is around 3 oC warmer (2-4.5 oC at 95% confidence) for each doubling of atmospheric CO2 [***]. That's not to say that there is "a simple relationship between CO2 increase and temperature rise." Since the anthropogenic component is mixed in with natural variation, sometimes natural variation temporarily opposes CO2-induce temperature rise and sometimes it temporarily enhances it. So during the last couple of years the position of the sun smack at the bottom of the solar cycle, and La Nina conditions, have temporarily suppressed surface temperature. As the sun “moves” towards the solar cycle maximum during the next 4-5 years its contribution will enhance anthropogenic greenhouse warming. So the IPCC reports (not “studies” since the IPCC don’t do the studies Neil – they collate, summarise and report the science) are obviously quite right in stating that we expect a “noisy” temperature rise in an enhanced anthropogenic greenhouse warming world. [*] Lean JL, Rind DH (2008) How natural and anthropogenic influences alter global and regional surface temperatures: 1889 to 2006 Geophys. Res. Lett. 35 L18701 http://www.agu.org/pubs/crossref/2008/2008GL034864.shtml [**] K. L. Swanson, G. Sugihara, and A. A. Tsonis (2009) Long-term natural variability and 20th century climate change. Proc. Natl. Acad. Sci. USA (in press) http://www.pnas.org/content/early/2009/09/09/0908699106.abstract [***] Knutti R, Hegerl GC The equilibrium sensitivity of the Earth's temperature to radiation changes Nature Geosci. 1, 735-743 http://www.nature.com/ngeo/journal/v1/n11/abs/ngeo337.html
  17. Chris Well thanks at least for confirming some very important points - that there is not a simple relationship between CO2 increase and temperature rise. And that natural forces can affect climate and sometimes, at least, over-ride any perceived temperature increases due to increased CO2. This was one of the areas that I was trying to understand as the IPCC reports and the media frequently talk about recent or possible future catastrophic events such as cyclones which are said to be due to man-made CO2 emissions. So from what you are saying,variations in those natural factors which affect temperature ( sun, El Nino etc )are as likely to affect cyclones, sea-level changes, polar ice-melting etc as man-made CO2 emissions? I can see you are knowledgeable on the subject of global warming. For the record, I do believe in global warming ( that the temperature is presently rising ), but then again the climate never has been and never will be static.
  18. "So from what you are saying,variations in those natural factors which affect temperature ( sun, El Nino etc )are as likely to affect cyclones, sea-level changes, polar ice-melting etc as man-made CO2 emissions?" That's not really correct. The natural factors generally result in fluctuations around a trend which under normal circumstances is flattish (on the multi-decadal timescale). In a world warming under an enhanced anthropogenic greenhouse forcing, the natural factors result in fluctuations around a rising temperature. It is the rising temperature that causes the sea level rise, ice sheet melting and so on. Of course if an El Nino occurs on a rising temperature trend, this will supplement the warming producing a short pulse of excess heat which temporarily would accelerate warming onsequences like ice sheet melting. A La Nina will provide a slight brake on these warming-induced consequences. However these don't have much long term effect since these are very short lived phenomena. It's really only changes in solar output that potentially have significant long term consequences that could compete with anthropogenic-induced warming, but analysis of long term solar output indicates that solar variations are rather small in their effects on earth surface temperature.
  19. Chris, ...RE your post 157 above, ( the Oerlemans paper ), the abstract you posted did not tell me much. So I did some research on the data and as far as I can see, glaciers have been generally melting and receding since about 1850, which is well before massive amounts of man-made CO2 were pumped into the air. Also, the IPCC models only require CO2 input after say 1970. According to the IPCC graphs, before 1970, natural variations can explain most of the temperature increase. Now since 1970, I agree, that glaciers have been generally receding, although in several areas they have actually been advancing. But the important points to note are that : 1) Glaciers started to recede well before 1970 and so the receding of glaciers after 1970 was to be expected simply based on historical ( natural )trends. 2)There has been little or no incresae in the rate of glacial recession since 1970. Thus there is little evidence here for me to conclude that recent man-made CO2 emissions are responsible for glacial retreat. If we look at one hypothetical glacier, is it not true that if precipitation of snow at the higher, source of the glacier decreases then there will be less weight forcing the glacier down the valley. Thus the rate of advance of the glacier can be affected by other factors besides warming.
  20. neil, you're changing the subject and arguing about something that isn't what my post (#157) was about. I was pointing out that there are quite a few different temperature scales and that these yield a rather consistent interpretation of 20th century warming. No one is arguing that glacier retreat is solely due to enhanced anthropogenic greenhouse forcing. The point is that one can use glacier extent and its temporal variation as a crude "thermometer", and this analysis gives a temporal variation in earth temperature consistent with that determined by analysis of direct measures.. Note that glacier advance due to the so-called Little Ice Age had more or less stopped by around 1800, and the slow retreat from around 1850 most likely already had an anthropogenic component. After all, the preindustrial atmospheric CO2 levels of around 280 ppm, were ncreased through the 19th century to 300 ppm by 1900 and by 320 ppm by 1960. That increase in atmospheric CO2 should give a warming near 0.4 oC within the best estimate of the climate sensitivity (around 3 oC per doubling of atmospheric CO2). And this is consistent with analysis of attributions of 20th century warming. One simply can't reproduce 20th century warming without including this very significant anthropogenic contribution. An example of this attributional analysis can be found elsewhere on John Cooks site: http://www.skepticalscience.com/climate-models.htm
  21. Chris, I am aware that there are many proxies which can be used to give rough estimates of temperature in the past. I agree that the climate has been warming at least since the start of the 20th century. The Earth's climate can warm and cool over time due to natural factors. My quest for the "truth" centres on finding out: 1) How much of the recent warming is due to man-made CO2 emissions. 2)Is warming necessarily a bad thing. 3) If man-made CO2 emissions are a contributing factor, what can be done to lower the emissions in a way that will have a DEMONSTRABLE effect in reducing temperature increases in the future - maybe having more nuclear power stations would be the way to go. aww However, with regard to your claim that temperature increase since 1850 " most likely already had an anthropogenic component", is it not true that the IPCC climate models can replicate temperature trends prior to around 1970 simply using natural forcings. Also, from the graphs I have seen, there has been no general increase in the rate of recession of glaciers since 1970.
  22. Hi John. Great site!! Extremely helpful from both sides I know diddly-squat about the environment, so all I can do is ask questions. Regarding the Doran 2009 study, so extensively quoted above, it is written "The authors surveyed 3146 earth scientists" but when I look at the actual link I find 10257 earth scientists were surveyed, and only 3146 responded. So, really, if you survey 10257 earth scientists and ask them "Do you think human activity is a significant contributing factor in changing mean global temperatures?" you find (10257-3146=) 7111 don't find 2 minutes to answer your survey. If I were an Earth Scientist and I thought global warming was about to destroy the planet, I'd be pretty keen to get the message out. I'd find 2 minutes to answer an "up to 9" question survey to help get the message out. Especially if I thought the survey was going to get as much publicity as this Doran study. Why do you think those 7111 Earth Scientists didn't answer the survey?
  23. Does anyone think the opinions of the 7111 non-responders might be different to the opinions of the responders? I Googled "Non-response bias" (under the Scholar listings) and found oodles of studies on the subject. It seems to be particularly important when the subject matter is controversial. Like climate change. It seems that if a researcher is keen to know what the surveyed group really think, the researcher will do a followup small randomised study from the target group to try to demonstrate no statisticlly significant difference between the thoughts of the survey responders and the non-responders. Can anyone see where Doran did this?
  24. Doran's survey population included "more than 90%" PhDs and 7% Masters degrees in earth sciences. They were asked: "When compared with pre-1800s levels, do you think that mean global temperatures have generally risen,fallen,or remained relatively constant?" 90% said "risen". Everyone here would be pretty sure as to why that answer would have been given. But, as we all know, truth isn't a democracy. so..what about the other 10%? Here are 300+ PhDs and Master's degreed folk who don't even think warming has occurred. Wouldn't it be good to know their reasoning?
  25. In Australia, if a doctor A thinks another doctor B is impaired to the point of being a danger to society, then doctor A must report doctor B to the Medical Board Medical Practice Amendment Act 2008 (NSW) (Section 71A) If 90% of Earth scientists think the world is at threat from climate change, and 10% of their colleagues are going around unable to agree even on warming, shouldn't the 90% move to get the 10% dismissed? Or, isn't it actually quite that "cut and dried", even amongst Earth scientists?

Prev  1  2  3  4  5  6  7  8  9  10  11  12  13  14  15  16  17  18  19  20  Next

Post a Comment

Political, off-topic or ad hominem comments will be deleted. Comments Policy...

You need to be logged in to post a comment. Login via the left margin or if you're new, register here.

Link to this page


The Consensus Project Website

THE ESCALATOR

(free to republish)


© Copyright 2024 John Cook
Home | Translations | About Us | Privacy | Contact Us