


 Arguments


How do we know more CO2 is causing warming?
What the science says...
| Select a level... |
 Basic
Basic
|
 Intermediate
|
 Advanced
| ||||
|
An enhanced greenhouse effect from CO2 has been confirmed by multiple lines of empirical evidence. |
|||||||
Climate Myth...
Increasing CO2 has little to no effect
"While major green house gas H2O substantially warms the Earth, minor green house gases such as CO2 have little effect.... The 6-fold increase in hydrocarbon use since 1940 has had no noticeable effect on atmospheric temperature ... " (Environmental Effects of Increased Atmospheric Carbon Dioxide)
At-a-glance
To make a statement like, "minor greenhouse gases such as CO2 have little effect", is to ignore 160 years of science history. So let's look at who figured out the heat-trapping properties of carbon dioxide and when.
Experiments involving various gas mixtures had demonstrated the heat-trapping properties of water vapour, CO2 and methane in the 1850s. But those effects were yet to be quantified - there were no meaningful numbers. It was to be another 40 years before that happened.
Swedish scientist Svante Arrhenius (1859-1927) was the person who crunched the numbers. The results were presented in a remarkable paper, "On the Influence of Carbonic Acid in the Air upon the Temperature of the Ground", in 1896.
The many calculations in the 1896 paper include estimates of the amounts of CO2 increase or decrease required to drive the climate into a different state. One example used was the Hothouse climate of the Cenozoic, around 50 million years ago. Another was the glaciations of the last few hundred millennia.
To get a temperature rise of 8-9°C in the Arctic, Arrhenius calculated that CO2 levels would have to increase by 2.5 to 3 times 1890s levels. To lower the temperature 4–5°C to return to glacial conditions, he calculated a drop in CO2 was needed of 0.62-0.55 times 1890s levels.
We know CO2 levels in the 1890s from ice-core data. They were around 295 ppm. Let's do the sums. A reduction factor of 0.55 to 0.62 on 295 ppm gives 162.2-183.9 ppm. Modern ice-core measurements representing the past 800,000 years show that in glacial periods, CO2 levels fell to 170-180 ppm.
What we now know due to additional research since 1896 when Arrhenius worked on this, is that CO2 was an essential 'amplifying feedback'. That means changes triggered by long term, cyclic variations in Earth's orbit cause warming or cooling and CO2 release or entrapment in turn. Those changes in CO2 levels affected the strength of Earth's greenhouse effect. Changes in the strength of the greenhouse effect then completed the job of pushing conditions from interglacial to glacial - or vice-versa.
Arrhenius also made an important point regarding water vapour: "From observations made during balloon voyages, we know also that the distribution of the aqueous vapour may be very irregular, and different from the ideal mean distribution." This statement holds true today: water vapour is a greenhouse gas but because water exists in gas, liquid and solid forms in the atmosphere, it is continually cycling in and out of the air. It is distributed in a highly uneven fashion and is uncommon in the upper atmosphere. That's where it differs from CO2.
Once CO2 is up there, it's up there for a long time. As a consequence it has a pretty even distribution: 'well-mixed' is the term. As Arrhenius quantified all that time ago, once it's up there it constantly absorbs and re-radiates heat in all directions. That's why dumping 44 billion tons of it into our atmosphere in just one year (2019 - IPCC Sixth Assessment Report 2022) is a really bad idea.
Please use this form to provide feedback about this new "At a glance" section. Read a more technical version below or dig deeper via the tabs above!
Further details
Good scientific theories are said to have ‘predictive power’. In other words, armed only with a theory, we should be able to make predictions about a subject. If the theory’s any good, the predictions will come true.
Here’s an example: when the Periodic Table of the chemical elements was proposed in 1869, many elements were yet to be discovered. Using the theory behind the Periodic Table, the Russian chemist Dmitri Mendeleev was able to predict the properties of germanium, gallium and scandium prior to their discovery in 1886, 1875 and 1879 respectively. His predictions were found to be correct.
The effect on Earth's greenhouse effect of adding man-made CO2 is predicted in the theory of greenhouse gases. This theory was first proposed by Swedish scientist Svante Arrhenius in 1896, based on earlier work by Fourier, Foote and Tyndall. Many scientists have refined the theory since Arrhenius published his work in 1896. Nearly all have reached the same conclusion: if we increase the amount of greenhouse gases in the atmosphere, the Earth will warm up.
Where there is less agreement is with respect to the exact amount of warming. This issue is called 'climate sensitivity', the amount the temperatures will increase if CO2 is doubled from pre-industrial levels. Climate models have predicted the least temperature rise would be on average 1.65°C (2.97°F) , but upper estimates vary a lot, averaging 5.2°C (9.36°F). Current best estimates are for a rise of around 3°C (5.4°F), with a likely maximum of 4.5°C (8.1°F). A key reason for this range of outcomes is because of the large number of potential climate feedbacks and their variable interactions with one another. Put simply, some are much better understood than others.
What Goes Down…
The greenhouse effect works like this: Energy arrives from the sun in the form of visible light and ultraviolet radiation. The Earth then emits some of this energy as infrared radiation. Greenhouse gases in the atmosphere 'capture' some of this heat, then re-emit it in all directions - including back to the Earth's surface.
Through this process, CO2 and other greenhouse gases keep the Earth’s surface 33°Celsius (59.4°F) warmer than it would be without them. We have added 42% more CO2, and temperatures have gone up. There should be some evidence that links CO2 to the temperature rise.
So far, the average global temperature has gone up by more than 1 degrees C (1.9°F):
"According to an ongoing temperature analysis led by scientists at NASA’s Goddard Institute for Space Studies (GISS), the average global temperature on Earth has increased by at least 1.1° Celsius (1.9° Fahrenheit) since 1880. The majority of the warming has occurred since 1975, at a rate of roughly 0.15 to 0.20°C per decade."
The temperatures are going up, just like the theory predicted. But where’s the connection with CO2, or other greenhouse gases like methane, ozone or nitrous oxide?
The connection can be found in the spectrum of greenhouse radiation. Using high-resolution FTIR spectroscopy, we can measure the exact wavelengths of long-wave (infrared) radiation reaching the ground.
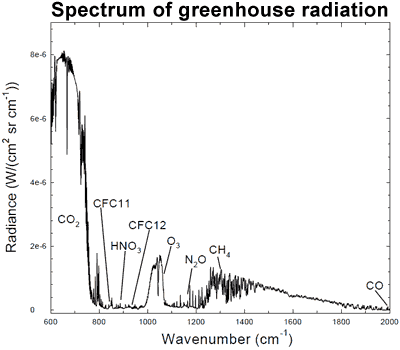
Figure 1: Spectrum of the greenhouse radiation measured at the surface. Greenhouse effect from water vapour is filtered out, showing the contributions of other greenhouse gases (Evans 2006).
Sure enough, we can see that CO2 is adding considerable warming, along with ozone (O3) and methane (CH4). This is called surface radiative forcing, and the measurements are part of the empirical evidence that CO2 is causing the warming.
...Must Go Up
How long has CO2 been contributing to increased warming? According to NASA, “Two-thirds of the warming has occurred since 1975”. Is there a reliable way to identify CO2’s influence on temperatures over that period?
There is: we can measure the wavelengths of long-wave radiation leaving the Earth (upward radiation). Satellites have recorded the Earth's outgoing radiation. We can examine the spectrum of upward long-wave radiation in 1970 and 1997 to see if there are changes.
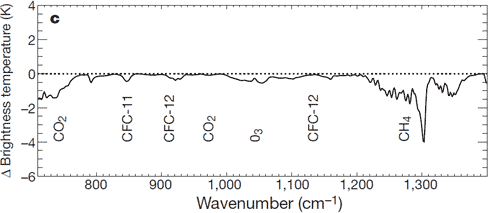
Figure 2: Change in spectrum from 1970 to 1996 due to trace gases. 'Brightness temperature' indicates equivalent blackbody temperature (Harries et al. 2001).
This time, we see that during the period when temperatures increased the most, emissions of upward radiation have decreased through radiative trapping at exactly the same wavenumbers as they increased for downward radiation. The same greenhouse gases are identified: CO2, methane, ozone and so on.
The Empirical Evidence
As temperatures started to rise, scientists became more and more interested in the cause. Many theories were proposed. All save one have fallen by the wayside, discarded for lack of evidence. One theory alone has stood the test of time, strengthened by experiments.
We have known CO2 absorbs and re-emits longwave radiation, since the days of Foote, Tyndall and Arrhenius in the 19th Century. The theory of greenhouse gases predicts that if we increase the proportion of greenhouse gases, more warming will occur.
Scientists have measured the influence of CO2 on both incoming solar energy and outgoing long-wave radiation. Less longwave radiation is escaping to space at the specific wavelengths of greenhouse gases. Increased longwave radiation is measured at the surface of the Earth at the same wavelengths.
Last updated on 16 July 2023 by John Mason. View Archives


I read an article on another site that eludes that OLWIR should be decreasing over the last few years as co2 has risen. ... but instead had increased. I am trying to understand this relationship. It seems like if the LWIR was decreasing because more co2 was trapping it.... it would result in warming. Is that correct?
Donny @176, it is a bit hard to rebut "another article" when you provide no link so that I can read it myself. Nevertheless, the article probably refered to this graph from Harries et al 2001:
The graph shows the difference in OLR between April-June, 1970 and April-June 1997 over the eastern central tropical pacific (10 S to 10 N; 130-180 W). It shows that the OLR has increased slightly (top), but that the observed increase was matched by an predicted increase in the models (middle). The graphs are offset to allow easy comparison.
The question you should ask is why did the models predict an increased OLR even though the CO2 level had risen. The answer is that the region observed is right in the center of the ENSO pattern of variation. If you look at the pattern of ENSO variation, you will see that while there were slightly cool ENSO conditions in that zone in 1997, they were very much cooler in 1970:
Remember, warmer temperatures increase OLR, and the 1997 temperatures were distinctly warmer, and warmer beyond the mere expectation from global warming due to the ENSO pattern. That additional warmth above the AGW trend increased OLR beyond the additional reduction due to the slight increase in CO2 over that period. Indeed, it was only because of the additional warmth due to ENSO that the OLR increased. Had the increase in warmth been only that of the trend, the net OLR would have declined slightly.
Harries et al did not leave it there. They used a model to correct for the temperature difference, thereby showing the impact of greenhouse gases apart from the changes in temperature:
As expected, the change in GHG concentration reduces OLR.
I know that pseudoskeptics attempt to dismiss this data because a model was used to generate it. It was not, however, climate model. It was a radiation model (specifically Modtran3). This is the sort of accuracy you can get with radiation models:
Because the adjustment was done with radiation code, denying the validity of the adjustment is tantamount to denying radiative physics altogether. It puts those who do it into flat earth society territory as regards to the level of their pseudo-science.
[PS] Isaac Held has also blogged on this.
I'm curious about something, and I'm not sure if this is the right page to ask about it, but here goes anyway. I understand that plants might not necessarily migrate north as temperatures increase and as their climatic boundaries change, but why is that the case? If you could point me towards a page or two that explains it, it would be appreciated.
tkman0 - I have responded in a more appropriate place.
tkman0 @178, I have responded here.
Replying to comment from here.
The very basics of science is comparing what your hypothesis predicts to observation.
"What they say" - is the calculated spectrum of IR with increased CO2.
The observation is what is actually measured of the CO2. See article above and graphs in comments for these comparison. I think it is simply that you person misunderstands the physics. See also "The CO2 effect is saturated" which might illuminate the basis of misunderstanding.
But in short, the observations of IR spectra, whether DLR observed at the surface or OLR observed from space, fit what is expected from theory for increased CO2.
Quick, following on from the previous thread
Your commenter is full of it. It is not Raman Scattering. It is molecular absorption spectroscopy. And CO2 absorbs over an absorption range not just a single frequency. Across that range there are 10's of thousands of individual absorption lines.
Point your 'expert' here http://www.spectralcalc.com/spectral_browser/db_intensity.php
SpectralCalc plots line strength data for any of the gases in the HiTran spectroscopic database. Have him select CO2, Microns rather than wavenumber and a range from say 5 to 20 microns then plot.
He can then look at the detailed tabulated data for the plot extracted from HiTran at this link: http://www.spectralcalc.com/spectral_browser/db_data.php
If he still has an issue then he needs to take it up with the Cambridge Research Laboratory at Harvard and the US Defense Dept who have been behind the acumlation of data in Hitran for many years - currently data on 43 different gases, 120 isotopologues and over 7 million individual absorption lines
And if he does question the lab they will politely hand him his ignorant head on a platter!
Next his reference to Wien's Displacement Law???
Wiens Law is used to calculate the location of the peak of a Planck curve. But CO2 (and any other gh gas) doesn't necessarily absorb at the peak. The each absorb at different parts of the Planck curve, and perhaps not at the peak. This just pseudo-scientific waffle to try and sound smart.
Thanks Glenn and scaddenp! It would've taken me quite awhile to dig this up on my own. I called him out on it being pseudoscience and asked for references...to no avail....shockng as that may be.
Glenn, I posted #182 and 183 almost verbatim. Here was his response:
When viewed under high resolution, EVERY gas has numerous small transitions along the entire EM spectrum. That has never been under dispute. I guess you can't distinguish between that and an absorption peak. And by the way, that also shows that EVERY gas is a "greenhouse gas."
Additionally, I'm well aware of the various factors that will influence absorption. Factors such as natural, temperature (also called Doppler) and pressure broadening. These same factors will also affect emissions to varying degrees.
But now you've shifted gears and are talking about ABSORPTION. As I recall, your beloved Greenhouse Gas Theory claims that CO2 absorbs and then "re-emits" a photon of IR. But that's not absorption since absorbed energy isn't re-emitted...at least below 85km in altitude. Below that altitude, absorbed energy is passed on to other molecules as KE during a collision. So I guess it looks like you've disproven your own beloved theory. Nice going.
As for my reference to Wien's displacement law, you have things backwards...which is normal for an AGW cultist. I reference it to show surface temperatures that will produce specific [peak] wavelengths that are emitted by a surface at that specific temperature, NOT to show what is being absorbed. Were you a breech baby as well?
But since you've deflected to absorption instead of scattering, I notice you left out the absorption coefficients of the TWO and ONLY two absorption peaks that are within the atmospheric window. Just so you don't have to waste time scrambling to try and find out what they are, they're 9.4 microns and 10.4 microns. Maybe you should post the absorption coefficients for all to see. You think?
Oh, and I have asked repeatedly for ANY any reference, but he deflects. My BS meter redlined when I first saw his original post, but I lack the bandwidth and advanced acumen to effectively debunk this. I also laid down the gauntlet for him to join here and engage. So far it's been met with more deflection.
[JH] The use of "all caps" is akin to shouting and is prohibited by the SkS Comments Policy.
Then same guy, (Jim in CA) added this:
"And yes, GHG theory is wrong. Here's an equation that shows the temperature increase moving from 280ppm to 560ppm:
ΔT = (0.443 W/m^2) ln[(560 ppmv/280 ppmv)] / 4 (5.6697x 10^-8 W/m^2*K^4) (300.15 K)^3 = 0.307 W/m^2 / 6.13 W/m^2*K = 0.05 K = 0.05 C = 0.09 F
That's it, just 0.09 F. Wow and double wow!! We're all going to die from heat exposure. LMAO Additionally, that value is most likely high as it's based merely on atmospheric partial pressure of CO2 and emissivity. It isn't taking into account the likelihood of energy transfer to other molecules with higher specific heats that can absorb the energy without changing temperature....molecules like water vapor.
And that brings me to another point. You morons are constantly saying that CO2 "traps" heat. Don't know about you, but to me if something is "trapped", then it's removed from the environment. "Trapping" heat would COOL things down, not warm them up. Additionally, the CO2 molecule at our atmospheric pressures and temps simply has TOO low of a specific heat to carry much thermal energy anyway. It doesn't have the thermal headroom. Sorry about your bad luck on that one.
CO2 is quite simply an energy conduit. Nothing more. It quickly transfers energy from one source to another without storing it."
Where is this conversation going on, Quick?
Ah! Just figured out where "Jim in CA" is getting his information.
Nasif Nahle Sabag.
The equation is a direct cut and paste.
Rob, conversation is here.
Quick. He has the equation wrong (note not explaining it). The correct answer is around 1.1C. However this is temp change from radiative forcing alone. Feedbacks (water vapour, albedo primarily) lift this higher to something in range 2-4.5C.
Jim needs to realise that just because he doesnt understand something doesnt make it wrong, especially on basis of a cock-eyed semantic argument. Secondly, if your understanding of something doesnt agree with actual measurements (eg the increase in DLR) and textbook calculations do, then guess who is wrong.
Quick, for starters his fixation on 9.4 and 10.4 is way off. there are two minor peaks there but the main one is closer to 15 micron. He wants a graph, show him this:
you can get a copy here: http://www.skepticalscience.com//pics/CO2IntensityWavelength.png. Notice that the vertical scale is logarithmic. So the peak at around 15 micron is nearly 10,000 times stronger than those peaks he is referring to. And this is the actual measured spectral intensity for CO2, from HiTran. Spectral Intensities 1000,s of times higher than his numbers means that is distance of kilometers becomes meters.
Next he clearly doesn't get that absorption and emission are mirror image processes. Gases that absorb at certain wavelengths also emit at those wavelengths.
He is right that when a single CO2 molecule absorbs a photon then virtually all the time this extra energy is passed off to other molecules in the air, typically within less than a microsecond of the absorption. But he is missing the fact that collision between molecules are continually raising molecules to higher energy states and dropping them back down again.
At any instant half of all the molecules in the air will be in an energy state higher than the average. And a proportion of those will be CO2 molecules. So a small proportion of those CO2 molecules will be able to spontaneously emit, de-energising by emission rather than by collision. And since there are millions of CO2 molecules in just the first meter of travel for each photon, even a small number of spontaneous emissions is enough to emit as much as is absorbed.
And most of the emitted photons are in turn absorbed by another greenhouse molecule and the energy redistributed via collisions, then another emission by another molecule ... and so on. When a gaseous medium is 'optically thick' - meaning most EM radiation passing through it is absorbed, then energy transport via radiation through the medium is extremely slow. This process is called Radiative Diffusion.
A similar process occurs inside the Sun. In the inner part of the Sun there is no convection, so all energy flow is via radiation so it is extremely slow at transferring generated heat from the core outwards. It is only when one reaches the outer layers of the Sun and convection starts occurring that the rate of heat transport increases dramatically. The estimates are that it takes over 100,000 years for energy generated in the core to reach the surface and escape to space.
And it is similar here on earth except that convection is able to transport heat upwards right from the surface. It is only when the air is thin enough that some of the emtted radiation is able to escape to space. For the very peak of the CO2 absorption band this is up at 30-40 km up. However for much of the wavelengths around that between roughly 13-17 microns, the altitude is much lower, even down to around 2-3000 meters. There is a smilar behaviour for the other GH gases, depending on the profile of their spectral intensity.
Thus, athough the altitude at which the atmosphere becomes 'optically thin' varies significantly from wavelength to wave length, the average altitude at which it becomes optically thin, averaged for all GH gases, is around 5 km.
Hope this helps, and is clear.
scaddenp@190, Thanks again for the input, but my last physics class was early 80s, so bear with me please. What equations yield the 1.1C and 2.0-4.5C?
Glenn, this is helpful. However, here is how he explained absorption and emission: "Speaking of science, did you people know that the AGW cult claims that when a molecule of carbon dioxide "absorbs" and "re-emits" a photon of IR (actually Stokes-Raman scattering) that it re-emits a photon of the "exact" same wavelength as the one "absorbed"?
This is the claim to got me interested in researching their pseudo-science. Reason being, I already knew this was impossible. There is only one process that can absorb and re-emit a photon of the exact same wavelength and that process is called resonance fluorescence and it involves an electronic transition (electron jump). It's IMPOSSIBLE with a vibrational transition."
Can you please clarify the last sentence here?
[JH] For future reference, it would be extremely helpful to everyone if you were to put all quotes from you blogging adversary(ies) in italics. Thank you.
"[Impossible] with vibrational transition"? I think not:
Quick - The 1.1C from direct forcing from doubling CO2 comes most directly from Myhre et al 1998, computed using the HITRAN spectral database and numeric radiative codes to estimate reduction of IR to space with increasing CO2, not to mention other GHGs. This spectral change has been experimentally verified with satellite readings at GHG frequencies (Harries et al 2001 and later papers).
The 2.0-4.5C warming from a doubling of CO2, with a mode of ~3.0C (including feedbacks) comes from a broad range of studies (discussion here), including paleoclimate, GCMs, recent observations, etc. While uncertainties are present, the changes of warming outside that range are very low, apply to both the high as well as low extrema, and even 2.0C warming per doubling is likely to give us significant impacts based on our current economic path.
To expand slightly on my previous comment:
The forcing change from doubling CO2 is on the order of 3.7W/m2. To calculate how the the climate must warm in response, consider the effective emissivity of the Earth to space, and the Stephan-Boltzmann law.
Power = Area * emissivity * SB constant * TK4
The Earths surface receives an average of 240 W/m2 of energy from the sun, and with a surface temperature averaging 15C emits 240 W/m2 back in balance (solve for original emissivity). If that drops by 3.7 W/m2, reducing effective IR to space (solve for changed emissivity), the surface of the Earth has to warm by 1.1C to come back into balance and again emit 240 W/m2 (use new emissivity and solve for temperature).
Quick
"did you people know that the AGW cult claims that when a molecule of carbon dioxide "absorbs" and "re-emits" a photon of IR (actually Stokes-Raman scattering) that it re-emits a photon of the "exact" same wavelengthas the one "absorbed"
Simple answer. No 'it' doesn't. No scientist knowledgeable about the processes involved in the GH efect says that. It is along the lines I described previously.
Absorption of a photon by a CO2 molecule is decoupled from emission of photons by other CO2 molecules. They absorb across a wavelength ban and equally they emit across that band, with differing probabilities of occurring at each wavelength.
Maybe your interlocutor read commentary on blogs from laymen that said this, but an Atmospheric Physicist for example wouldn't. He seems to be an example of someone who thinks that commentary in the media and public forums constitutes an accurate description of the science. It isn't, it's just commentary.
And all the science behind AGW is based on accurate spectroscopy as for example the HiTran database.
As for his last sentence, there are several ways in which atoms and molecules can absorb/emit photons. The two that matter here are:
@Rob Honeycutt
I know I'm 5 months after the fact, but Jim (in CA) commonly posts to climate stories in the Yahoo! News blogs. He and another character who goes by JDAM, love to quote all sorts of Boltzman calculations as "proving" that CO2 can't possibly be a GH gas. Problem is they would never be convinced that their black box calculation of 1°C per double CO2 misses about half the reality, feedbacks, associated with increasing GHG concentrations as some other later folk pointed out.
Hi... This is my understanding of how CO2 in our atmosphere works. Was hoping y'all could tell me where I'm off.
CO2 makes up about 0.04% of our atmosphere. It absorbs infrared in the 3, 4 and 15 micron ranges. 3 and 4 micron are centered around 451c and 693c respectively and the earth's black body curve doesn't hit that much. The 15 micron blackbody curve centers around -79c (from what I understand).
Earth's blackbody curve is around 10 microns (http://drtimball.com/2011/the-greenhouse-effect-everybody-talks-about-it-but-few-know-what-it-is/). Toward the tail is where CO2's absorption kicks in, overlapped by water vapor.
So, there's some absorption by CO2 for the amount of blackbody radiation molecules give off in that range (since bbr is a curve).
But once a CO2 molecule absorbs a 15 micron photon, wouldn't it either re-emit at the bbr curve of it's temperature, far more likely to be centered around 10 micron, or shed the extra energy as heat transfered to another molecule? Eventually heat is emitted as radiation, but wouldnt' the odds be against that energy being re-emitted at 15 microns?
Also, wouldn't each molecule (at 0.04%) essentially have to absorb 2,500c of energy and transmit that heat to other molecules in the atmosphere to increase the atmosphere's temperature 1c?
Also, considering water vapor overlap, even at 10% humidity at 70f, there's a lot more water vapor than CO2 in the atmosphere. Wouldn't that skew the numbers for the 15 micron range?
I don't have the math background to calculate this stuff, I'm really a noob, but I just don't understand how CO2 can contribute that much.
@Tom Curtis
Very cool video... However, since CO2 absorption happens at 3, 4 and 15 microns (3 and 4 being centered around 451 and 693) doesn't it make sense that a very hot flame giving off heat around there would disappear in IR when CO2 is pumped in? Simply because it absorbs at temperatures much higher than our atmosphere normally is?
If they did that experiment in a freezer, and held up a human hand, would we see the same thing?