


 Arguments


Recent Comments
Prev 97 98 99 100 101 102 103 104 105 106 107 108 109 110 111 112 Next
Comments 5201 to 5250:
-
scaddenp at 07:32 AM on 13 August 2021Volcanoes emit more CO2 than humans
jon_zz09 - the killer for that argument is the volcanic CO2 has very different C isotopic signature to that fossil fuels. The changes in atmospheric C isotopic composition are consistant with FF source. Furthermore, the studies referenced in this article (and see more here) account for submarine volcanoes. While estimation is difficult even the high end of the estimates is small compared to FF emissions. Finally, there is no evidence of an increase in volcanism as Rob says ( see here from Global Volcanism Program).
-
ilfark2 at 07:21 AM on 13 August 2021Key takeaways from the new IPCC report
So we would expect to see something like a 3 ppm decrease per year to start and dimish over time upon 0 emissions. So if we wanted to get back to 300 ppm, it would take about 40 years at 0 emissions. So that would be another 40 years over the pre-Human climate equilibrium... though Archer et. al.'s models show we wouldn't get back down to 300 anyway.
This is assuming the Earth sinks continue to behave the way they have.
Is that what they are saying?
Thanks.
-
Rob Honeycutt at 05:43 AM on 13 August 2021Volcanoes emit more CO2 than humans
jon_zz09... My understanding is that, any CO2 emitted from underwater volcanoes would be dissolved before reaching the surface. That could be a complicating factor for ocean acidification, but it does nothing to explain the rapid rise in atmospheric concentrations starting with the industrial revolution.
-
MA Rodger at 05:12 AM on 13 August 2021Key takeaways from the new IPCC report
ilfark2 @8,
The usual work that sets the scene for the fate of our CO2 emissions is that of David Archer (eg Archer et al (2009) 'Atmospheric Lifetime of Fossil Fuel Carbon Dioxide' Fig 1b from the paper is pasted below.) Such work tends to involve the modelling of a big impulse of CO2 rather than the 'slow' release over decades we are managing at the present.
This graphic shows that 30% of a very big release of CO2 is still in the atmosphere millennia after its release. Fig1a (which I can't see on-line to post here) models a 1,000Pg release which is closer to what we humans will likely manage (So far we have managed 700Pg.) and suggests the final CO2 level would consist of 20% our total emissions.

The situation with our present emissions is that annually the rise in CO2 levels equates to about 45% of our annual emissions, this referred to as the Airborne Fraction. Thus annually we are emitting roughly 36Gt(CO2) = 10Gt(C), and seeing an atmospheric increase of some 2.4ppm or [2.4 x 2.13 =] 5.1Gt(C) or [x 3.664 =] 18.7Gt(CO2).
However the 55% that is thus being swepted from the atmosphere into oceans and the biosphere should not be seen as 55% of our annual emissions but as a smaller fraction of the accumulative emissions over past decades.
And because that is 55% of past emissions (which all our emissions will become when we stop emitting), that draw-down will continue although slowly diminishing with time. This reduction in atmospheric CO2 will thus reduce the climate forcing from AGW and counteract the 'in-the-pipeline' warming from the planetary energy imbalance. So warming will quickly stop. I don't think there is much reversal of warming, your "stabilize at a lower temperature."
I am a little surprised to read the comment in recent web articles suggesting this reasonably quick end to warming following a termination of CO2 emissions is somehow new learning. It has been well understood for many years now. What perhaps has prevented the communication of this knowledge is the absence the political will to enact such a cut in emissions. Thus the gradual reduction over several decades was what the science modelled, not a sudden zeroing of our emissions.
-
jon_zz09 at 03:55 AM on 13 August 2021Volcanoes emit more CO2 than humans
Someone I was debating on twitter (I know not a good idea) claims that quote "Out gassing via leakage and fumaroles under the ocean floors and from "quiet" volcanoes and thousands of miles of mid oceanridge" is a significant contribution to CO2 emissions. I'm v.skeptical of this and wondered if anyone else had heard this or had recent estimates for global ocean floor out-gassing from ridges, ocean volcanos and fumaroles. I suspect he is missing geological CO2 sinks
-
ilfark2 at 01:57 AM on 13 August 2021Key takeaways from the new IPCC report
Bob Loblaw
I'm referring to:
https://www.carbonbrief.org/explainer-will-global-warming-stop-as-soon-as-net-zero-emissions-are-reached
which references studies that suggest at zero emissions, CO2 concentrations would fall quite quickly. Michael Mann was on the Sunday shows (in the US) last week mentioning this. IPCC scientists on Democracy Now also referenced this.
In the above linked article, they say about half of human emissions are absorbed by the earth system. Seems if that were the case, CO2 concentration would be going up faster than 2ppm per year (since, my understanding is it takes about 2 gt of CO2 to raise the global concentration by 1 ppm). I.e., the earth must be absorbing significantly more than half.
I'm wondering if I understand the argument.
It seems Mann and others are suggesting the atmosphere and earth (water and land) are out of equilibrium. If we stop (or drastically cut as he suggests) emissions, atmospheric concentration of CO2 will drop quite quickly and we'll stabilize at a lower temperature quite quickly.
Though he points to models, it seems a better proof is that 40 gt of CO2 should raise the global concentration by 20 ppm not 2, so the earth is still absorbing a lot of CO2. Even accounting for mixing time, since we've been doing over 20 gt for years now, one would expect larger gains than 1 to 2 ppm per year.
-
Postkey at 20:19 PM on 12 August 2021Key takeaways from the new IPCC report
'The conventional wisdom among climate scientists has long been that if we stopped all carbon emissions today, the climate would continue to warm for decades or even centuries. . . . “It is our best understanding that, if we bring down CO2 to net zero, the warming will level off. The climate will stabilize within a decade or two,” Rogelj told Berwyn. “There will be very little to no additional warming. Our best estimate is zero.” He adds the notion that decades or even centuries of additional warming are already baked into the system as suggested by previous IPCC reports was based on an “unfortunate misunderstanding of experiments done with climate models that never assumed zero emissions.”
cleantechnica.com/2021/01/04/net-zero-emissions-stabilize-climate-quickly-uk-scientist/Moderator Response:[BL] Despite repeated warnings, you continue to post short quotes of material without discussion of context or applicability.
If you actually have reference to studies that support the position you claim, please post that information, rather than just short quotes from someone that claims such studies exist.
Warning #2
Please note that posting comments here at SkS is a privilege, not a right. This privilege can and will be rescinded if the posting individual continues to treat adherence to the Comments Policy as optional, rather than the mandatory condition of participating in this online forum.
Moderating this site is a tiresome chore, particularly when commentators repeatedly submit offensive or off-topic posts. We really appreciate people's cooperation in abiding by the Comments Policy, which is largely responsible for the quality of this site.
Finally, please understand that moderation policies are not open for discussion. If you find yourself incapable of abiding by these common set of rules that everyone else observes, then a change of venues is in the offing.Please take the time to review the policy and ensure future comments are in full compliance with it. Thanks for your understanding and compliance in this matter.
-
Ed Evans at 19:59 PM on 12 August 2021Net Zero by 2050
I'm 74, married 52 years, and have no children. If I did have children, I would be outraged that we are settling on a 2050 zero-carbon date. We must do better for Greta's generation.
-
Bob Loblaw at 07:04 AM on 12 August 2021Key takeaways from the new IPCC report
ilfark2:
I'm not quite sure what you are asking.
In the graphs above, SSP1-1.9 represents a case where we stop emitting CO2 and get net emissions to zero by 2050. In such a scenario, atmospheric CO2 stops rising - and then over long periods (centuries) will gradually decline. We will still be faced with a world where atmospheric CO2 is above current values.The earth will not quickly absorb the CO2 that is in the atmosphere.
Temperatures will continue to rise for a while, but wll eventually stabilize - at a temperature warmer than today.
There will not be a return to pre-industrial climates (CO2 levels or temperatures) through natural processes at any time in our lifetimes (or for generations to come).
RealClimate has a graph from the SPM, originating from a 2018 IPCC report that shows the temperature ranges expected from scenarios of CO2 levels similar to the graph presented above. It bsaically shows that if we stop adding CO2, we stop warming (with delays), but it's not related to a reduction in atmospheric CO2.

-
wilddouglascounty at 02:26 AM on 12 August 2021Key takeaways from the new IPCC report
Tristan (1.2), I hope you, like me, see the reduction of atmospheric particulates as a net plus due to reductions in health effects, acid rain and other deleterious effects of particulates in general, SO2 in particular. Any net increase in warming from decarbonizing the economy and clearing particulates from the atmosphere can be offset by other measures that do not include injecting particulates back into the air.
-
ilfark2 at 02:23 AM on 12 August 2021Key takeaways from the new IPCC report
It seems the report says that if emissions are cut, temperatures will stabilize in the next 10 or 20 years.
Is this based on the earth absorbing most (currently, roughly 36 of 40 gt?) emissions?
Thanks.
-
Thinking Is Power at 06:07 AM on 11 August 202111 Characteristics of Pseudoscience
Thanks for the comment! I will admit I'm partial to technobabble, simply because it can be rather humorous. But to your point, I've noticed my students easily confuse technobabble with real scientific termonology that they don't understand. By definition technobabble is used to confuse people into thinking it says something profound when it's essentially meaningless. I like your solution, though, as it puts the burden back on the "babbler" to explain what it means.
-
Bob Loblaw at 01:52 AM on 11 August 202111 Characteristics of Pseudoscience
A good list of things to look for.
I note that more than once the phrases "good ideas" and "bad ideas" are compared. Of course, scientists know that this does not mean some sort of moral "good vs. evil" statement.
In science, "good ideas" are ones that allow us to make more accurate predictions of how things behave. "Bad ideas" are ones that fail to provide any improvement in our understanding or ability to anticipate what will happen. That's where testing comes in, and then revising our thinking when observations show that the "idea" wasn't helping.
Occam's razor argues that "entities should not be multiplied beyond necessity". Technobabble falls into the category of using sciency terms "beyond necessity" - making things sound impressive when really the ideas are not.
Is the technobabble designed to baffle you, or provide an accurate description? Properly-used technical terms help a speaker or writer be very specific about what they are saying - as long as the listener or reader knows what the terms mean. As part of a dialog, a speaker should be willing to explain unknown terms if they are speaking scientifically, If they don't - or can't - then it is more likely to be pseudo-science. I can't count the number of times in my life when someone has done the "oh, it's too hard to explain" to cover up the fact that they just don't know.
-
Bob Loblaw at 00:48 AM on 11 August 2021In 1982, Exxon accurately predicted global warming
XKCD has an interesting cartoon on the "what Exxon predicted in 1982" story:

-
MA Rodger at 00:35 AM on 11 August 2021Key takeaways from the new IPCC report
Tristan @1,
Quoting CarbonBrief coverage, "The AR6 report dedicates a whole chapter to “short-lived climate forcers” (SLCFs). These include aerosols – such sulphates, nitrates, dust and sea spray that are also known as “particulate matter” – as well as “chemically reactive gases,” including methane, ozone, nitrogen oxides and carbon monoxide. “In most cases,” they are also air pollutants, according to the report."
The Technical Summary p68 says "The net effect of SLFC and HFC changes in global surface temperature across the SSPs is a likely warming of 0.06°C–0.35°C in 2040 relative to 2019."
I haven't yet attempted to access the full report.
-
Tristan at 00:27 AM on 11 August 2021Key takeaways from the new IPCC report
Found it. Looks like the aggressive emission reductions are expected to include 0.2c of warming by 2050 due to aerosol reduction.
-
Tristan at 00:05 AM on 11 August 2021Key takeaways from the new IPCC report
I'm trying to download the report - does it estimate the amount of warming due to the reduction of SO2 in the atmosphere as a result of decarbonising the economy?
-
michael sweet at 22:26 PM on 10 August 2021Is Nuclear Energy the Answer?
John ONeill:
I do not think that you will convince anyone to support widespread building of nuclear power by arguing about how many people were killed by the accidents at Chernobyl and Fukushima. Everyone knows that if you spread the damage around to enough people it becomes statistically impossible to detect how many people you have killed. That does not mean no-one was killed like James Conca claims. I have provided documention for 27,000 killed at Chernobyl and 1600 at Fukushima.
Abbott 2012 does not mention this issue besides pointing out that with the 15,000 reactors needed to provide All Energy to the world you would expect one major accident every month worldwide. I suggest that you stop wasting our time and move on to another point that Abbott makes that is more important.
Nuclear power is too expensive, enough rare materials (like uranium) do not exist to build out a significant number of nuclear plants and the plants take too long to build to significantly affect the problem before 2050.
-
John ONeill at 17:48 PM on 10 August 2021Is Nuclear Energy the Answer?
I'm still waiting for an emailed copy of the Beyea, Sovacool, von Hippel paper which raises Jacobson et al's 125 deaths ( 15 to 1100) to more likely 1000. Papers from Sweden and Finland did not find a significant effect from Chernobyl-
'Sweden received about 5 % of the total release of 137Cs from the Chernobyl nuclear power plant accident in 1986. The distribution of the fallout mainly affected northern Sweden, where some parts of the population could have received an estimated annual effective dose of 1–2 mSv per year...a possible exposure–response pattern between deposition of 137Cs and cancer incidence after the Chernobyl nuclear power plant accident was investigated in the nine northernmost counties of Sweden (2.2 million inhabitants in 1986)... In conclusion, using both high quality cancer registry data and high resolution exposure maps of 137Cs deposition, it was not possible to distinguish an effect of 137Cs on cancer incidence after the Chernobyl nuclear power plant accident in Sweden.'
'We analyzed the relation of the estimated external radiation exposure from the fallout to cancer incidence in Finland in 1988-2007. The study cohort comprised all ∼ 3.8 million Finns who had lived in the same dwelling for 12 months following the accident (May 1986-April 1987). Radiation exposure was estimated using data from an extensive mobile dose rate survey. Cancer incidence data were obtained for the cohort divided into four exposure categories (the lowest with the first-year committed dose
In any case, even granting 1000 deaths worldwide from Fukushima, that was the only major nuclear accident in thirty years, Increased deaths just in Germany, from coal pollution increases after the closure of nine reactors, has been estimated at 1100 people every year. Figures for Japan, where fifty reactors were shut down, and largely replaced with coal, are probably much higher. That's not even considering climate change deaths.
https://www.ncbi.nlm.nih.gov/pmc/articles/PMC4102770/
https://pubmed.ncbi.nlm.nih.gov/24135935/
https://www.nber.org/system/files/working_papers/w26598/w26598.pdf
Moderator Response:[BL] Badly formatted links fixed and activated. If you want people to follow links, please take the time to insert them correctly.
The web software here does not automatically create links. You can do this when posting a comment by selecting the "insert" tab, selecting the text you want to use for the link, and clicking on the icon that looks like a chain link. Add the URL in the dialog box.
-
michael sweet at 21:32 PM on 9 August 20212021 SkS Weekly Climate Change & Global Warming News Roundup #31
This First Dog on the Moon cartoon would look good on Skeptical Science.
(Sorry, I could not get the cartoon to copy to post it here)
-
michael sweet at 11:19 AM on 9 August 2021What’s the carbon footprint of a wind turbine?
David-Acct:
The problem here is that your question is completely incorrect. When several wind farms in Texas are generating power there are wind forecasts for the future wind and the amount of power that will be generated. These are for a variety of times from 5 minute forcasts to one hour, 6 hours, 24 hours and longer. The power output from the farms is relatively constant over short time periods, say 5 minutes, and slowly changes over longer periods. Thus grid operators do not need to run "constant backup generation to maintain grid stability, even if running at idle." Since they know in advance how much power will be generated by the wind farms, and they have forecasts of electricity usage, they need little extra backup generation.
By contrast, large thermal plants like coal and nuclear plants, often shut down in an instant due to some fault in the plant. Constant backup needs to be run for these plants in case of shut down (nuclear plants have unplanned shut downs about 2 1/2 times per year). For a wind plant they would only lose a singel turbine. In the case of a transmission line failure the back up needed is the same as for thermal plants. Often redundant transmission lines serve to deliver the power with no interruption.
Your question is incorrect. Supporters of fossil fuel have decieved you by feeding you false information. Read about how the Texas grid is currently run and you will see that constant backup generation for all power is not needed. Backup generation for renewable energy is frequently less than that needed for thermal plants.
-
One Planet Only Forever at 08:26 AM on 9 August 2021What’s the carbon footprint of a wind turbine?
David-acct,
The opinion that the comparison being "grams of CO2-eq per kWh" is not a valid and rigorously established value for comparing the alternatives would require the following part of the article to be ignored:
"In fact, this type of analysis constitutes an entire branch of research known as “life cycle assessment,” with its own handbooks, internationally agreed-upon standards, specialized software, and peer-reviewed journals."
Did you read and understand the entire article?
I did. And I would expect that the intermittent production of power would be part of the already developed considerations in the field of life-cycle research. Claiming it is not requires the provision of robust evidence, not the simple statement of an opinion and believing all opinions are equally valid.
I also feel obliged to respond to "As such, there has to be constant backup generation to maintain grid stability, even if running at idle." Power delivery into the grid is constantly "brought on line" and "taken off line" to keep the grid reasonably balanced between demand and supply. And there are grids running entirely without fossil fuels. So the intermittent delivery of some renewable power generation is already able to be managed. Batteries and pumped hydro are just 2 ways to do this that come to mind. A person not being aware of that indicates a person with a large opportunity to learn.
btw, I am just a Canadian trained civil/structural engineer with an MBA. But in Canada all engineers are required to have a basic understanding of all fields of engineering. But I constantly pursued learning more about all the fields and many things outside of engineering and business. Learning about climate science is only a hobby of mine. But I am also concerned technically and economically because the increased uncertainties of future conditions because of rapid climate change challenge civil and structural engineering designs and long-term business decisions.
-
Bob Loblaw at 01:42 AM on 9 August 2021Models are unreliable
To follow-up again on MA Rodger's excellent description, two things to note:
- Satellite data are not a measurement of atmospheric temperature. Satellites measure radiation. To transform the radiation data into an estimate of temperature requires some sort of model. A detailed atmospheric radiation transfer model. To call the results "observations" is playing loose with the term, although it is a common use of the term.
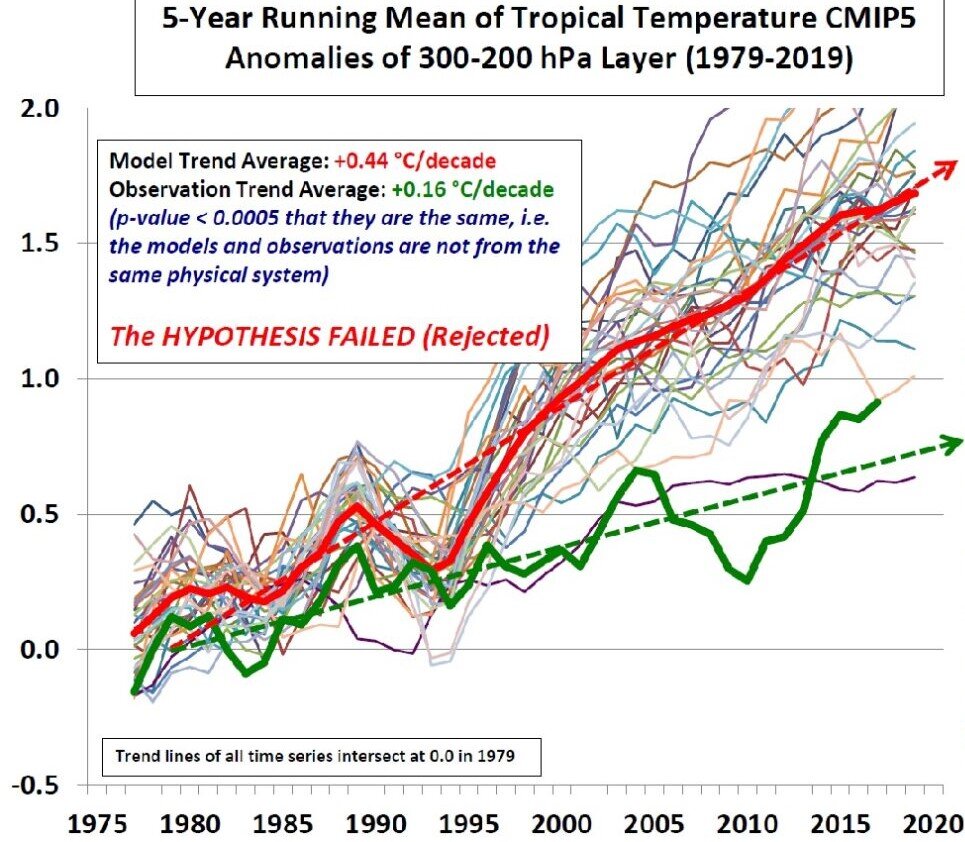
- In the last diagram that MA Rodger provides, note the expression "the models and observations are not from the same physical system". As MAR notes, the results from the climate models are an average of the entire atmosphere from the surface to 70,000 feet (>20km). The "observations" (Christy's model conversion of the satellite data) cover the pressure range from 300 to 200 hPa, which is roughly from 30-40,000 feet (9km to 12 km). That the two are "not from the same physcial system" is known prior to doing any statistical analysis.
Christy's "analysis" takes two things that are known to be different, and tries to make it look like the difference disproves some aspect of climate theory.
-
MA Rodger at 00:25 AM on 9 August 2021Models are unreliable
sailingfree @1294,
You ask "Did Christy use model predictions for the bulk atmosphere?"
He says he does.
It is not easy to be sure what Christy "uses" as he is not a reliable researcher. In specific cases it would/should be possible to see what he says he is "using" and then compare the numbers he "used" with what he says. But this is not always a trivial task and Christy's public statements are not considered of the slightest scientific importance by those best positioned for this task. So they mainly ignore them. But note the issue of modelled tropical tropospheric temperatures (which is real) is being addressed with, for example Vergados et al (2021) or Po-Chedley et al (2021).
You mention @1292 the "102 model runs", so a specific case of data use (although Christy happily reuses his grand finding oblivious to any errors it contains). The prime-time appearance of "102 model runs" was presumably Christy's testimony to the U.S. House Committee on Science, Space & Technology 2 Feb 2016 and in this case Christy's use of data has been questioned more than once but this is technical enough for even climatologists to trip over this task (as the correction within yet another RealClimate posting illustrates). What is perhaps most telling in this situation is the silence of John H Christy who thus acts more like a troll than a proper scientist who would be expected to defend his position by resolving any doubt on the matter.
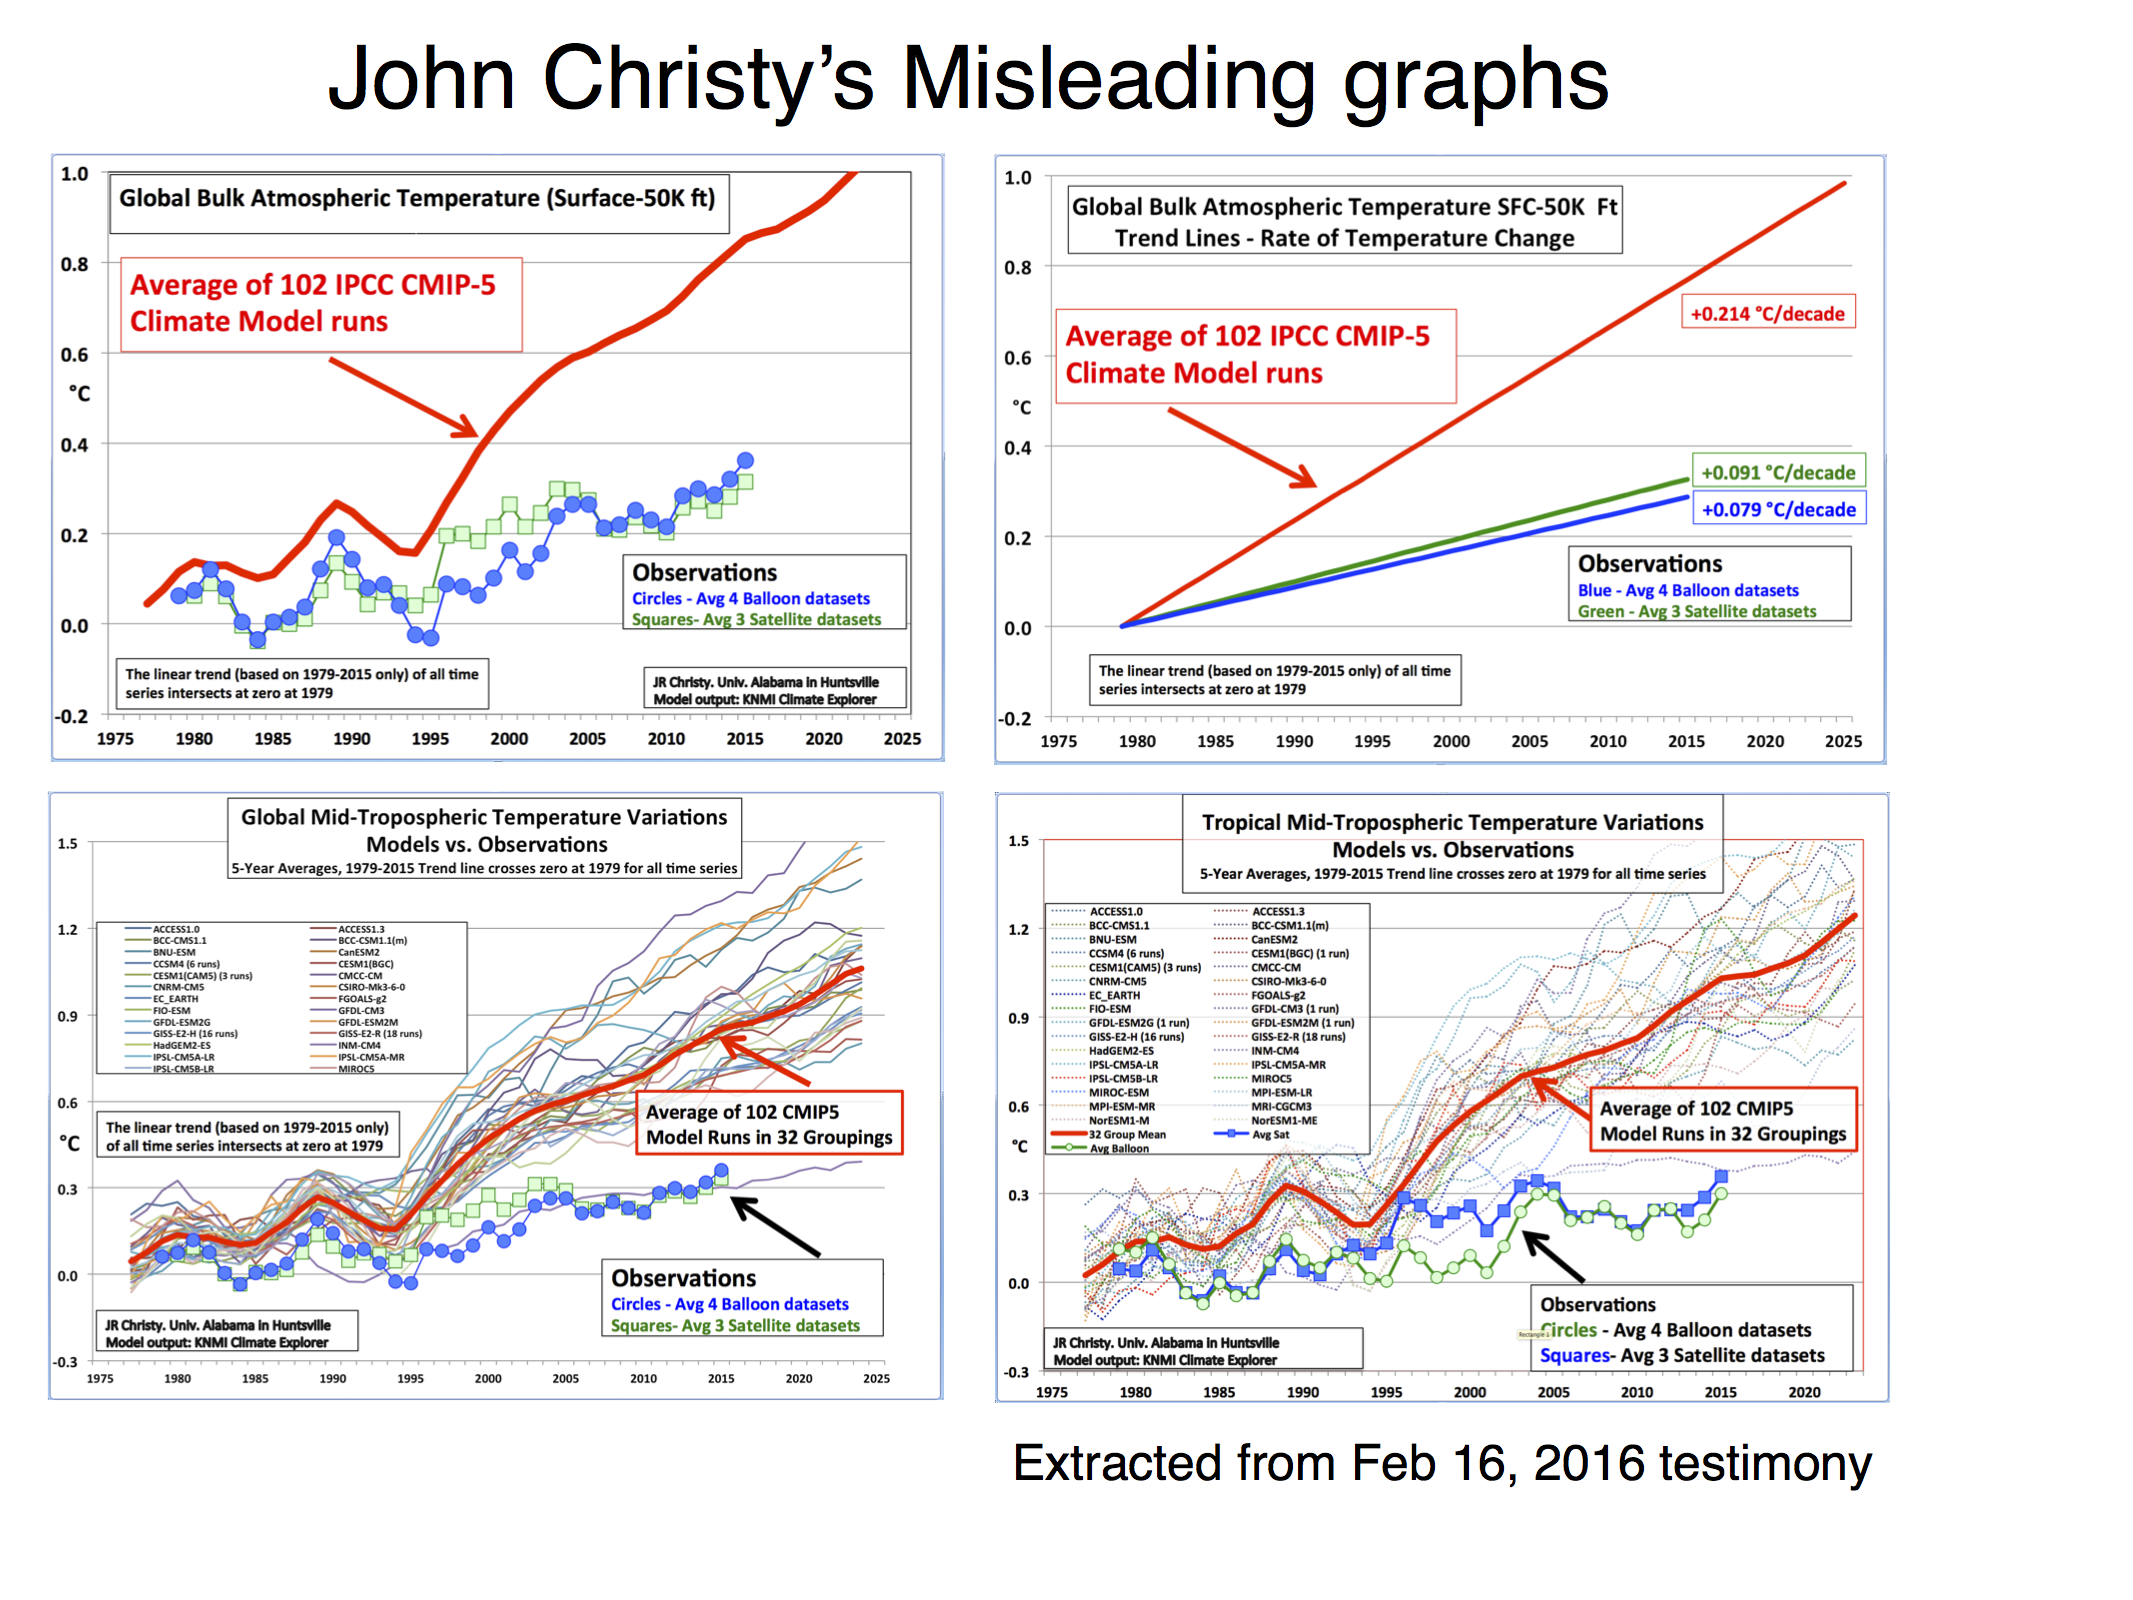
So on these graphics we see John Christy saying he uses "Global Bulk Atmospheric Temperature, Surface to 50,000ft" and also 'Global' and 'Tropical' "TMT Temperature Variations" (which actually go a bit higher than 50,000ft). The TMT satellite data is a statistical sample of emissions from a great swathe of altitudes, even up into the stratosphere where it is cooling due to AGW.
 The RSS browser tool with the correct choice of 'Channel' and 'Region' shows a TMT Tropical trend of +0.145ºC/decade. This compares with the UAH TMT Tropical trend of +0.09ºC/decade. Christy's assessment of model data puts the comparable model trend at +0.214ºC/decade although the model assessment presented by the RealClimate critique linked above gives a model trend of +0.19ºC/decade.
This +0.214ºC/+0.19ºC isn't a massive difference but this and the visual trickery employed by Christy has resulted in a film (actually a 7 minute YouTube video).
Christy latest wheeze is to brandish yet another fun-with-figures graphic (below) which compares TMT data (measured from surface up to 70,000ft with differing strength) with a small layer of the modelled atmosphere (roughly from 30,000ft to 40,000 ft). Presumably this is because the denialists require redder meat with the passing years.
-
David-acct at 00:22 AM on 9 August 2021What’s the carbon footprint of a wind turbine?
The analysis is limited to only incremental grams per mwh from each source. Wol makes a valid point with Kw per hour. As is well known, renewables while the incremental cost of less than fossil fuels, they remain intermittent. As such, there has to be constant backup generation to maintain grid stability, even if running at idle. In order to make a valid comparison, it should include to the back up generation.
-
Bob Loblaw at 23:48 PM on 8 August 2021Models are unreliable
sailingfree:
To add to what MA Rodger said about climate models, analyzing the output from a three-dimensional general circulation model is about as complex as analyzing climate observations - maybe even more so.
Think about the number of locations world-wide where we have measurements of surface temperature, humidity, wind speed, precipitation, radiation, etc. Then add in upper air, oceanic, ground temperature opservations, etc.
Then think about how sparse some of those observations are - how much of the globe is not well-measured.
Then think about things that are not routinely measured - vertical motions, cloud water content, spectral (wavelength-dependent) radiation. The list goes on.
...and then realize that a 3-d climate model is calculating all those things on an ongoing basis (minute by minute, hour by hour), at a 3-d set of points covering the entire globe.
Comparing the model to observations can be done where the two types of data match, and commonly involves some sort of statistical summary (of both the model output and the real-world measurements).
I don't know what Christy means by "bulk atmosphere". My guess would be that he is averaging over the entire vertical profile, but I consider Christy to be such an unrelaible source that I don't want to spend valuable time trying to figure out what he means.
-
sailingfree at 14:16 PM on 8 August 2021Models are unreliable
MA,Thanks.
I'll look at RealClimate. So did Christy use model predictions for the "bulk atmosphere?
-
MA Rodger at 13:03 PM on 8 August 2021Models are unreliable
sailingfree @1292,
The GCM models cover the entire climate system so it is up to the analyst creating a graph what part of the modelled climate system he takes data from for his comparison.
The problem with Christy is that he is rather too enthusiastic about demonstrating his denialism and so makes a very poor job of his comparisons.
RealClimate provide comparisons of model output with temperature data including global & tropical TMT data and have also provided a critique of Christy's efforts.
-
sailingfree at 12:35 PM on 8 August 2021Models are unreliable
Back to basics, concerning Christy's popular graph:
He states that the data is of the bulk atmosphere.
Are 102 model runs also for the bulk atmosphere, or are they for the surface?
-
Why the IPCC climate reports are so important
rkcannon #1
This "big fraud" has obviously been going on at least since 1912!
It's worth noting that the annual CO2 emissions now are ten times higher than in 1912!

-
Philippe Chantreau at 03:50 AM on 8 August 2021Why the IPCC climate reports are so important
About that "blades are not recyclable" bit:
https://news.wsu.edu/2015/08/19/wsu-researchers-find-new-uses-for-old-windmill-blades/
The company's website:
-
Xulonn at 03:00 AM on 8 August 2021Why the IPCC climate reports are so important
Cross-posted from ClimateAdam's YouTube channel:
Unfortunately, the first comment [above]...illustrates the [lack of understanding] and superficiality of many who deny the reality and severity of the AGW/CC (Anthropological Global Warming and associated Climate Change) path that our human civilization is traveling. When a person posts about "extreme predictions" and claims that "It's all a big fraud to get control of energy", I always cringe.
It is important to be aware that many people cannot - or will not attempt to - get past the simple concept of fixed "predictions" and that they do not understand the concept of "probable outcomes based on various CO2 emission scenarios."
The essence of global warming and climate change is simple. The details are not. I am a retired American living in the rainforest mountains of Western Panama, and I actually took an online course in climate science from the University of British Columbia five years ago just to get the basics right.
-
Eclectic at 22:08 PM on 7 August 2021Why the IPCC climate reports are so important
Rkcannon @1 :
You surprise me with your information. Until now I had thought that the Jewish Space Lasers (exposed by US politician Marjorie Taylor Greene in 2021) were part of the secret battle of the Soros-Illuminati group against mankind's older adversaries, the Lizard People.
But I am also puzzled by your information. The Illuminati have been here on Earth for centuries , and the Lizard People for thousands of years (about 6000 years or more precisely from the very Beginning at 4004BC ). So what exactly had these two nefarious groups been doing to achieve or maintain World Domination and Control before they invented the Climate Change scam?
Please enlighten the readers here (if I may use the e-word). Please be cautious and use slightly indirect language, so that the Pegasus* app and The Algorithms* do not detect and censor you (or worse).
-
Evan at 20:24 PM on 7 August 2021Why the IPCC climate reports are so important
rkcannon, the IPCC "bias" is often referred to as scientific consensus, the result of over 160 years of climate science showing conclusively that CO2 is a greenhouse gas.
-
rkcannon at 20:10 PM on 7 August 2021Why the IPCC climate reports are so important
IPCC is clearly biased towards man causing climate change from CO2. They have extreme predictions that are highly unlikely but the media uses that for their scare tactics. Politicians and naieve public believe it. This is why many think there is a climate emergency, which is wrong. It's all a big fraud to get control of energy. Now Biden is mandating electric cars. But these still need power plants. Windmills and solar are barely energy positive and require massive waste dumps when used up. Blades are not recyclable.
Moderator Response:[PS] This is sloganeering. You are telling us what you believe to be true, but you are not offering any evidence to support the numerous assertions in your comment. Your confident statement that: IPCC are biased; that the model result that the IPCC reports on are unlikely; that windmills are solar are barely energy positive; all need to be supported by strong evidence since numerous evidence to the contrary is readily available from reputable sources.
Please note that posting comments here at SkS is a privilege, not a right. This privilege can be rescinded if the posting individual treats adherence to the Comments Policy as optional, rather than the mandatory condition of participating in this online forum.
Please take the time to review the policy and ensure future comments are in full compliance with it. Thanks for your understanding and compliance in this matter.
-
MA Rodger at 18:42 PM on 7 August 2021How Increasing Carbon Dioxide Heats The Ocean
steve37341 @73,
The 20ft difference in sea level suggests you are envisioning the melt-out of Greenland in the 300ppm/27°C scenario but not (or not yet) in the 400ppm/25°C scenario. This has profound implications as the absence of an icy Arctic in the first scenario is a situation requiring millennia for the second scenario to accomplish. Can you confirm this Greenland melt-out is what you intend to confirm with this 20ft SLR?
And can we be clear that the 5,000y "steadily warming" in scenario one has now stopped?
Finally, if the 400ppm CO2 level in scenario two is continuing to increase, the rate of increase is required, as is the history of this increase - when did it begin and from what level?
-
Eclectic at 14:51 PM on 7 August 2021How Increasing Carbon Dioxide Heats The Ocean
Steve @#37 ,
I must beg you for more details & more background to your questions. Are you basing your questions on real-world situations? If so, then the 25C or 27C are global average Surface Air Temperatures which have not been existent during the past 10 million years or so.
If you are talking of recent millennia, then coming from the latest "ice age" glaciation, the global SAT rose by around 5C and stayed at that Maximum (or "Optimum") for about 5000 years. Then during the past 4000 years, the SAT has gradually cooled by about 0.7C . (As you are likely aware, the PAGES12k studies indicate that the current [2020] temperature is nearly 0.5C higher than the Holocene Maximum.) During this time, the atmospheric CO2 level hovered around 280 ppm during the Holocene, and started rising during the past 2 centuries.
So your 300ppm and 400ppm scenarios are quite disconnected from the Earth's surface conditions during the past 10k , 100k , or million years.
Ocean warming is very slow, and it is the oceans which put a brake on SAT rise ~ more so than the other way around. The oceans take in more than 90% of the heat energy gained during total global warming periods, and the air itself represents only a few percentage points of the total. Which makes it difficult to get a good picture of what would happen in the abstract hypothetical situations that you pose.
-
steve37341 at 12:38 PM on 7 August 2021How Increasing Carbon Dioxide Heats The Ocean
Eclectic @70, MA Rodger @71, & Bob Loblaw @72 thanks for each of your replies. I realized that I did not really give enough information about my scenario. The 25°/27° comparison was for atmosphere temperatures. Not average ocean temperatures. The average ocean temperature is the same in each situation. The only difference in the ocean variables is that in the example with the 300ppm CO2 and 27° atmosohere temperature, the sea level is 20 feet higher.
Also, the to get at the suggestion of where each situation is based on it's state, the example with the 300ppm has been steadily warming about 5000 years.
In the example of the 400ppm has been warming for about 8000 years and is still warming and the CO2 levels are continuing to increase, with the upper limit unknown.
I assume that the extra CO2 in the second example would eventually, is it stays higher long enough, would cause greater atmospheric temperatures and greater warming of the oceans. Or is this an incorrect assumption or could other variables come into play to alter that result(s)?
Another question. Assuming the mixing of the ocean waters in deep and shallow areas is relatively the same in each example, which is more important in heating more shallow areas? Higher atmosphere temperature, or higher CO2 level?
-
BaerbelW at 03:17 AM on 7 August 2021Skeptical Science New Research for Week #31, 2021
Hi Dawei! Feedback like this is always welcome and you can provide it via the Google form linked at the bottom of each rebuttal where it says "Argument feedback". If you fill that out we can also follow up via email if need be. Thanks!
-
Dawei at 01:01 AM on 7 August 2021Skeptical Science New Research for Week #31, 2021
On the volunteering task, which I know I missed the deadline for...in addition to cataloging existing references and fixing broken links, any desire to expand upon the citations included within the articles? Some of the articles are quite old and new research has come out that further supports the points.
On human fingerprints chart for example you cite 2 studies to back up the claim of decreasing diurnal temperature range. I have found 25 more studies that also support it.
-
One Planet Only Forever at 13:02 PM on 6 August 2021What’s the carbon footprint of a wind turbine?
Wol,
Wouldn't the "grams of CO2-eq per kWh" lifecycle comparison be the correct comparison?
Note that the comparable values for fossil fuel generating operations are also provided as ranges of "grams of CO2-eq per kWh". And those fossil fuel operation lifecycle ranges would be based on a range of megawatts of rated power and operation locations.
Also note, as the article states, there are internationally developed standards for lifecycle evaluation and comparison.
-
Wol at 09:43 AM on 6 August 2021What’s the carbon footprint of a wind turbine?
I see the examples above have the output as Mw, which is rather gilding the lily. The actual energy - MWh as opposed to the rated power is more indicative of the lifetime efficiency re. CO2 equivalence.
-
Bob Loblaw at 05:31 AM on 6 August 2021How Increasing Carbon Dioxide Heats The Ocean
steve37341 @69,
As others have said, the question is not sufficiently detailed. To add my little bit, I ask "warmed from what state?". Or are you talking about warming from the state you mention, to some other state?
It is possible to image a state where an ocean at 25C is in equilibrium with an atmosphere at 400 ppm CO2, and another state where an ocean at 27C is at equilibrium with an atmosphere at 350 ppm CO2.
Those states could have cooled from some other stable state, due to some change in conditions - or they could have warmed to those states from yet another state. Many factors affect climate (local or global).
Eclectic's suggestion is a good one - explain more of the scenario that you are imagining, to help us understand how you arrived at your question.
-
MA Rodger at 02:47 AM on 6 August 2021How Increasing Carbon Dioxide Heats The Ocean
steve37341 @69,
As Elcectic @70 suggests, the question you pose concerns a complex and dynamic situation.
But if what you ask is reduced to the question of whether a +2°C in global surface temperature is a bigger kick to the climate (and thus the ocean temperature) than a 33% increase in CO2 (from 300ppm to 400ppm), the very basic response would be the +2°C is the strongest. A simple 33% incease in CO2 would result in a forcing of +1.54Wm^-2 which for an Equilibrium Climate Sensitivity of +3.2°C per 3.7Wm^-2 (the central estimate of ECS) would result in a surface warming of +1.33°C.
Adding more realistic assumptions would quickly impact that result. Thus, for instance, one early added consideration is that a surface temperature increase would be greater over land than ocean raising the question of whether your +2°C is a global figure or a surface (atmosphere) increase measured over the ocean.
-
BaerbelW at 02:10 AM on 6 August 2021The Conspiracy Theory Handbook: Downloads and translations
In the meantime, The Conspiracy Theory Handbook has been translated into Czech and Croatian, so we are up to 12 translations (and more are in the works)!
-
citizenschallenge at 23:12 PM on 5 August 2021Thinking is Power: The problem with “doing your own research”
Baerbel, thank you. Yes, that clears it up quite well.
-
BaerbelW at 21:09 PM on 5 August 2021Thinking is Power: The problem with “doing your own research”
CC @10
As far as I know we've always had the ©JC on the homepage. If you however for example go to the graphics resources, you'll see the creative commons license at the bottom of the page which also applies for our rebuttals. For blog posts, the CC-license can however not apply to everything but only for the articles created by our team - i.e. those not showing "guest author" at the top. For any reposts you'd have to enquire with the original author/outlet and then link back to them and not SkS.
Does that help?
-
Eclectic at 14:34 PM on 5 August 2021How Increasing Carbon Dioxide Heats The Ocean
Steve37341 :
Your question re 300ppm/27C versus 400ppm/25C cannot (IMO) have a short answer.
In rough figures : the oceans (which have average depth of 4000m) have a bottom temperature of 4C and a near-surface temperature of 15C. And the 15C is only an average ~ higher in the tropics, lower near the poles. Different temperatures above and below the thermocline. Dozens of years to dozens of centuries, for surface warming/cooling to mix into deeper layers.
So the question becomes modified to: Which parts of the oceans warm up, and by how much, and over what time span? . . . a year, or a thousand years (or inbetween). And do subsequent changes in CO2 solubility cause an alteration of the 300ppm or 400ppm levels . . . or will other climate variables come into play?
300ppm CO2 and 400ppm CO2 are figures which are now entirely in the past ~ and so your question is extremely hypothetical; as are the ocean temperatures you mention.
Perhaps you could express the thoughts and ideas that led you to compose your original question. That may lead to a better way forward in thinking about these sorts of climate aspects.
-
citizenschallenge at 10:06 AM on 5 August 2021Thinking is Power: The problem with “doing your own research”
Dear mods, I recall SkS having a CreativeCommons copyright, but now I noticed a regular ©JC in it's place. What's the policy these days regarding reprinting from your blogposts at my own blog? {With acknowledging original authors, etc.}
Thank you, Cc
-
citizenschallenge at 09:09 AM on 5 August 2021Thinking is Power: The problem with “doing your own research”
There's a good quote in that article,
Even those of us with excellent critical thinking skills and lots of experience trying to dig up the truth behind a variety of claims are lacking one important asset: the scientific expertise necessary to understand any finds or claims in the context of the full state of knowledge of your field.
It’s part of why scientific consensus is so remarkably valuable: it only exists when the overwhelming majority of qualified professionals all hold the same consistent professional opinion. It truly is one of the most important and valuable types of expertise that humanity has ever developed. (Ethan Siegel)
It comes down to motivations and what is one after, learning or winning an argument. Just like the two forms of debate, a scientific debate where learning is the goal, and honesty is a requirement. Compared to the lawyerly political debate where winning is everything and the truth is treated with contempt and derision.
As a lay-person I've come to appreciate that when I do "my own research" I'm actually doing "homework" collecting as much information as I can to understand a topic.
A serious student questions their own assumptions and wants to understand opposing views because only through dissecting and resolving objections can we truly come to understand our own position.
As for expertise - for the constructive layperson, all it takes is reading scientific papers, to get an inclining of the amazing details scientists are familiar with, which I can barely, or not at all, grasp. It's a good humbling experience.
Finally, possessing a healthy dose of self-skepticism is a prerequisite for constructive learning.
Prev 97 98 99 100 101 102 103 104 105 106 107 108 109 110 111 112 Next


