


 Arguments


Recent Comments
Prev 1272 1273 1274 1275 1276 1277 1278 1279 1280 1281 1282 1283 1284 1285 1286 1287 Next
Comments 63951 to 64000:
-
layzej at 03:18 AM on 15 February 2012CO2 is plant food? If only it were so simple
Rob Painting: No need to rely on trust. You can search for yourself, just limit your search from 2010 onwards ... If you can find any paper that observes a net global benefit from increased CO2 I'd be interested. I haven't found one. Limiting the search to 2010 onward reduces the results to about 14,000. Still more than I can possibly review. I took a look at the first few dozen. The literature appears to be as inconclusive as it is encyclopaedic. Most studies conclude that the future is uncertain. One found considerable increase with mechanistic process-based models but reduced habitat suitability from niche-based models. Some found a net gain for certain local environments. Some find a net gain for specific species. One found that approximately 20 percent of sites globally exhibit increasing trends in growth that cannot be attributed to climatic causes, nitrogen deposition, elevation, or latitude, which we attribute to a direct CO2 fertilization effect. This of course does not mean that 80% are stable or declining, just that the growth could not be attributed to CO2. None of the first few dozen were global in scope and were able to conclude that a net global increase or decrease should be expected. One that was interesting to me (because I don't eat tree's but I do drink beer) showed a large increase in wheat yields for a doubling of CO2: http://www.sciencedirect.com/science/article/pii/S0378377409001991 I think I'm going to have to rely on the IPCC to distill this all down. Regarding SkS overstating things - I never implied that they do. I'm just pointing out that a great deal of credibility and trust can be gained by calling out cases where ones own position is being overstated by others. The source is no longer seen as an advocate for his "side" but is seen as an advocate for the truth. -
Tom Curtis at 03:01 AM on 15 February 20122000 Years of Climate Reconstructed from Pollen
Robert Way @19, With regard to tacking on modern temperatures, I do not know which graph you are referring to, nor to which statement you refer. Never-the-less, appending instrumental temperatures to a graph is necessary if you are going to compare paleo-temperature series with modern temperatures as it is impossible to get proxies extending to the current decade, and even then they need to be compared to instrumental temperatures for validation (and hence for which the instrumental temperatures should be shown). The temperature differences reported by Camburn were for 9000 years before present (see 14 above) and hence cannot be contradicted by Kobashi et al. Further, Camburn was suggesting elevated temperatures for "several thousand years", so a decade or two at that level is not particularly relevant. Given the long time scale Camburn had in mind, the centenial average (green line) is the appropriate comparison. As you can see, it only exceeds modern values occasionally, and never by more than 1 degree C. What is more, my comment about 0.5 to 1 degree specifically addressed Camburn's comment, and hence was also about 9000 years BP. Specifically I was pointing out that if you adjusted Camburn's 3 degrees above modern benchmarked on the 1950s to be benchmarked on the 2000s, it becomes 0.5 to 1 degree above modern (based on the Arctic temperature graph). On a side note it is about 1.5 degrees above modern based on Kobashi et al, but Camburn was not discussing Greenland temperatures so that is not particularly relevant. Finally, your report on Kobashi et al's findings is overstated. Kobashi et al do not show temperatures exceeding modern (2001-2010) plus 3 degrees C at any point over the four thousand years, although twice it comes close. Those two decades are the only occasions the uncertainty interval exceeds modern plus 3, although they do not exceed modern plus 4. It only exceeds modern plus 1 in about 10 of the 400 decades shown. While I appreciate your concern about our interests, I am still perplexed as to why you have taken exception to what I said, beyond some clear examples of your having misunderstood what I said. This is particularly the case as I took care to introduce a caveat about Renowdon's method in 18, and to indicate that the 2010 temperature was not properly comparable with what are effectively decadal averages (although still, I believe of interest, as Sphaerica points out).
Given the topic of this thread, Kobashi et al's reconstruction of the last thousand years may be of interest:
While I appreciate your concern about our interests, I am still perplexed as to why you have taken exception to what I said, beyond some clear examples of your having misunderstood what I said. This is particularly the case as I took care to introduce a caveat about Renowdon's method in 18, and to indicate that the 2010 temperature was not properly comparable with what are effectively decadal averages (although still, I believe of interest, as Sphaerica points out).
Given the topic of this thread, Kobashi et al's reconstruction of the last thousand years may be of interest:

-
Esop at 01:37 AM on 15 February 2012Fritz Vahrenholt - Duped on Climate Change
Good to finally see a journalist being truly skeptical about the "skeptic" claims. What a refreshing change from the unquestioned denier drivel that is allowed into the newspapers and magazines every single day. -
DSL at 01:35 AM on 15 February 2012Fritz Vahrenholt - Duped on Climate Change
No, elsa, you were given those links as an experiment (sorry, no IRB approval). The first hypothesis was that you would pick a decadal series that showed as much cooling as possible, ignore the series that showed warming, and then come here and make a big deal out of it. It would then be pointed out to you that ten years of simple temp record tell us very little about the climate--unless of course we take into account the likely sources of short-term noise (see Foster and Rahmstorf (2011)). The second hypothesis was that you would ignore this point and continue to harp about a carefully-selected ten-year period of one of the temp records. These two hypotheses have been established. What has not been established, and what you have been careful not to discuss, is what your carefully-selected decade means re climate. If you do not wish to discuss the implications of that decade, or discuss a reading of that decade within the context of both other temp records and solar forcing, aerosols, etc., then one can only conclude that you are fishing for "SkS admits that globe has cooled!" Since there is no physical evidence for such a claim (even taking ocean heating out of the equation), I doubt if you're going to have much luck. So what's it going to be, elsa? Are you willing to defend what appears to be your implicit theory, that global warming has stopped? -
Bob Lacatena at 01:32 AM on 15 February 20122000 Years of Climate Reconstructed from Pollen
If you go to GISTEMP, you'll see that temperatures in summer, 2011 right at the coast, were about 4˚C greater than the 1950-1981 baseline (roughly the same baseline, but not quite, as the proxy studies graphed on the OP). Temps in winter 2011 were 5.5˚C greater. So you can argue all you want about temps being 3˚C greater 9,000 years ago, because we're blowing past that. And what Camburn and Norman and others always like to distract from is the future. Their line is always "it doesn't look so bad to me right now." We're not talking about global had-been-warming, we're talking about global ongoing-warming. We're not talking about temperatures today... they're already bad enough, but we're saying that we're going to raise temperatures by a factor of 3 beyond where they are today if we hit 450 ppm. The warming we see today in the Arctic is a fraction of the warming that we have already committed to, and we keep piling it on. When you add the warming that is currently being absorbed/masked by the ocean depths and massive ice melt (500 billion tons per year), and then double down on everything due to the additional influence of another 50 years of emissions of CO2, it means you will see 10˚C to 12˚C to 20˚C of warming in the Arctic... depending on when people like Camburn and Norman finally wake up and stop promoting a philosophy of "wait and see." I can't believe Camburn is sitting here bandying about nonsense like the MWP and the Holocene. The Holocene was a light sweater compared to the oven we're creating. -
robert way at 01:10 AM on 15 February 20122000 Years of Climate Reconstructed from Pollen
I think the point of what I said is that Kobashi's data does show times in the last 4000 years where temperatures were about 3 degrees warmer than present. Personally as a glaciologist I find tacking on the present temps in the way done on that graph is misleading and not strong enough evidence to support this statement "Note also that by convention, reports of modern temperatures in paleo studies are based on 1950 temperatures unless otherwise specified, so the 3 degree difference reported by Camburn may in fact be a 0.5 to 1 degree difference from current temperatures in the 2000s." As kobashi et al makes clear there are plenty of times when temperature was 0.5 to 1 above present and some when it is as much as 3 degrees and that is only in the last 4000 years. I'm just trying to protect our interests here. We really ought to be careful here with statements like those and graphs like that... another issue is the graph is not annual air temperature but yet 2010 is included as well as an annual mark. -
CBDunkerson at 01:07 AM on 15 February 2012The Year After McLean - A Review of 2011 Global Temperatures
Ken, Sphaerica's whole point was that these 'deductive analyses' of temperature trends still contain some variability because there are some factors which we don't have nailed down accurately enough to 'subtract out'. He focused on the remaining natural variations while one of those you cite is anthropogenic, but the issue is the same... until we can nail down the influence of these remaining (comparatively minor) factors to a narrow uncertainty range we can't separate them out. BTW, I doubt either Trenberth or Hansen would argue that the factors cited by the other 'do not exist' as you claim... the uncertainty is over how much impact each has. If you believe otherwise you are free to provide the quotation of Trenberth saying that there are no Asian aerosols rather than falsely describing his position. -
muoncounter at 00:52 AM on 15 February 2012Fritz Vahrenholt - Duped on Climate Change
elsa#6: Whether 'the hottest year' was 1934 or 1998 is irrelevant. What is important and you still seem to be missing is the overall positive trend in temperature and in global heat content. That is what the 'escalator' graphic illustrates. -
Ken Lambert at 00:52 AM on 15 February 2012The Year After McLean - A Review of 2011 Global Temperatures
Sphaerica #31 What about taking out Jim Hansen's Asian aerosols, and his 'delayed Pinitubo rebound effect' which are supposed to also be masking the CO2GHG warming effect? Problem is that for other experts such as Dr Trenberth - neither exist! -
Tom Curtis at 23:47 PM on 14 February 2012NASA Mission Takes Stock of Earth's Melting Land Ice
Norman @54: 1) "Groundwater is water located beneath the ground surface in soil pore spaces and in the fractures of rock formations." Because it is located beneath the surface of the Earth, it is not subject to evaporation. The fact that one estimate of total evaporation from "land sources", ie, from lakes and rivers, is similar in magnitude to one estimate of total recharge of groundwater globally is coincidental, and irrelevant. 2) "The water table is the surface where the water pressure head is equal to the atmospheric pressure (where gauge pressure = 0). It may be conveniently visualized as the 'surface' of the subsurface materials that are saturated with groundwater in a given vicinity." Water tables may fall, but they may also rise. (Curiously, that can also be bad for farming. In large sections of Southern Australia, agriculture is threatened by rising water tables carrying salt to the surface.) Clearly concern about the viability of groundwater based irrigation is focused on those areas in which the water table is falling. But falling water tables are not universal, nor even necessarily typical. Indeed, I do not know the proportion of water tables world wide which are rising, or falling. The global balance of ground water is determined by the simple equation : dGW =Rn + Ra - Wn - Wa, where dGW is the change in ground water, Rn is the natural recharge, Ra is the artificial recharge, Wn is the natural withdrawals and Wa is artificial withdrawals. Artificial recharge includes such measures as pumping water into oil wells to sustain well pressure, and the flooding of old mines. Natural withdrawal consists of natural springs and the like. To have a reasonable estimate of global dGW you need a reasonable estimate of all four relevant factors. Instead of providing them, you have consistently proceeded under the assumption that: dGW =~= Wa. Quite frankly, that is like assuming that all you need to know to know if a population is rising or falling is the number of homicides. As it stands I know of at least three areas in the world with rising water tables (Southern Australia, Tasmania and Nigeria), and have no reason to think they are the only ones. I also know that there are rising water tables in Texas, although on average ground water in Texas is decreasing. Given that natural recharge may be up to 20 times greater than artificial withdrawals globally, you are certainly not entitled to assume that areas in which ground water is building up exceeds areas in which ground water is depleting by a sufficient factor that it can be neglected. As it happens I think there is good reason to think global change in ground water is negative. In many aquifers, increased recharge will simply result in increased discharge from water seeps and springs, resulting in little net change. But that is not certain, there is certainly no justification for assuming, as you consistently have, that global change in groundwater is approximately equal to human withdrawals. That much is very clear, and very simple. What is more, consideration of the simple equation above shows very clearly that you have not done "...a fairly decent job of research to show my point in global context." Neglecting three terms of the equation is not fairly decent research, and constitutes ignoring the global context. Turning now to your misrepresentations: 1) Patricia Muir, ie, your source, do not state that "... over 75% of irrigation uses these slowly recharging wells" (your claim). Rather she states that:"About 62 % of water used in agriculture, globally, comes from surface sources (e.g., rivers) while about 38 % comes from ground water (underground aquifers). However more of Earth's freshwater is in aquifers than in surface sources -- in fact, about 99 % of all liquid freshwater is in groundwater. (Issues in Ecol (9) 2001). Much (> 75 %) of this groundwater is "fossil water;" -- water that is not being recharged but is relic from wetter ancient climate conditions and from melting ice after the Pleistocene ice ages. Once we use it, it is "gone" for all practical purposes."
Read it carefully. The claim is that >75% of ground water is fossil water, but she earlier indicates that only 38% of water used in agriculture comes from groundwater directly contradicting your claim. She never mentions what proportion of groundwater extraction comes from fossil water. Indeed, another of your sources (linked in post 43, as it happens) informs that total world water consumption is 3,560 km^3/year (table 7.3; 2,480 km^3/year for agriculture), and that non-renewable water extraction from ground water is 200 km^3/year, yielding only 5.6% of total world consumption coming from non-renewable ground water (or 8% for agriculture assuming all non-renewable ground water extraction is used for agriculture). It should be noted that much of the non-renewable ground water extraction is not from "fossil water", but simply from ground water which is being exploited faster than in can be replenished due to the sheer scale of exploitation, as is occurring in India. As can be seen from the graph below (fig 3 from the previously linked paper), ground water recharge is more than capable of replenishing more than a years withdrawal in a year in northern India, but on average recharge is less than withdrawal so the total groundwater is reduced, in this case by 109 km^3 over the period of study (or 17.7 km^3/year): It follows that the point you were trying to make with your cherry picked example is false.
With brings us back to the cherry pick. So, please, if you learn nothing else, learn this:
1) When presenting data, always present the data which is most representative of the sample from which you drew the data, of the sample which is worst for the point you wish to make (if you do not present all the data);
2) If for some reason you cannot follow rule one, always explain that the data you present is not representative, and is more favourable for your case than the other data, and state very clearly why you never-the-less regard it as important to present that sample rather than some other sample form the data (or all of the data).
If you do not follow rules (1) and (2) you are cherry picking. End of story. There are no subtleties about this.
Applying these rules to what you did, it is clear that your chosen sample was neither representative (it was the most extreme case), nor the worst for your case. It is equally clear that you did not explain that when you presented it. Ergo, you cherry picked.
Sometimes we all cherry pick by accident. I expected you to respond to my challenge by pointing out that you had been lazy, and had just picked the first entry on the table. Had you said that, and apologized for the unintentional deception, that would have been the end of the matter. But you have dug your heals in either because you are so intent on deception you do not recognize how transparent you have been, or because you are so foolish that you genuinely do not know what cherry picking is. In either case it makes no difference for the reader, your word, and your data is not to be trusted because you will not, or are incapable of handling it with integrity.
So learn, apologize and move on. Or dig your heals in further and show you have no place in discussions that value rationality. Your choice!
It follows that the point you were trying to make with your cherry picked example is false.
With brings us back to the cherry pick. So, please, if you learn nothing else, learn this:
1) When presenting data, always present the data which is most representative of the sample from which you drew the data, of the sample which is worst for the point you wish to make (if you do not present all the data);
2) If for some reason you cannot follow rule one, always explain that the data you present is not representative, and is more favourable for your case than the other data, and state very clearly why you never-the-less regard it as important to present that sample rather than some other sample form the data (or all of the data).
If you do not follow rules (1) and (2) you are cherry picking. End of story. There are no subtleties about this.
Applying these rules to what you did, it is clear that your chosen sample was neither representative (it was the most extreme case), nor the worst for your case. It is equally clear that you did not explain that when you presented it. Ergo, you cherry picked.
Sometimes we all cherry pick by accident. I expected you to respond to my challenge by pointing out that you had been lazy, and had just picked the first entry on the table. Had you said that, and apologized for the unintentional deception, that would have been the end of the matter. But you have dug your heals in either because you are so intent on deception you do not recognize how transparent you have been, or because you are so foolish that you genuinely do not know what cherry picking is. In either case it makes no difference for the reader, your word, and your data is not to be trusted because you will not, or are incapable of handling it with integrity.
So learn, apologize and move on. Or dig your heals in further and show you have no place in discussions that value rationality. Your choice!
-
JMurphy at 23:44 PM on 14 February 2012Fritz Vahrenholt - Duped on Climate Change
Actually, 1934 is no longer the hottest year in the US anyway - it has been overtaken by 1998 and 2006. The relevant page on Skeptical Science (here) possibly needs updating, but the information is shown via a comment there from NewYorkJ. -
andylee at 21:52 PM on 14 February 2012Peter Hadfield on Himalayan glacier melt
Doug @ 28 Humanity is doomed. :(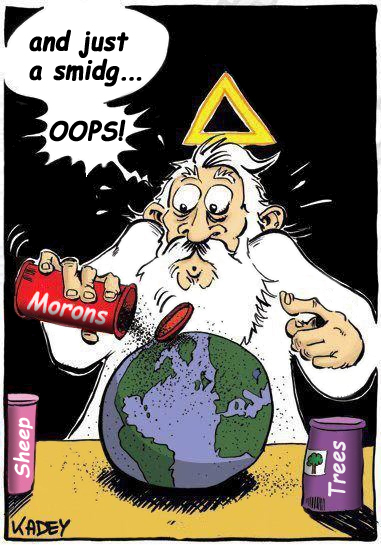 Can we have a new planet with intelligent life on it please?
This one is broken.
Can we have a new planet with intelligent life on it please?
This one is broken.
-
Alexandre at 21:48 PM on 14 February 2012Fritz Vahrenholt - Duped on Climate Change
elsa at 21:15 PM on 14 February, 2012 You have to compare apples to apples. Figure 2 is a graph showing global temps where "statistical methods have been used to 'take out' the effects of volcanic eruptions, Pacific Ocean cycles and the Sun", as the subtitle says. Not a raw global mean temp graph like the escalator. And 1934 was the hottest year on record in the US. The graph in Figure SPM.4 you mention refers to the entire North America. -
Tom Curtis at 21:47 PM on 14 February 20122000 Years of Climate Reconstructed from Pollen
Robert Way @17, as I desire to be accurate, thank you for mentioning Kobashi et al, which I did not know (or had forgotten) about. Here is the image updated to include Kobashi et al's measured temperatures for central Greenland. It shows the 2001-2010 average (yellow line), but also the 2010 temperature (yellow dot indicated by the red arrow) for comparison: Click on the image for a clearer view.
Revisiting my comments,
1) The revised figure shows GISP2 temperatures similar to current 9000 years ago, occasionally going as much as 0.5 degrees higher. No past temperature is as high as the 2010 temperature, but as the ice cores only show decadal resolution, that is not significant.
2) Despite the inaccuracy of Renowdon's estimate, at no time in the last 12 thousand years has central Greenland temperatures been 3 degrees C above the current decadal average. Alley et al (the data shown) do not show temperatures more than 1 degree C higher than present, while Kobashi et al's higher resolution reconstruction shows temperatures as much as 1.5 degrees C above present for very brief periods.
3) I cannot for the life of my figure out why Kobashi might take exception to my last comment in my previous post, which is a simple statement of fact.
Click on the image for a clearer view.
Revisiting my comments,
1) The revised figure shows GISP2 temperatures similar to current 9000 years ago, occasionally going as much as 0.5 degrees higher. No past temperature is as high as the 2010 temperature, but as the ice cores only show decadal resolution, that is not significant.
2) Despite the inaccuracy of Renowdon's estimate, at no time in the last 12 thousand years has central Greenland temperatures been 3 degrees C above the current decadal average. Alley et al (the data shown) do not show temperatures more than 1 degree C higher than present, while Kobashi et al's higher resolution reconstruction shows temperatures as much as 1.5 degrees C above present for very brief periods.
3) I cannot for the life of my figure out why Kobashi might take exception to my last comment in my previous post, which is a simple statement of fact.
-
Alexandre at 21:37 PM on 14 February 2012Fritz Vahrenholt - Duped on Climate Change
I like this picture illustrating the solar influence. They got the "Sun big, me small" argument quite litterally... And they even have the nerve to call climate science weak!
-
Captain Pithart at 21:17 PM on 14 February 2012Fritz Vahrenholt - Duped on Climate Change
btw, i have a website for collaborative debunking of the book online: http://de.kaltesonne.wikia.com/wiki/KalteSonneCheck all that is needed now are German-speaking experts that own the book and have free time at hand ;) Vahrenholt indeed was quite an important environmentalist, writing the influential "Seveso ist überall" (Seveso is everywhere) in 1978, which was quite good i hear. my best guess is that he's been dining with the wrong people for too long, buying into the "they want to impose on our lifestyles" meme. i think he's honest, but that does not make him less wrong or dangerous. the interesting thing is that while he's employed at RWE, one of the biggest coal polluters of Europe, he's working at the renewable energy section. nevertheless he pleads against the "demonisation" of coal. lie down with dogs, get up with fleas. p. -
elsa at 21:15 PM on 14 February 2012Fritz Vahrenholt - Duped on Climate Change
Readers may remember that in another recent section of this website there were extracts from articles in the Wall Street Journal. Having dared to ask the question of how the two sets of scientists views could be reconciled I was pointed to a website that gave a searcheable database of temperature. When I looked for this I could find little or no evidence of warming for the period 2001 to 2011 and it seems to have been generally if grudgingly accepted by posters to the blog that this was the case, at least as far as surface temperatures were concerned. Elsewhere this site has reprduced a graph that it call the escalator which also describes a flat temperature period from 2002 to 2010. Interestingly the final graph of this particular section shows no such pause in the increasing temperature. This section also has a graph of temperatures in North America which, needless to say, has the most recent years as the highest. Yet elsewhere on this site it is conceded that the 1930s had the hottest years there. What explains these inconsistencies?Moderator Response: [Sph] The text around the final graph clearly explains the answers to your questions about it, and also directs you in two places to the post on Foster and Rahmstorf (2011) where that figure (and others) first appeared. -
Captain Pithart at 21:06 PM on 14 February 2012Fritz Vahrenholt - Duped on Climate Change
»We should note that while we are flattered that Die Zeit has described Skeptical Science as "an internet platform close to the IPCC" in their figure caption, we are in no way affiliated with the IPCC.« the caption is not from Die Zeit, but from the KalteSonne website, probably from Lüning. They label everybody that does not subscribe to their fringe views as "IPCC", trying to discredit it this way. -
keithpickering at 20:43 PM on 14 February 2012New research from last week 6/2012
Invaluable, as usual. Thanks! -
logicman at 20:34 PM on 14 February 2012Fritz Vahrenholt - Duped on Climate Change
The ever-sensible Germans have taken to calling Fritz Vahrenholt 'feuer-fritz'. If I have it right, that's the nickname for a fireman or stoker: one who shovels coal. Whatever he's shoveling, it sure isn't science. -
bill at 20:17 PM on 14 February 2012Fritz Vahrenholt - Duped on Climate Change
Delingpole called him Germany's George Monbiot*! And 'a well-known green activist'. I suppose we must allow that, even with the delightful James' claiming it, there is still an outside possiblity that there might be some truth in it? Any of our Deutsche freunde know more of Vahrenholt's pedigree? *given the opinions he's expressed of Monbiot this is rather an odd compliment... -
Bern at 18:44 PM on 14 February 2012Fritz Vahrenholt - Duped on Climate Change
citizenschallenge: thinking people take this sort of crazy-talk seriously because most of them really have no idea what this climate change thing is all about. The few who pay more than cursory attention rarely ever look up & read the actual scientific reports (such as the IPCC's AR4). As is common in so many fields, they rely on media commentators to tell them what they should think about an issue. Sadly, in this case, the vast majority of those commentators are misrepresenting the science (whether deliberately, by omission, or by seeking a false 'balance', the outcome is the same). -
robert way at 17:25 PM on 14 February 20122000 Years of Climate Reconstructed from Pollen
I think that Kobashi et al (2011) might take issue with that final statement by Tom Curtis... If we're going to show Greenland temperatures we should show the work updated to present which Kobashi et al (2011) did... -
owl905 at 17:23 PM on 14 February 20122000 Years of Climate Reconstructed from Pollen
@Camburn - Misreading a response and pretzeling it back is sad. Your claim of a warmer arctic for a considerable amount of the past was bound to the pollen study (MWP), not to the 9kya Holocene peak. Your follow-on mish-mash of dates, adjectives, and claims only adds more embarrassment to the original fiction. Straight out - there is nothing in any of the proxies that makes the MWP warmer for a significant amount of time - quite the opposite, it shows brief spikes that matched the late 80s in some regions. To get a parallel to modern record levels, it's back to the Holocene peak - and that's a two-alarm observation. -
Tom Curtis at 15:44 PM on 14 February 20122000 Years of Climate Reconstructed from Pollen
Further to DB's comment (inline @14), here is the temperature record from Greenland (GISP2) showing modern temperatures for comparison: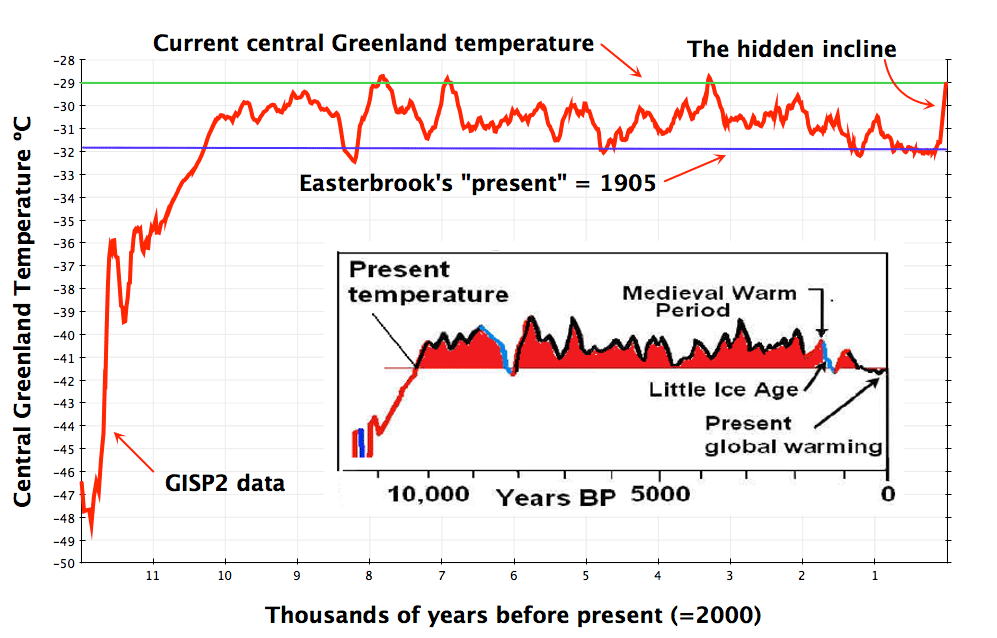 As clearly indicated, by the green line, central Greenland temperatures where not warmer than current temperatures about 9,000 years ago. The green line should not be taken as an exact indicator, based on the methodology used to produce it. But it is accurate enough to show the 3 degree C difference was not universal in the Arctic.
Note also that by convention, reports of modern temperatures in paleo studies are based on 1950 temperatures unless otherwise specified, so the 3 degree difference reported by Camburn may in fact be a 0.5 to 1 degree difference from current temperatures in the 2000s.
As clearly indicated, by the green line, central Greenland temperatures where not warmer than current temperatures about 9,000 years ago. The green line should not be taken as an exact indicator, based on the methodology used to produce it. But it is accurate enough to show the 3 degree C difference was not universal in the Arctic.
Note also that by convention, reports of modern temperatures in paleo studies are based on 1950 temperatures unless otherwise specified, so the 3 degree difference reported by Camburn may in fact be a 0.5 to 1 degree difference from current temperatures in the 2000s.
-
Norman at 15:29 PM on 14 February 2012NASA Mission Takes Stock of Earth's Melting Land Ice
Tom Curtis @53 "You quoted a figure from the total ground water used as irrigation and determined from that a projected increase in sea level. You did not mention recharge, and did not attempt to determine recharge before calculating the impact on sea level." Before my posting at 21, I had looked at this page. In post 21 I was not doing a highly detailed analysis, just demonstrating ball park numbers. "About 62 % of water used in agriculture, globally, comes from surface sources (e.g., rivers) while about 38 % comes from ground water (underground aquifers). However more of Earth's freshwater is in aquifers than in surface sources -- in fact, about 99 % of all liquid freshwater is in groundwater. (Issues in Ecol (9) 2001). Much (> 75 %) of this groundwater is "fossil water;" -- water that is not being recharged but is relic from wetter ancient climate conditions and from melting ice after the Pleistocene ice ages. Once we use it, it is "gone" for all practical purposes." source of quote. The Wikipedia article on irrigation gave the 545 km^3/year for irrigation. The above article made the claim that over 75% of the water used in irrigation was fossil water and is not being recharged at any appreciable amount (which is why I used the Ogallala Aquifier in my post to you, it is one of the types of Aquifiers that does not recharge very much and most the water withdrawn from it for agriculture will take a very long time to return). You call using the Ogallala Aquifier a "cherry pick", but I call it a demonstration of just how slow this type of aquifier fills up. The article I linked to above said over 75% of irrigation uses this type of aquifier. In your Post at 47 I am convinced that you and I are not making a communication link. "For what it is worth, the paper you link to estimates a global recharge rate of 15,200 km^3 per annum, and a withdrawal (abstraction) rate of 734 km^3 per annum. So withdrawal is only 5% of recharge globally, according to this paper. So, despite your continued cherry picking of the data, you have still not shown evidence that supports your claims, let alone establishes them." What I am talking about is removal of water from deep aquifiers that is not being replaced. If it is taken out from those aquifiers and not replaced, it is being added to the the surface water total amount. You are talking about groundwater recharge rate of 15,200 km^3 km/year (not recharge rates of deep aquifiers...a big difference) which makes sense it would recharge at this rate since this is the amount that is leaving the system (so it maintains balance)... "According to hydrologists and climatologists, about 15,000 cubic miles of water may evaporate from the earth's land sources each year. This includes water that moves through growing plants as transpiration. This value is less than 20% of the water that evaporates from all the seawater sources on earth." source. Finding the exact amount of water withdrawn from deep aquifiers minus replacement may not be possible. All sources I have researched would indicate it is much higher than the 61 km^3/year used in the paper KR linked to in previous posts but it has a large range. I can't agree with KR's sources as other peer-reviewed items state a much higher water removal. Tom, even when I completely explain the reason I gave you the Ogallala aquifier example you still call it a "cherry pick". Why do you keep making that claim and stating my intent is to mislead? The Ogallala aquifier was not used in my calculation. As you pointed out, they do not use any units on that web page. The purpose of bringing up that link was to give you a real example of the slow rate of recharge of a deep aquifier of which most irrigation uses (at least according to the source in the quote above making the claim over 75% of irrigation uses these slowly recharging wells). I think I have done a fairly decent job of research to show my point in global context. For reference check out the link in Post 43 and look at the table 7.4. -
Doug Hutcheson at 15:02 PM on 14 February 2012Peter Hadfield on Himalayan glacier melt
John Russell @ 3 et al Some of the comments to the Chivers article are priceless:I think its rubbish, and if it isn't, the cure is worse than the disease, I don't want to revert to the Stone Age.
If you want to know the truth about Arctic ice - check the blogs, don(t ask "the scientists"
If you, Tony, had been doing your job, you would have noticed a number of references to scientific work in the blogs, torpedoing the rising seas claims, papers and discussion about whether CO2 produces a positive feedback (the basis of the AGW scam) or negative feedback. The "consensus" is it is negative.
It's a regular 50-70 year cycle caused by the accumulation of iron in the ice.
We are putting more CO2 into the atmosphere, and the temperature is now gradually declining.
CO2 expands much more than air.
I inhabit SkS-space, because at least the comments appear to be rational. I struggle to understand the science, but at least I really do try. It is depressing how many people deny the science because they don't like what it says. Accumulation of iron in the ice? Riiiiight. -
andylee at 14:52 PM on 14 February 2012Peter Hadfield on Himalayan glacier melt
Thanks KR, that makes sense... but that ocean heat has to come out again somewhere as it is eventually distributed around the entire ocean through the various conveyor belts, nibbling (or munching) on ice shelves and glacier faces. -
owl905 at 14:27 PM on 14 February 2012Climate mythbusting at Lane Cove, Sydney on Feb 28
Best of luck with it. If you're looking for an intro grabber to frame the discussion, you might consider the cancellation of NOAA's detailed 20th-century climate reconstruction - because at a very fundamental level, this is a war about knowledge. http://www.scientificamerican.com/article.cfm?id=noaa-halts-reconstruction-past-climate -
Rob Painting at 14:18 PM on 14 February 2012CO2 is plant food? If only it were so simple
layzej- "Even if I were to trust that the four you selected are representative, I am not qualified to judge their merit." No need to rely on trust. You can search for yourself, just limit your search from 2010 onwards because that is representative of recent research (obviously). If you can find any paper that observes a net global benefit from increased CO2 I'd be interested. I haven't found one. "A source does earn credibility to the layman when he goes out of his way to point out when his own case is being overstated" There is no need for SkS to overstate things, the facts are what they are. The carbon cycle models assume a big CO2 fertilization effect this century, you can check the 2007 IPCC report for yourself. That this isn't being observed should be cause for concern, because we are talking about many decades worth of fossil fuel emissions (at today's burn-rate) staying up in the atmosphere. That there is a lot of extra warming if the CO2 fertilization effect doesn't pan out. I was surprised when he included this post among the ignorant.... As was I. Dawei's post is very well-balanced in my opinion - although it deals strictly with the effects on crops, rather than global vegetation. Nevertheless what John Nielsen-Gammon has written there is wrong. The man just hasn't done his homework. The tropics, and the Amazon in particular are in a precarious situation that could very rapidly turn the tropical forest carbon sink, the largest forest sink, into a source. Of course it may not happen, we are talking about projections after all, but the current trends are not encouraging. -
Camburn at 14:15 PM on 14 February 20122000 Years of Climate Reconstructed from Pollen
owl905@13. Thank for the links. Once again, the bow head whales confirm the Forest-Tundra was warm 1,000 YBP. Let me being by stating this is a paleo reconstruction is it not? When reading this paper, I think long term. When I state that the Arctic was warmer than present for a significant of time in the past, I deem several thousand years as significant. "During the first of these intervals (9000 before present) ice cores indicate that summer temperatures were about 3°C warmer than mid 20th Century." From the above link nrcan.gc.ca Think long term again folks. 3.0C warmer than the mid 20th century. DMI Arctic Temperatures: DMI Arctic Temperatures The temperature anomoly starts at 1958. Play around with it if you care to. You will see that Arctic Temps have not warmed 3.0C, according to this data anamoly set. The DMI is not to be used for actual temperature, it is an anamoly. With the anamoly, one can see the change in temperature, not the actual temperature. As I originally indicated, the Bowhead Whale proxy data suports the temp spike at approx 1,000 YBP provided by the pollin data. The Bowhead whale data supports the rangeing of the whales.Response:[DB] "During the first of these intervals (9000 before present) ice cores indicate that summer temperatures were about 3°C warmer than mid 20th Century."
In your rush to prop up your case you neglect the remainder of the quote (P. 5 of the linked pdf):
"There appears to be firm evidence from ice cores that the early Holocene was substantially warmer than the late Holocene in the northeast CAA (e.g., Fisher et al., 1995).
F. Koerner (pers. comm. 2000) estimates from melt-layer and isotopic records of the Agassiz Ice Cap that early Holocene summer temperatures were 3 ± 1°C higher than present. A strong early Holocene peak of bowhead bone abundance in the central and eastern CAA at 10 – 8 14C ka B.P. (Dyke et al., 1996a) may be explained by reduction of summer sea-ice cover due to that greater warmth.
However, changing ocean circulation patterns accompanying recession of the Laurentide Ice Sheet can also explain the bowhead peak (Dyke and Morris, 1990). It appears that neither increased warmth nor ocean circulation changes were large enough to clear summer sea ice from Norwegian Bay and areas north of there regularly during the early or the middle Holocene."
Emphasis added.
So it is noted that the numerical figures you quote
- were not a published figure
- were limited to only a portion of the Canadian Arctic Archipelago
- were not representative of even the Canadian Arctic as a whole
The use of DMI 80°N temps as being representative of the Arctic as a whole is a mis-step on your part. One, because it does not cover the entire Arctic and two, because summer melt and the nature of its gridding mean that it is biased low (resulting in it's misuse as a fake-skeptic's favorite toy):

The temperature series published earlier by Ranyl in this series is much more representative of Arctic temps, as can be seen here:
-
citizenschallenge at 13:43 PM on 14 February 2012Fritz Vahrenholt - Duped on Climate Change
A couple days ago I had Vahrenholt's interview shoved at me with the implication being that here was further proof that the Global Warming conspiracy was finally being exposed. Reading it I was shocked at his transparent misrepresentations of IPCC and climatology in general. And disappointed that any thinking person would actually take his crazy-making seriously. Thank you for this thorough documentation of Vahrensholt's many misrepresentations. I look forward to sharing it ~ sadly though we can lead a denialist to information but, but . . . well we can always hope. -
layzej at 13:37 PM on 14 February 2012CO2 is plant food? If only it were so simple
Rob Painting @ 101, not scientific no, but I'm no scientist - just a mere mortal. There are about 27,000 hits on Google scholar for CO2 fertilization - more than I could possibly review. Even if I were to trust that the four you selected are representative, I am not qualified to judge their merit. For us mortals it really is a matter of trying to assess the reliability of our sources, and relying on them to honestly portray the literature. I look forward to reading the IPCC AR5 and finding out which of you came closest to their assessment. A source does earn credibility to the layman when he goes out of his way to point out when his own case is being overstated. Real Climate does a good job of this. JNG perhaps goes too far in this case. I recommended this SkS article to JNG's site as a source that gives an honest assessment of the effect of rising CO2 on plant growth. I was surprised when he included this post among the ignorant and/or [-preemptive snip-]. JNG may well have failed his own litmus test. I'll wait for AR5 before I judge. -
bill at 12:55 PM on 14 February 2012Climate mythbusting at Lane Cove, Sydney on Feb 28
John Abraham don't much resemble a long-boiled crustacean in that graphic, do he? -
sauerj at 12:34 PM on 14 February 2012Climate mythbusting at Lane Cove, Sydney on Feb 28
John, do you plan on broadcasting the video of the event on SkS? This sounds really interesting; sure hope the rest of us will be able to see it!Response: [JC] I don't know if they're videoing the event and to be honest, I wasn't planning on going out of my way to ensure that happens :-) -
apiratelooksat50 at 12:32 PM on 14 February 2012Climate mythbusting at Lane Cove, Sydney on Feb 28
DB at 2 That's funny! -
sauerj at 12:23 PM on 14 February 2012Climate mythbusting at Lane Cove, Sydney on Feb 28
Note: First link (Climate Change: Busting the Myths) doesn't work.Response: [JC] Sorry, fixed the link which is to a PDF flyer of the event. -
Bernard J. at 12:10 PM on 14 February 2012Climate mythbusting at Lane Cove, Sydney on Feb 28
The truth is out there... -
owl905 at 12:05 PM on 14 February 20122000 Years of Climate Reconstructed from Pollen
Bowhead whale remains do not confirm a MWP Arctic warmer than the present from an early Dykes/England study: http://pubs.aina.ucalgary.ca/arctic/Arctic56-1-14.pdf (91K doc). There is a recent Swedish study that lays out proxy data for a double-spike around 1000 AD that exceeds modern values: http://www.medeltid.su.se/Nedladdningar/Poster_Ljungqvist_and_Grudd.pdf (328k doc) It doesn't appear to be a peer-reviewed publication, but the analysis seems solid. The most recent coverage available is based on the hypothesis that ice-core samples from 9kya parallel temps 4kya and 1kya - periods when bowhead whale remains have been found in the north-west passage (ergo it was ice-free in summer). http://www.nrcan.gc.ca/earth-sciences/climate-change/landscape-ecosystem/paleo-environmental/3947 Unfortunately for Camburn, "the Arctic was warmer during a significant amount of the past than present day temperatures." falls on its facia ... and the reconstructions also don't make a good case for the loss of Viking colonies collapsing due to falling temps. -
Daniel Bailey at 12:01 PM on 14 February 2012Climate mythbusting at Lane Cove, Sydney on Feb 28
Separated at birth???
 Enquiring minds want to know...
-
Camburn at 11:48 AM on 14 February 20122000 Years of Climate Reconstructed from Pollen
Sphaerica@4: You are correct, I was wrong. Thank you -
Pete Dunkelberg at 11:43 AM on 14 February 2012Climate mythbusting at Lane Cove, Sydney on Feb 28
I don't have any picture like that. Sigh. -
Camburn at 11:42 AM on 14 February 20122000 Years of Climate Reconstructed from Pollen
Tom@9: I have responded on the NW Passage blog. -
Camburn at 11:41 AM on 14 February 2012Northwest passage has been navigated in the past
Tom: I wasn't talking about the NW Passage, but that's ok. Bow head whale proxy data: Calgary Research Bowhead fossils Please note that the above paper mentions a period of low ice and expansion of bowhead whale domain approx 1,000 YBP which correlates well with the pollin proxy data of 2,000 years of Climate Reconstruction. -
Peter Hadfield on Himalayan glacier melt
andylee - That presumes all the energy imbalance goes directly into the ice. But only ~2.1% goes into the cryosphere. 80 * 0.021 = 1.68x (within a factor of 2 for back of the envelope), and given that recent years may have a radiative imbalance (not insolation) closer to 0.65 W/m^2, around 1.2x, so again fairly close for my rough numbers...
-
robert way at 11:33 AM on 14 February 20122000 Years of Climate Reconstructed from Pollen
There are a range of indicators which show that the hypsithermal occurred in different places at different times because of the impact of ice sheets etc... Lets remember the ice sheets only disappeared in the NE portion of the Arctic about 6-7000 years ago. Anderson et al (2008) document significant ice melt 3000 years ago and before that on ice caps in the Eastern Canadian Arctic. There are many other papers which suggest such things. I preach caution when approaching this issue using the hypsithermal and insolation as analogues. -
Tom Curtis at 10:58 AM on 14 February 2012Northwest passage has been navigated in the past
Camburn elsewhere maintains that the N-W Passage was significantly warmer than current for long periods of the Holocene, citing as evidence Bow Head whale skeletons. My understanding is that bow head whale skeletons can be found across the length of the North West Passage during a period the preceding the Holocene Climactic Optimum:"The distribution and radiocarbon ages of whale remains indicate that during at least one interval of the Holocene, Bering Sea and Davis Strait bowheads could intermingle, (Figure 1b). The Bering Sea bowhead was the first to reach the CAA about 10,000 carbon-14 (14 C) years ago (11,450 calendar years B.P.). Bowheads entered via the Beaufort Sea about 1000 years after submergence of the Bering Strait, and they ranged up to the fronts of receding continental ice sheets [Dyke et al., 1996; Dyke and Savelle, 2001]. Until about 9500 14 C years B.P. (10,700 calendar years B.P.), by which time the Davis Strait bowhead ranged into the eastern Northwest Passage, the Bering Sea and Davis Strait stocks were separated by a glacier ice barrier. With dissipation of this barrier, the two stocks were able to intermingle, ranging well beyond historical limits. About 8000 14 C years B.P. (8900 calendar years B.P.), the Bering Sea and Davis Strait stocks were separated, as they are today. Thus, a year-round sea ice barrier must have become established at that time in the central part of the Northwest Passage."
(Fisher et al, 2006, my emphasis) In other words the NW Passage was open only for 1,800 year interval ending approx 9,000 years ago and there has been no skeletal evidence since for the intermingling of Atlantic and Pacific Bowheads. That strongly suggests any opening of the straits since then has been brief, and intermittent at best. For what it is worth, genetic evidence suggests the Bering Strait Variety of Bowhead are more closely related to the Hudson Bay stock than to the Davis Strait stock. It also indicates genetic separation of Hudson Bay and Bering Strait stock for at least 8,500 years; which is consistent with a forced separation by the closure of the North West Passage since before the Holocene Climactic Optimum. It should be noted that Atlantic and Pacific Bowheads have once again started intermingling. This evidence strongly suggests that the North West Passage and Canadian Archipelago was warmer than at present approx 10 thousand years ago at the last peak of northern summer insolation (red curve and figures): However, it also strongly suggests it has not been warm enough in that region to maintain open waters since then, even though the Earth itself was warmer due to the gradually melting ice sheets.
Unless you have specific evidence of Bow Head populations intermingling in the North West Passage post 7,000 BC, you should stop using this evidence as though it suggested intervals of the passage being open throughout the Holocene. You frequently make that suggestion, but I see no evidence that supports it.
(Note: cross posted from here as I believe this to be the most germane place for this discussion.)
However, it also strongly suggests it has not been warm enough in that region to maintain open waters since then, even though the Earth itself was warmer due to the gradually melting ice sheets.
Unless you have specific evidence of Bow Head populations intermingling in the North West Passage post 7,000 BC, you should stop using this evidence as though it suggested intervals of the passage being open throughout the Holocene. You frequently make that suggestion, but I see no evidence that supports it.
(Note: cross posted from here as I believe this to be the most germane place for this discussion.)
-
Tom Curtis at 10:53 AM on 14 February 20122000 Years of Climate Reconstructed from Pollen
Camburn @3, my understanding is that bow head whale skeletons can be found across the length of the North West Passage during a period the preceding the Holocene Climactic Optimum:"The distribution and radiocarbon ages of whale remains indicate that during at least one interval of the Holocene, Bering Sea and Davis Strait bowheads could intermingle, (Figure 1b). The Bering Sea bowhead was the first to reach the CAA about 10,000 carbon-14 (14 C) years ago (11,450 calendar years B.P.). Bowheads entered via the Beaufort Sea about 1000 years after submergence of the Bering Strait, and they ranged up to the fronts of receding continental ice sheets [Dyke et al., 1996; Dyke and Savelle, 2001]. Until about 9500 14 C years B.P. (10,700 calendar years B.P.), by which time the Davis Strait bowhead ranged into the eastern Northwest Passage, the Bering Sea and Davis Strait stocks were separated by a glacier ice barrier. With dissipation of this barrier, the two stocks were able to intermingle, ranging well beyond historical limits. About 8000 14 C years B.P. (8900 calendar years B.P.), the Bering Sea and Davis Strait stocks were separated, as they are today. Thus, a year-round sea ice barrier must have become established at that time in the central part of the Northwest Passage."
(Fisher et al, 2006, my emphasis) In other words the NW Passage was open only for 1,800 year interval ending approx 9,000 years ago and there has been no skeletal evidence since for the intermingling of Atlantic and Pacific Bowheads. That strongly suggests any opening of the straits since then has been brief, and intermittent at best. For what it is worth, genetic evidence suggests the Bering Strait Variety of Bowhead are more closely related to the Hudson Bay stock than to the Davis Strait stock. It also indicates genetic separation of Hudson Bay and Bering Strait stock for at least 8,500 years; which is consistent with a forced separation by the closure of the North West Passage since before the Holocene Climactic Optimum. It should be noted that Atlantic and Pacific Bowheads have once again started intermingling. This evidence strongly suggests that the North West Passage and Canadian Archipelago was warmer than at present approx 10 thousand years ago at the last peak of northern summer insolation (red curve and figures):
However, it also strongly suggests it has not been warm enough in that region to maintain open waters since then, even though the Earth itself was warmer due to the gradually melting ice sheets.
Unless you have specific evidence of Bow Head populations intermingling in the North West Passage post 7,000 BC, you should stop using this evidence as though it suggested intervals of the passage being open throughout the Holocene. You frequently make that suggestion, but I see no evidence that supports it.
(Note: to moderators, I believe this post to be on topic here because, although I most frequently refer to the N-W Passage, the associated Canadian Archipelago temperatures are clearly on topic. I have also cross posted in the N-W Passage blog, and recommend Camburn responds there.)
-
Bob Lacatena at 10:48 AM on 14 February 2012Satellites find over 500 billion tons of land ice melting worldwide every year, headlines focus on Himalayas
So... 500 billion tons = 5 x 10¹⁷ grams. 333 Joules to melt 1 gram of ice, or 5 x 10¹⁷ grams * 333 J/g = 1.665 x 10²⁰ J Surface of the oceans of the earth is 360,000,000 km2, convert to square centimeters multiply by 10,000,000,000, or 3.6 x 10¹⁸. So Joules per square centimeter of ocean = 1.665 x 10²⁰ J /3.6 x 1018 cm2 = 46.25 J, per year, per square centimeter of ocean. Energy to raise 1 g (roughly 1 cm3 of ocean at 4˚C) by 1˚C = 4.2 J. 46.25 J/cm2 / 4.2 J˚/cm3 = 11 ˚-cm Or enough energy per year to raise the top 11 centimeters of every inch of ocean on the surface of the earth by 1 degree. Alternately, enough energy to raise the temperature of roughly the top meter of the earth's oceans by 0.1˚C per year. Ten years of that and you've raised the temperature of the top meter of the ocean by a full degree. -
robert way at 10:40 AM on 14 February 20122000 Years of Climate Reconstructed from Pollen
The modern period refers to the 1961-1990 average. Yes the baseline refers to that period. The end dates and the start dates for the MWP and LIA are 800-1200 AD and 1400-1850 AD respectively.

Prev 1272 1273 1274 1275 1276 1277 1278 1279 1280 1281 1282 1283 1284 1285 1286 1287 Next


