


 Arguments


Recent Comments
Prev 1283 1284 1285 1286 1287 1288 1289 1290 1291 1292 1293 1294 1295 1296 1297 1298 Next
Comments 64501 to 64550:
-
dorlomin at 20:43 PM on 7 February 2012New research from last week 5/2012
Am I reading that right and Lungqvist managed 120 proxies? Blimey that is some effort. -
Michael Whittemore at 19:15 PM on 7 February 20122012 SkS Weekly Digest #5
Jose@6 The middle of the cartoon is not half way between the expected climate change, the abyss is denying the science, there is no middle, rather you accept the science or you dont. United States is taking the roll of not listening to the science, you are suggesting that the United States are going to be accepting the science half way, this is not the case. Even if they did the bare minimum of what the IPCC suggest would be good enough. -
Old Mole at 18:07 PM on 7 February 2012NASA scientists expect more rapid global warming in the very near future (part 2)
Rob @45 Sorry about that ... I think most of my confusion was not figuring out that 0.25 W/m2, when distributed through 10+ cubic meters of sea water, is a very tiny signal indeed ... so inertial effects really could predominate. Thanks. -
Ari Jokimäki at 17:42 PM on 7 February 2012New research from last week 5/2012
Fixed, thanks. -
Rob Painting at 16:51 PM on 7 February 2012NASA scientists expect more rapid global warming in the very near future (part 2)
Old Mole - "Once again I am having a hard time puzzling this out, and would be grateful for a link to which paper by NASA scientists you rely on" Yeah, well some of the comments on this thread puzzle the heck out of me. I think this relatively easy to follow, but perhaps not. The NASA scientists are those mentioned at the top of this post, and the analysis linked to in the blog post. They state: "Because of the ocean's thermal inertia, global temperature change caused by solar variability lags solar irradiance by about 18 months." I've seen mention in other literature that the lag is closer to two years. But I wouldn't be able to link to one at the moment. See what I can track down as others seem to be having problems with the notion of ocean thermal lag too. and Judith Curry..... That was organic spambot Mace, JDey, or whatever he calls himself, impersonating Judith Curry. -
Rob Painting at 16:38 PM on 7 February 2012Major Study of Ocean Acidification Helps Scientists Evaluate Effects of Atmospheric Carbon Dioxide on Marine Life
William - I don't know if Doug Mackie is going to address alkalinity in the next installment on the chemistry of the ocean, but it's hardly relevant to changes occurring today. The main supply of alkalinity back to the ocean is via chemical weathering of silicate and carbonate rock and that operates on timescales of hundreds of thousands of years - at the least. The other mechanism, the dissolution of carbonate sediments, also takes place on timescales such that it is also no use to humans or marine life alive today, or in the foreseeable future. There are a number of upcoming posts on the subject of ocean acidification. Once all are completed, I'll tie them all together so the "big picture' is plain to see. -
Old Mole at 16:37 PM on 7 February 2012NASA scientists expect more rapid global warming in the very near future (part 2)
Rob Painting @34 "The suns energy has already been absorbed by the oceans and takes about 18 months for them to warm up and exchange all this heat with the atmosphere, thereby affecting surface temperatures. If you wish to contradict these NASA scientists, some supporting literature would be handy. Otherwise it's just an uninformed opinion." Once again I am having a hard time puzzling this out, and would be grateful for a link to which paper by NASA scientists you rely on. You say with confidence "18 months" and Judith Curry (in a post made in the last week that I can't find at present) suggested that it was more like 1 month. I am not sure there is really much of a contradiction, though. When you say "all this heat" you are no doubt correct ... but how much of "all" remains after 17 months? It was seem, based on no more than intuition, that there would be a least an order of magnitude difference between the heat released through evaporation in month 1 than the amount released in month 17. Please correct me if my grasp of fluid thermodynamics is at fault, and give me some idea of what the curve for energy release from the ocean would look like for a solar event, largely in the form of light energy in the visible spectrum and therefore confined largely to a relatively shallow surface layer, at least initially. -
Rob Painting at 16:23 PM on 7 February 2012NASA scientists expect more rapid global warming in the very near future (part 2)
Don9000 - Much ado about nothing. It was a simple inadvertent omission that I don't consider materially changes the intent of that part of the analysis - it's clearly explained in the body of the article that extreme warm events will increase markedly with global warming. Anyway, I've emailed Dr Hansen. If he replies and feels it should be changed, I will do so. -
Bernard J. at 16:14 PM on 7 February 2012Global Sea Level Rise: Pothole To Speed Bump?
Steve Case at #35:Skywatcher - The calculations I've done is to figure out that by 2101 Dr. Hansen's "plausible" scheme would be filling the oceans up at a rate of one millimeter per day.
I vectorised Hansen's graph, and keeping in mind that the resolution of the line was not wonderful, I obtained these additional rates of sea level rise: 2050: 0.0 mm/day (id est, below resolution) 2080: 0.2 mm/day 2090: 0.4 mm/day So your figure is ballpark, but you seem to think that it is surprising. You also seem to be completely ignoring Skywatcher's comment immediately preceeding yours, that Meltwater Pulse 1A added 20 m to sea level from ice sheets in as little as two centuries... In such a scenario, where ice is catastrophically melting as a consequence of sudden warming, it is entirely feasible for a millimetre order of magnitude to be added per day. However, the trajectory will be sigmoid, so the interval of time where such rise occurs will be short. The rates of rise for the preceeding decade intervals should have clued you in to the fact that the millimetre(s) per day phase would be short, and in the middle of the 'catastrophic' period. Your quibble is really a mathematical straw man. Given a particular global ∆T there will be a corresponding ∆SL, occurring over a corresponding ∆t. Fact. If Hansen's scenario comes to past, the rate of ∆SR will be in the order of millimetres per day around the point of inflection of the trajectory. Fact. And if it comes to pass, humans alive at that time will not be thanking humans alive today for having sat on their hands and argued about "how many Angels may fit upon the point of a Needle", to quote the theologian Baxter. -
keithpickering at 15:50 PM on 7 February 2012New research from last week 5/2012
I think the Callendar abstract should read: "The temperature observations at 200 meteorological stations ... ". -
Tom Curtis at 15:08 PM on 7 February 2012NASA scientists expect more rapid global warming in the very near future (part 2)
Don9000 @41, with respect, your background may be in English, but mine is in logic and philosophy (including the philosophy of language, science and epistemology, for what it is worth). The imprecise language found acceptable in English continually makes my skin crawl as a logician. The worst offense is the standard usage of saying "all are not" when what is meant is that "not all are". The difference between asserting that no member of a group has a particular property (all are not) and asserting that there are some members who do not have it (not all are) is apparently to subtle for the average English speaker. The same problem occurs in imprecision of terminology. "Implies" means that a relationship stands between the two propositions which supports modus ponens as explained @10 above. That is all that it means, in either English or in logical usage. It is used in common speach to soften assertions, but that usage is as inconsistent as asserting that "all are not" when you mean that "not all are". The question is, then, are the writers of a scientific paper more likely to be using the precise logical meaning of the word, or the common street misuse of the term. Choosing to believe the latter while ignoring the context of utterance is hardly credible. From context, the "implies" is not a strict justification of "modus ponens" because the implication is probabilistic, but neither is it a mere weakening of the assertion. The qualification on the assertion is merely the qualification on all empirical assertion. That is, to the best of the authors knowledge the two heatwaves would not have occurred without global warming; but the best of their knowledge is not claimed to be perfect. -
Tom Smerling at 15:00 PM on 7 February 2012Still Going Down the Up Escalator
BTW, SkSer John Russell had a guest post today at ClimateBites titled 'Escalator' Critics Miss the Point. John notes that the "skeptics'" quibbling about the data simply misses the main point of the graphic, which is to expose the deceptive technique known as "cherry picking." And it achieves that goal admirably. -
scaddenp at 14:55 PM on 7 February 2012Climate change policy: Oil's tipping point has passed
JP40 - interesting but a/ has anyone built a working economic fusion plant for the tech yet? b/ what would the cost of that power be if it worked? (A question that I know requires details of the fusion reactor as well the transport scheme). A working technology that is also cost efficient would be of interest but you can surely see why say windmills and fission are more interest at the moment. -
Tom Smerling at 14:49 PM on 7 February 2012Still Going Down the Up Escalator
Cherry-pickers of course hate "The Escalator." It strips their ploy naked, exposing its fallacy! (phallacy?) :) -
Don9000 at 14:14 PM on 7 February 2012NASA scientists expect more rapid global warming in the very near future (part 2)
Rob, I'm coming to this a bit late in the day, but I hope my comments will make sense! I found your summary effective, but must in part agree with apiratelooksat50 that you have been a bit unfair where that one passage is concerned. So . . . I'm glad to see that the original passage referenced by apiratelooksat50@9 is present in this post, since it shows that your summary of it is simply a bit jazzed up for our reading pleasure. On the other hand, while I am not a scientist, I do have a doctorate in English, and I can tell you that the distortion imparted to the original by you in the summary section would raise flags if a similar passage, without the original, surfaced in a student essay in disciplines where being faithful or fair to the source matters. Since many of us, on the subject of global warming, are students, I think we need to be very careful where sources are concerned. Because you provide the original, if I saw a similar paraphrase in a paper submitted to me, I think I would point out that you should be more temperate in your conclusion. To put it bluntly, I think you have unfairly implied that what you write as a summary is what the authors have stated. The word "state" is a very strong signal word, and should really only precede a quotation. The proper way to handle this would have been to reproduce the original passage (as you do with that last summary point): it is a pithy one, so quoting it once again makes good rhetorical sense. You could also revise the passage. Here is the way you wrote it: "A more than tenfold increase in extreme warm events, has the authors state that we can attribute the monster 2010 Moscow summer heatwave, and the 2011 Oklahoma/Texas heatwave, to global warming." I think something like this would be fairer to the source (though less pithy--most pithy passages are hard to succinctly paraphrase): Global warming is implicated in the recent more than tenfold increase in extreme warm events, including specific events like the summer 2010 Moscow heatwave and last summer's heatwave in Oklahoma and Texas. Hope this is clear! I enjoyed (if I can say that about more bad news regarding AGW) reading the article and learned a few things along the way. Don Blume -
Bob Loblaw at 14:14 PM on 7 February 20122012 SkS Weekly Digest #5
Jose_X: Where is the "middle ground" between "flat earth" and "round earth"? Which is closer to an oblate spheroid (the best model)? -
Bob Loblaw at 14:05 PM on 7 February 2012NASA scientists expect more rapid global warming in the very near future (part 2)
re: andylee @31 dawn and dusk was just a short way of describing the ring around the Earth where the sun is below the horizon, but the atmosphere is still illuminated, and indirectly heating the surface. Thus the fraction of the Earth receiving energy from the Sun would be slightly more than 50%. Given the extreme thinness of the atmosphere compared to the radius or diameter of the earth, this does not really affect the total sunlight intercepted by the earth. It does have a slight effect on where the energy falls, but this effect of atmospheric refraction is a standard part of the geometry of solar radiation calculations and modeling. Nothing new here. -
adelady at 14:01 PM on 7 February 2012Global Sea Level Rise: Pothole To Speed Bump?
"I can only try to imagine what would be required of the worlds's rivers, glaciers and sunshine in order to sustain a rate of sea level rise 100 times what it is today. " The main thing to remember is that large sea level rise rates won't be smooth. The ice on Greenland and Antarctica doesn't have to melt to cause a surge in SLR - it only has to shift. All you need for a big pulse of seawater to inundate a place, is for one, or several, almighty chunks of glacier or icesheet to slide into the ocean in some other place. These floating ice islands could calmly meander (or blunder) around and not fully melt until long after the effects of their water displacement had destroyed beaches, mangroves, farms or jetties or even ports and other major seaside infrastructure. -
Global Sea Level Rise: Pothole To Speed Bump?
Steve Case - "Plausible" is not, strictly speaking, a prediction, but rather describing what might be in the cards given certain emissions scenarios. As to: "I can only try to imagine what would be required of the worlds's rivers, glaciers and sunshine in order to sustain a rate of sea level rise 100 times what it is today" See the USGS data on water in the cryosphere: Estimated potential maximum sea-level rise from the total melting of present-day glaciers. Location / Volume (km3) / Potential sea-level rise, (m) East Antarctic ice sheet / 26,039,200 / 64.80 West Antarctic ice sheet / 3,262,000 / 8.06 Antarctic Peninsula / 227,100 / .46 Greenland / 2,620,000 / 6.55 All other ice caps, ice fields, and valley glaciers / 180,000 / .45 Total / 32,328,300 / 80.32 Collapse of the West Antarctic ice sheet alone would do it. -
Steve Case at 13:45 PM on 7 February 2012Global Sea Level Rise: Pothole To Speed Bump?
Skywatcher - The calculations I've done is to figure out that by 2101 Dr. Hansen's "plausible" scheme would be filling the oceans up at a rate of one millimeter per day. -
skywatcher at 13:34 PM on 7 February 2012Global Sea Level Rise: Pothole To Speed Bump?
Steve Case, you can imagine... or you can calculate these things, as Dr Hansen has done. There's enough ice in existing ice sheets to do the job. Some required reading for you would be to find out about Meltwater Pulse 1A, which added 20m to sea level from ice sheets in perhaps as little as 200 years. Not much required of the worlds rivers or sunshine, just the destabilisation of one or more of Earth's existing ice sheets. -
JP40 at 13:33 PM on 7 February 2012There's no correlation between CO2 and temperature
From what I've seen, deniers focus on graphs of very recent events, but seem to forget the one time in Prehistory that is similar to what's happening today. The Permian mass extinction was caused by CO2 releaced from a massive flood-bassalt eruption in modern-day Siberia. This caused a chain reaction of events that involved anoxification of the oceans, release of frozen methane from the sea floor, and the desertification of almost all of Pangea. 95% of all species died. It was the biggest extinction in the history of the earth... so far. -
Tom Curtis at 13:16 PM on 7 February 2012Global Sea Level Rise: Pothole To Speed Bump?
Norman @29, in addition to additional heat content inincreases below 2000m, I believe the NOAA figures do not cover areas of the Arctic, which may be responsible for some more of the discrepancy. (Unfortunately I cannot confirm that at the moment as the NODC website is down.) -
JP40 at 13:08 PM on 7 February 2012Climate change policy: Oil's tipping point has passed
The only short-term solution I see to get us off oil is Helium-3. This gas isotope can power fusion reactors that actually work. a Ton of it could power a major city for several months. The only problem is that there is almost none on the earth, but there is enough on the moon to power our current civilization for a thousand years, and there is much more on asteroids and in the atmospheres of the gas giant planets. It is estimated that it would cost 15Billion USD to build a self-sufficient moon base that could send HE-3 back to earth, more than a bargain for any country that takes the risk. This is an option that I haven't seen much intrest in by renewable energy experts. -
muoncounter at 13:00 PM on 7 February 2012Extreme weather isn't caused by global warming
More unusual weather news, courtesy Jeff Masters: Rare February tropical disturbance drenching the Florida Keys Our calendars may say it's February, but Mother Nature's calendar says it's more like May in the waters of South Florida ... ... today's rare tropical disturbance over South Florida is symptomatic of how whacked-out our 2012 atmosphere has been. In isolation, the strange winter weather of 2011 - 2012 could be a natural rare occurrence, but there have been way too many strange atmospheric events in the past two years for them all to be simply an unusually long run of natural extremes. Something is definitely up with the weather, and it is clear to me that over the past two years, the climate has shifted to a new state capable of delivering rare and unprecedented weather events. But I'm sure some will say 'its happened before.' Right. -
Tom Curtis at 12:57 PM on 7 February 2012Skepticism About Lower Atmosphere Temperature Data
Fred Staples @28, below are the HADAT trends for 1958-2002 (black), 1958-1978 (light blue), and 1979 to 2002 (red) with the 95% confidence intervals marked. I have marked the altitude in Km (to the nearest half km)of the respective pressure gradients for convenience. I have also marked the range of altitudes that contribute information to the TLT channel (dark blue), and the TMT channels (light blue) for convenience. The (unmodified) is figure 10 upper of Thorne et al 2005.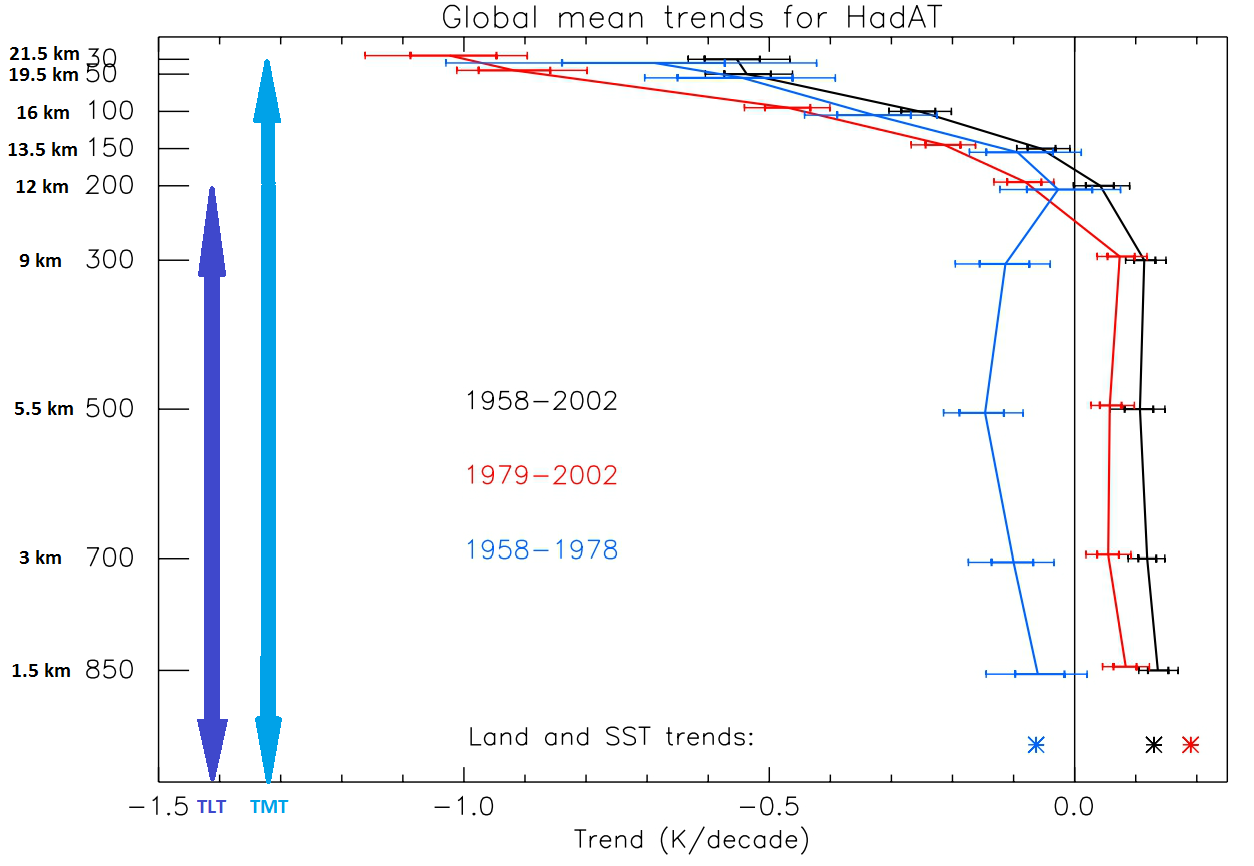 Several points are worth noting. First, the 5-95% confidence intervals are clearly marked, and show statistically significant cooling between 1978 and 2002 for all altitudes above 12 km, including a significant part of the TMT channel range, and a small part of the TLT channel range. Second, that means your calculated minimum period for statistically significant coolings for 11.74 Km and 13.5 Km are in error. Third, that clearly indicates that over the duration of observations, both the TLT and (particularly) the TMT channels have had tropospheric warming trends reduced or counteracted by including data from the stratosphere.
The situation is complicated recently (post 2000) for the lower stratosphere as you indicate. During that period, the lowest reaches of the stratosphere have been warming. That may be due to a combination of factors, with stratospheric temperatures being effected not just by CO2 concentrations, but also by ozone concentrations and Aerosol Optical Depth, both of which have varied over that period. It also may be why UAH has been showing higher TLT trends of late. However, it has no overall implication on the 1979 to present trend which, as can be seen above, is still strongly negative over that period for the lower stratosphere including those levels of the stratosphere included in the TLT channel.
Several points are worth noting. First, the 5-95% confidence intervals are clearly marked, and show statistically significant cooling between 1978 and 2002 for all altitudes above 12 km, including a significant part of the TMT channel range, and a small part of the TLT channel range. Second, that means your calculated minimum period for statistically significant coolings for 11.74 Km and 13.5 Km are in error. Third, that clearly indicates that over the duration of observations, both the TLT and (particularly) the TMT channels have had tropospheric warming trends reduced or counteracted by including data from the stratosphere.
The situation is complicated recently (post 2000) for the lower stratosphere as you indicate. During that period, the lowest reaches of the stratosphere have been warming. That may be due to a combination of factors, with stratospheric temperatures being effected not just by CO2 concentrations, but also by ozone concentrations and Aerosol Optical Depth, both of which have varied over that period. It also may be why UAH has been showing higher TLT trends of late. However, it has no overall implication on the 1979 to present trend which, as can be seen above, is still strongly negative over that period for the lower stratosphere including those levels of the stratosphere included in the TLT channel.
-
Steve Case at 12:51 PM on 7 February 2012Global Sea Level Rise: Pothole To Speed Bump?
RE: KR at 08:54 AM on 7 February, 2012 Rob Painting at 05:57 AM on 7 February, 2012 Specifically addressed me and had no link. Rob Painting at 06:11 AM on 7 February, 2012 Addressed AndyLee and had the link you are referreing to And on Page 43 in Section 13.5 of that link, Dr. Hansen says "Sea level rise has averaged about 3 mm/year since satellite measurements began in the early 1990s, with a moderate decrease in this rate during the past several years (Fig. 16)." And figure 16 is a redo of the Colorado Universtiy data. He concludes that, "[T]he rate of sea level rise is likely to accelerate during the next several years." and and gives two reasons, thermal expansion and ice melt. So it will take several years, (I always think of several as hovering around five) to see if he's right. Regarding the link I put up, and whether or not Dr. Hansen predicted 5 meters of sea level rise by 2100 starting on page 15 he says: However, the fundamental issue is linearity versus non-linearity. Hansen (2005, 2007) argues that amplifying feedbacks make ice sheet disintegration necessarily highly non-linear. In a non-linear problem, the most relevant number for projecting sea level rise is the doubling time for the rate of mass loss. Hansen (2007) suggested that a 10-year doubling time was plausible pointing out that such a doubling time from a base of 1 mm per year ice sheet contribution to sea level in the decade 2005-2015 would lead to a cumulative 5 m sea level rise by 2095. "Plausible ... lead[ing] ... to a cumlative 5 m sea level rise by 2095." I won't be here 83 years from now to find out. I can only try to imagine what would be required of the worlds's rivers, glaciers and sunshine in order to sustain a rate of sea level rise 100 times what it is today. -
IanC at 12:46 PM on 7 February 2012Global Sea Level Rise: Pothole To Speed Bump?
Norman @29 In your graphs only the heat content from 0-700m and 0-2000m are shown, so the discrepancy is due to the heat content of the ocean below 2000m. -
Composer99 at 12:44 PM on 7 February 2012NASA scientists expect more rapid global warming in the very near future (part 2)
Ken: You cited Rob as stating:The [S]un[']s energy has already been absorbed by the oceans and takes about 18 months for them to warm up and exchange all this heat with the atmosphere [Emphasis mine], thereby affecting surface temperatures
You then ask:If the sun's energy has already been absorbed by the oceans how is it expressed? It must be in temperature increase or phase change (evaporation or ice melt) right now
Yet Rob's previous statement answers your question already: ocean warming is a temperature change right now (as you suggest is required). -
muoncounter at 12:43 PM on 7 February 2012Global Sea Level Rise: Pothole To Speed Bump?
agwnonsense#27 Apparently the US Navy is concerned about sea level rise. In 2008, the National Intelligence Council judged that more than 30 U.S. military installations were already facing elevated levels of risk from rising sea levels. But maybe they should chuck that report over the side and go with your anecdotal evidence. -
Composer99 at 12:35 PM on 7 February 2012NASA scientists expect more rapid global warming in the very near future (part 2)
In addition to my immediate preceding comment, I should like to highlight another part of the phrase: "Increased occurence of such extreme anomalies, as a result of global warming, by more than a factor of 10, implies that we can attribute [Emphasis mine] such extreme anomalies, including that in Texas and Oklahoma, to global warming." That is a much stronger statement of attribution than I am used to seeing, which, occuring as it does in the same sentence as the implies under discussion, IMO reinforces the implication-as-logical inference point (while the inference also reinforces the positive claim of attribution). -
Composer99 at 12:32 PM on 7 February 2012NASA scientists expect more rapid global warming in the very near future (part 2)
apiratelooksat50: Dimly recalling logic classes in both math/comp sci and philosophy, a logical implication is an argument (and vice versa of course: an argument is a form of implication). As Tom Curtis indicated upthread, as a logical construct, A→B is "A, therefore B", which is much stronger than mere suggestion. As such, if I see 'implies' in a casual setting (newspaper, opinion piece, blog post) I am likely to interpret it in the suggestive sense. Seeing it in a more scientific context (such as the article by Hansen et al, I am likely to interpret it as an inference, and the context in which it appears:In the 1951-1980 period of climatology the area with temperature anomaly exceeding +3σ was only a few tenths of one percent. However, the area covered by such extreme anomalies has increased with global warming. +3σ anomalies covered 7% of the area with observations in Jun-Jul-Aug 2009, 13% in 2010, and 9% in 2011 (Hansen et al., 2012). Increased occurrence of such extreme anomalies as a result of global warming, by more than a factor of 10, implies that we can attribute such recent extreme anomalies, including that in Texas and Oklahoma, to global warming.
very strongly indicates to me that inference is what is meant, not the suggestion. -
Steve L at 12:32 PM on 7 February 2012Major Study of Ocean Acidification Helps Scientists Evaluate Effects of Atmospheric Carbon Dioxide on Marine Life
I think most buffering is done by the bicarbonate system (as in the human body), but if calcite and aragonite are what concern us most, then calcite and aragonite saturation should be measured. Note, however, that this saturation changes with pressure and temperature.... -
Norman at 12:05 PM on 7 February 2012Global Sea Level Rise: Pothole To Speed Bump?
Daniel Bailey @4 Where does the data for your combined heat content graph come from. The land + atmosphere and ice heating looks close to 20*(10^21) joules. Your ocean heating would then be over 200*(10^21) joules. On the NOAA page for ocean heat content none of the graphs show an ocean heat content of this magnitude. Their scale is in (10^22) joules but none of the graphs make it to 20 (which would be 200 in your units). It is correct that the ocean is gaining heat content since the study began but is this a slight stretch of the actual amount? source of graphs.
Response:
source of graphs.
Response:[DB] "Where does the data for your combined heat content graph come from."
The SkS graphic originates from Church et al 2011, and is derived from the original data used to make this graphic from the paper:

This depicts all the various components of our planet's energy budget. The dark purple is all the heat going into the upper ocean, the red is all the heat going into the deeper ocean and the green is all the heat going into land + atmosphere + ice. The other components are cooling due to volcanoes (light blue), cooling due to aerosols (grey), increased outgoing radiation due to a warmer earth (yellow).
So to isolate all the heat accumulating in our climate, just take the purple, red and green. The data was provided to SkS directly from one of the co-authors of the paper. The authors were then sent the final graph for approval.
So the SkS Total Heat Graph is based on peer-reviewed data and is an update of an earlier graph based on Murphy 2009, done by a different team but finding the same result.
-
Ken Lambert at 11:59 AM on 7 February 2012NASA scientists expect more rapid global warming in the very near future (part 2)
Rob #34 "Some is being misleading here Ken, and it's not me. The suns energy has already been absorbed by the oceans and takes about 18 months for them to warm up and exchange all this heat with the atmosphere, thereby affecting surface temperatures." If the sun's energy has already been absorbed by the oceans how is it expressed? It must be in temperature increase or phase change (evaporation or ice melt) right now. It might take 18 months (or much longer if going deep) for increased temperatures to be distributed elsewhere, however if it warms somewhere else by convection or conduction, then the temperature cools at the initial entry area unless this is a globally steady state system with a steady temperature gradient. It is not - ENSO and other circulations move heat about so that a warming gradient might raise surface temperatures in one part of the system and cool it other parts. -
Composer99 at 11:56 AM on 7 February 2012Global Sea Level Rise: Pothole To Speed Bump?
agwnonsense: You need to support those bald assertions ("zero rise"? "incidental variations"? Please!) with evidence. Your reference to "panic" is IMO violating the spirit of the comments policy here. At present the best evidence shows your claims regarding empirical phenomena are simply incorrect. If you have any evidence to present to support your assertions, any on sea level can be presented in this thread. Any others can be directed to the appropriate threads so as not to be on-topic. -
agwnonsense at 11:43 AM on 7 February 2012Global Sea Level Rise: Pothole To Speed Bump?
I am expecting the same as global warming a ZERO rise not panic over incidental variations that have no relevance on a global scale.Moderator Response: [Rob P] - please note that nonsensical assertions do not constitute earnest discussion. Either contribute to the discussion, supported by peer-reviewed literature or find an alternative blog suitable for the airing of unsubstantiated non-expert opinion. Please make yourself familiar with the comments policy. Any further breaches will result in the deletion of offending comments. -
Rob Painting at 11:25 AM on 7 February 2012Global Sea Level Rise: Pothole To Speed Bump?
Steve Case @ 17 - Hansen (2011) - Earth's Energy Imbalance and Implications, looks at the observations in the last few decades - that is what I'm referring to. They claim that the rate of ocean heat uptake has declined recently. It is absorbing heat at a slower rate than earlier in the satellite altimetry record. Isn't that what you keep waffling on about? For my part, I think it's interesting to look at the observations and see if they match prior expectations. If not, why not? We don't know what role (if any) the rapid industrialization of China in the last decade has had on the concentration of reflective particles of pollution (aerosols) in the atmosphere, but it's possible they contributed to a slower rate of ocean heat uptake. We won't get to find out for a few years yet, when the next state-of-the-art aerosol measuring satellite is launched. Hopefully that one won't crash into the sea. Anyway, I'll cover all this when I get around to writing up the Hansen paper. -
John Hartz at 10:53 AM on 7 February 20122012 SkS Weekly Digest #5
Jose_X: The character falling into the abyss is Uncle Sam. Toles is critiquing the "middle of the road" position taken by the American people and its government. -
Riduna at 10:48 AM on 7 February 2012Still Going Down the Up Escalator
First the Hockeystick, now a very robust Escalator - enough to send the WUWT commentariat into a paroxism of doubt, if not anguish. Well done Dana! -
Paul Magnus at 10:24 AM on 7 February 2012Global Sea Level Rise: Pothole To Speed Bump?
KR @16 and the la ninas correlate closely to following peak temp years ... 1998, 2005, 2003?, 2010..... -
Nick Palmer at 10:21 AM on 7 February 2012Check With Climate Scientists for Views on Climate
How true, Ken. They should be able to. And yet there are so many who so confidently repeat the most awful, frequently disproved, rhetorical arguments that, if they were not actually designed to mislead, must have been generated by those incapable of fully understanding "the essentials". Furthermore they appear to be also incapable of understanding their errors when they are pointed out - judging by the fact that they keep on endlessly repeating and embellishing them. -
chirhophoros at 10:17 AM on 7 February 2012NASA scientists expect more rapid global warming in the very near future (part 2)
Tom Curtis @24: I agree - the categories I mention do overlap as do so many matters in which judgement (arbitration) is required. I agree that 1951 -1980 and 1981 to present are statistically quite different periods. However, is the statistical difference between the two periods unprecedented? Do we have have data (albeit somewhat truncated because less data may have been recorded) from earlier periods to suggest that 1981 to present is vastly different (eg, early 20 century data or 19 or 18 century data)? If available, it ought to be highlighted because it would be compelling. CC -
Chemware at 10:09 AM on 7 February 2012Global Sea Level Rise: Pothole To Speed Bump?
@18 agwnonsense I would not expect to notice much change in reefs and rocks, but beaches are another matter. All up and down the east coast of Australia, from Wilson's Prom and up to the Sunshine coast, there is severe beach erosion. My "home" beach, Old Bar (east of Taree), will likely loose it's surf club in the next few years. Less dramatic is the sand just offshore - over the Christmas break we bodysurfed at beaches from Coffs Harbour down to Lorne. We found that at most of these beaches the bottom shelved more quickly and deeply than I remember, and waves were "dumping" far more: sand had been removed over the years. Look not at rocks and reefs as a layman's visible sign of rising sea levels - look at the beaches. -
sauerj at 09:56 AM on 7 February 2012Global Sea Level Rise: Pothole To Speed Bump?
Just to clarify: The 30" minimum sea level rise by 2100, mentioned above in @22, is based on "Year 0" being 1990, not present day. See Fig.3 in Sea level rise predictions are exaggerated. Thus, this rise is based on being over a 110 span. -
sauerj at 09:41 AM on 7 February 2012Global Sea Level Rise: Pothole To Speed Bump?
@18 agwnonsense 1) Sea level has gone up ~3" in the last 30years (since 1980); it is unlikely you could discern this unless taking careful measurements. 2) It has gone up ~8.5" since 1870 (Sea level rise: the broader picture). 3) When including melting from Greenland ice-sheets & antartica, sea level is projected to rise a minimum of 30" by 2100 (Sea level rise predictions are exaggerated). This 30" rise assumes curbing CO2 emissions per IPCC's 'B1' scenario, which doesn't seem very likely anytime soon. .. For me, this is very concerning! -
andylee at 09:30 AM on 7 February 2012Global Sea Level Rise: Pothole To Speed Bump?
Sea level rise is not quite like filling a bath. Even if enough of Greenland's ice melted to increase sea level by 1 meter, it would still take many years or a couple of decades for it to distribute by gravity and be noticed on far-off shores. -
AussieinUSA at 09:18 AM on 7 February 2012Global Sea Level Rise: Pothole To Speed Bump?
@18 agwnonsense - The current rise is 3.18mm/year. That is very hard to visually see, especially with waves coming in and out, along with tides as well. Question is, what are you expecting to see? -
Rob Honeycutt at 09:01 AM on 7 February 20122012 SkS Weekly Digest #5
Jose... I think you're overanalyzing. I believe the intent of the cartoon is to say that by ignoring the science and trying to find the middle ground between these "two sides" politically is a perilous thing. This is not a matter of do we fund more highways or more transmission lines. We can vote on what we believe the right path is. We have a serious problem when one side of a debate is saying we should vote against science (i.e, "knowledge"). Science is telling us we have a serious problem. Let's vote on how we address that problem rather than trying to vote on whether or not to believe the science. -
Composer99 at 08:59 AM on 7 February 2012The Latest Denialist Plea for Climate Change Inaction
In my comment upthread noting characteristics of science denialism I forgot a component: (Psychological) Projection I'm not sure if the WSJ letter by Lindzen et al includes this component. It would not surprise me if it did.
Prev 1283 1284 1285 1286 1287 1288 1289 1290 1291 1292 1293 1294 1295 1296 1297 1298 Next


