


 Arguments


Recent Comments
Prev 1284 1285 1286 1287 1288 1289 1290 1291 1292 1293 1294 1295 1296 1297 1298 1299 Next
Comments 64551 to 64600:
-
Rob Painting at 08:56 AM on 7 February 2012NASA scientists expect more rapid global warming in the very near future (part 2)
Ken Lambert @ 29 - "Well Rob, when I started commenting on SKS, Solar was a lot smaller. When the warming imbalance was 0.9W/sq.m - Solar was only 0.13 +/-0.13 W/sq.m." Is that right Ken? Sounds like 0.13 might be referring to the anomaly from a baseline which would yield about 0.26 W/m2. But then I don't know which SkS blog post you are referencing. "How can it be a contributor to global warming if it is a predictable cyclical variation which has always been there?" This is in the introduction to this blog post: "This is not a new phenomenon, but simply a reflection of natural variability, cool (La Niña) and warm (El Niño) phases which still exert a temporary cooling/warming influence on global surface temperatures even in the presence of a persistent global warming trend" I don't know why you are confused on this point, I've made it very explicit. The same deal applies to the solar cycle - at times it reinforces the global warming signal, and at other times it acts as a brake. "Further this 'warming already committed but not yet manifest in surface temperatures' is somewhat misleading. The energy is already stored somewhere - expressed as increased ocean temperatures or phase change right now. All the temperature expression we have now is a reflection of cumulative past global energy gain or loss." Some is being misleading here Ken, and it's not me. The suns energy has already been absorbed by the oceans and takes about 18 months for them to warm up and exchange all this heat with the atmosphere, thereby affecting surface temperatures. If you wish to contradict these NASA scientists, some supporting literature would be handy. Otherwise it's just an uninformed opinion. -
Global Sea Level Rise: Pothole To Speed Bump?
Steve Case - Rob Painting explicitly said Hansen et al 2011, with a link to "Earth's Energy Imbalance and Implications". That illustration does not appear in the linked paper Hansen et al 2011, "Paleoclimate Implications for Human-Made Climate Change", shows that image simply to demonstrate that "the fundamental issue is linearity versus non-linearity", and showing the differences in projections - an illustration of growth rate curves, not a prediction, which is clear upon reading the paper. -
Jose_X at 08:51 AM on 7 February 20122012 SkS Weekly Digest #5
With respect to the cartoon, yes, it is funny, but it's rather extreme to consider the middle position to be unacceptable, no questions asked. Consensus comes from a position somewhere in the middle. The IPCC didn't pick climate sensitivity to be 10. It took something of an average (which necessarily would fall in that "abyss" section). We don't pick a most extreme value as the representative of a group. People know this lesson, that the middle ground is likely where it is most likely to be correct or to lead to some sort of peace among the feuding parties. If the message intended by the cartoon is a different one (eg, about professionals in near consensus vs the full population), then that point should be a little clearer. Plus, the cartoon makes it look as if picking an extreme side is healthier than trying out the middle. How is someone supposed to move from say the right side to the left side in a responsible fashion? Should we blindly accept what "central power" dictates? You know that view doesn't fly at the polls.. and for good reason (and popular polls do count in a "democracy"). If I value democracy, I find it valuable to be convinced personally (convinced to some extent), and this means I need a path if I currently happen to be on what might be the wrong side. Suggesting an extreme position might be the right one looks (eg) elitist from the outside since that is a position saying that you aren't fallible. People who take extreme positions have a history of not being able to argue on merits (eg, because they don't really understand or have a dishonest agenda).. that's what extremism suggests to many people in the middle (falling into the abyss) who you probably want over on your side. -
agwnonsense at 08:47 AM on 7 February 2012Global Sea Level Rise: Pothole To Speed Bump?
I work at sea and live by the sea and I am having a little trouble finding any sea level rise.The rocks that I fished off 30 years ago are still there,the reefs I surfed 30 years ago are still being surfed by a new generation of surfers so please explain,I really would like to know. -
Steve Case at 08:42 AM on 7 February 2012Global Sea Level Rise: Pothole To Speed Bump?
Rob Painting
...If ice melt has accelerated, and it has, then perhaps thermal expansion might have slowed in the last decade? Hansen (2011) has an interesting look at the thermal expansion aspect and his team's calculations show a rapid acceleration in sea level rise is likely this decade.This paper?
Paleoclimate Implications for Human-Made Climate Change I thought it showed modest acceleration in sea level rise this decade and doubled per decade until by 2100 it was going up hundreds of millimeters per year. See figure 7 on page 14
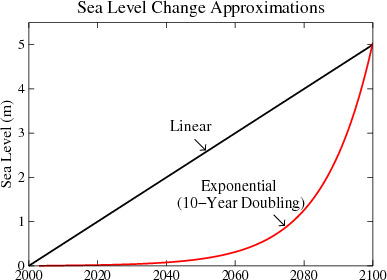
Fig. 7. Five-meter sea level change in 21st century under assumption of linear change (Alley, 2010) and exponential change (Hansen, 2007), the latter with a 10-year doubling time. -
william at 08:32 AM on 7 February 2012Major Study of Ocean Acidification Helps Scientists Evaluate Effects of Atmospheric Carbon Dioxide on Marine Life
I haven't yet seen anyone deal with alkalinity rather than pH. In contrast to what one would think at first glance, alkalinity is not the opposite of pH. Alkalinity is the ability of a buffered solution, such as sea water, to absorb an acid without much change in pH. If it is a muli-buffered solution, as I assume sea water is, when the first chemical buffering ion is used up, a little more acid should send the pH levels plunging until the next ion begins to operate. A simple titration dropwise with very dilute HCl with number of drops in the X axis should show a step like diagram. If this is so, one wonders how close we are to the first precipice and if at the next plateau, it will be calcite and aragonite that are doing the buffering. by by oysters etc. I suspect that measuring alkalinity might be much more useful that the much easier measure of pH. -
Global Sea Level Rise: Pothole To Speed Bump?
Paul Magnus - You are quite correct about the leveling off periods. Comparing those to a list of ENSO cycles shows that every one of them is during a La Nina phase, when rainfall over the continents is higher.

-
Paul Magnus at 07:23 AM on 7 February 2012Global Sea Level Rise: Pothole To Speed Bump?
Interesting pattern is the levelling off of the SL rise when ever we get a peak in Global temp. And of course the connection with the El Nina.... but it could be more direct also. -
scaddenp at 07:16 AM on 7 February 2012More Carbon Dioxide is not necessarily good for plants.
"I guess you are referring to Canada or Australia during the Carboniferous period" No, actually I was thinking of Eocene-Miocene coals in NZ. Australian coals are Permian to Jurassic. I associate Carboniferous coals with North America and Europe mostly. -
David Lewis at 06:50 AM on 7 February 2012NASA scientists expect more rapid global warming in the very near future (part 2)
The Hansen 2011 paper also repeats the "smoking gun" analogy Hansen used starting around 2005. "The strong positive energy imbalance during the solar minimum, and the consistency of the planet’s energy imbalance with expectations based on estimated human-made climate forcing, together constitute a smoking gun, a fundamental verification that human-made climate forcing is the dominant forcing driving global climate change. Positive net forcing even during solar minimum assures that global warming will be continuing on decadal time scales." -
Global Sea Level Rise: Pothole To Speed Bump?
Alden Griffith - Agreed, it's easy to get into overfitting. Without further examination, such as calculating the Akaike information criterion (AIC) to look at the tradeoff between bias and variance, at whether the data supports the extra parameters of the higher-order fit, it's easy to get caught up in the close fit of an overly complicated model. Regardless, in terms of predictive power: Physics - excellent predictive power Good statistics - fair predictive power if nothing's changing Bad statistics - better off with a wishing well Short term high order fits without evaluation are really just bad statistics. -
andylee at 06:42 AM on 7 February 2012Global Sea Level Rise: Pothole To Speed Bump?
Can't help but feel that the current lull is a Silence before the Storm phenomenon - the next couple of years should be very eventful, and even more unequivocal. -
David Lewis at 06:42 AM on 7 February 2012NASA scientists expect more rapid global warming in the very near future (part 2)
Miscellaneous notes: The Hansen 2011 "Earth's Energy Imbalance and Implications" paper lists von Schuckmann as a co-author which indicates how much Hansen is relying on her estimate of ocean heat storage. She and Le Traon analysed ARGO 2005-2010 data that Hansen says he emphasizes "because of its potential for accurate analysis" compared to the pre-ARGO data which he says in his talks is "very noisy". Loeb used various datasets from 2001 to 2010. Hansen states that although the "measured energy imbalance" found by his paper was 0.58 W/m2, because that period was "a deep solar minimum", "we estimate the energy imbalance averaged over a solar cycle as 0.75 W/m2". I found that a Youtube video of Hansen discussing the ideas presented in his 2011 paper was a valuable aid as I studied the paper. Regarding the apparently warm year of 1998: It wasn't just an El Nino of the century but that El Nino had perfect timing. The Hansen 2012 paper says this: "Hansen et al. (2010) showed that the correlation of 12-month running-mean global temperature and Niño 3.4 index is maximum with global temperature lagging the Niño index by 4 months. Thus the 1997-1998 "El Niño of the century" had a timing that maximized 1998 global temperature" Hansen's New Climate Dice paper, which is referenced by Hansen 2012, discusses the issue of increased likelihood of extreme events using an analogy Hansen has used for decades. Its an easily understood point of view. Any casino that detected that the dice in use were loaded in favor of the players would act immediately to end the threat. No one running the casino would say that loaded dice couldn't be said to be responsible for any individual win - they wouldn't waste their time thinking that way. They would immediately understand that loaded dice would quickly lead to the bankruptcy of the casino. -
Rob Painting at 06:11 AM on 7 February 2012Global Sea Level Rise: Pothole To Speed Bump?
Andylee - excess energy has gone into the ocean, but how did the current rate of energy flow compare to the early part of the satellite altimetry record, the early 1990's? We don't really know for sure because ocean heat measurements were sparsely sampled in space and time prior to 2003. And most XBT measurements only went to 700 metres, whereas the present ARGO float network can go to 2000 metres - which gives a better indication of how much heat is absorbed by the oceans. Hansen (2011) suggest ocean heating has slowed in recent times for several reasons, but expects it's going to build up quickly this decade. -
Alden Griffith at 06:04 AM on 7 February 2012Global Sea Level Rise: Pothole To Speed Bump?
@Steve Case and KR A quadratic model is always going to have a better fit than a linear one. Adding more parameters to a model makes a better fit, but tells you nothing about whether the model is correct. Often one runs into trouble and starts modeling noise instead of signal (i.e. overfitting). KR makes a very good point about the short time frame, but some additional relevant questions are: 1) Is there a compelling reason to reject the simple model for the more complex model? There are statistical ways to deal with this, but just looking at it makes me think probably not. 2) As is the entire point of the post - what is driving sea level rise? We have good mechanistic explanations for the recent dip in sea level rise, which means much more than any statistical polynomial model. -
Global Sea Level Rise: Pothole To Speed Bump?
andylee - Take a look at the first 'Pothole' thread. There's a significant evidence from the GRACE mass detection satellites that indicate the current La Nina conditions (and high accompanying rainfall) have led to greater water concentrations on the continents, especially Brazil and Australia. And hence a short term decrease in the rate of rise. That short term variation, of course, will likely reverse over the next El Nino pattern. -
Rob Painting at 05:57 AM on 7 February 2012Global Sea Level Rise: Pothole To Speed Bump?
Steve Case - If ice melt has accelerated, and it has, then perhaps thermal expansion might have slowed in the last decade? Hansen (2011) has an interesting look at the thermal expansion aspect and his team's calculations show a rapid acceleration in sea level rise is likely this decade. -
andylee at 05:56 AM on 7 February 2012Global Sea Level Rise: Pothole To Speed Bump?
If most of the excess energy has gone into heating the oceans over the last few years then one would expect to see a little more sign of this in the graph. The only thing I can think of that would mask the heating of the oceans is if cold water was being heated from 0C to 4C, where its density would increase and volume contract. Once above water's anomalous density transfer function, a temperature vs sea-level correlation would be more apparent. -
Rob Painting at 05:45 AM on 7 February 2012Global Sea Level Rise: Pothole To Speed Bump?
Composer99 - those metaphors were chosen by NASA JPL - Josh Willis I think. They're well-established now and I happen to like them, so won't be changing. -
Daniel Bailey at 05:39 AM on 7 February 2012Global Sea Level Rise: Pothole To Speed Bump?
Sorry, KR, my comment above should have been more directed to readership in general than to you. Apologies. "I find it quite useful when someone comes along and (once again) provides a demonstration." Agreed. -
Global Sea Level Rise: Pothole To Speed Bump?
Daniel Bailey - I'm aware of the repetition of this particular cherry-pick, having been in some of those discussions. However, when discussing why cherry-picking short term noisy data is statistically a bad idea in science, I find it quite useful when someone comes along and (once again) provides a demonstration. -
Daniel Bailey at 05:24 AM on 7 February 2012Global Sea Level Rise: Pothole To Speed Bump?
KR, Steve has been prosecuting this very tiny cherry-red agenda for some time, on multiple threads. Each time he has been given correction such as yours, to no avail. It is yet another iteration of this: Or this:

-
Biophilia at 05:04 AM on 7 February 20122012 SkS Weekly Digest #5
I second Sapient Fridge's ideas in his/her first paragraph. -
Global Sea Level Rise: Pothole To Speed Bump?
Steve Case - Two points: * What is the quality of the polynomial fit versus a linear fit for this (fairly short) time period? You have not shown whether the polynomial is a better (more justified) fit. * Looking at longer term data indicates a clear acceleration of sea level rise: [Source - IPCC 2007, projections are for the SRES A1B scenario]
As this thread points out - you have to look at the broader picture, and include all of the relevant data. As opposed to, say, the short term noise.
[Source - IPCC 2007, projections are for the SRES A1B scenario]
As this thread points out - you have to look at the broader picture, and include all of the relevant data. As opposed to, say, the short term noise.
-
andylee at 04:57 AM on 7 February 2012NASA scientists expect more rapid global warming in the very near future (part 2)
Paul D@25, Exactly - I didn't want to patronize with long explanations! dawn and dusk was just a short way of describing the ring around the Earth where the sun is below the horizon, but the atmosphere is still illuminated, and indirectly heating the surface. Thus the fraction of the Earth receiving energy from the Sun would be slightly more than 50%. (I'm pretty sure we can discount earthshine from the moon from having any statistical relevance) -
Steve Case at 04:42 AM on 7 February 2012Global Sea Level Rise: Pothole To Speed Bump?
Whatever the case may be, global sea level rise will continue over the long-term because of the accelerating melt of land-based ice and continued warming of the oceans.So far that accelerating melt and warming hasn't caused sea level rise to accelerate. Here's Colorado University's data from their 2011 rel 4 plotted out with an Excel 2nd order polynomial trend line which shows slight deceleration:
-
Dikran Marsupial at 04:38 AM on 7 February 2012Global Warming: Trend and Variation
Fred Staples while sea level data are not my forte, I do know there are very good reasons why you can't get a good estimate of global sea levels from measurements from just one site. So perhaps you would like to explain what is so interesting about Tasmania, and why this is not just yet another example of cherry picking station data, whilst ignoring the bigger picture? -
Fred Staples at 04:10 AM on 7 February 2012Global Warming: Trend and Variation
If you want an idea of the increase in sea-level over the past 170 years, Google "John Daly Sea-Level" and look at the following: The 1841 sea level benchmark (centre) on the `Isle of the Dead', Tasmania. According to Antarctic explorer, Capt. Sir James Clark Ross, it marked mean sea level in 1841. Photo taken at low tide 20 Jan 2004. Mark is 50 cm across; tidal range is less than a metre. © John L. Daly. If the benchmark is difficult to see, try these. -
Composer99 at 03:59 AM on 7 February 2012Global Sea Level Rise: Pothole To Speed Bump?
If you don't mind the nitpick, speedbumps are used in streets & parking lots to slow down the speed of traffic, so the term appears to be used in an opposite sense from its denotation (where from context I assume speedbumps are unusual jumps in sea level rise while potholes are unusual drops). IMO crests & troughs (like waves in water) would be a better use of imagery, especially given the topic. -
DMCarey at 02:33 AM on 7 February 2012NASA scientists expect more rapid global warming in the very near future (part 2)
Is anyone aware of any published studies that explain the impact the projected cooling that the sun is expected to undergo within the coming decades will have on the 11 year solar cycle? Thus far I have only come across seperate articles mentioning them, and I'd be really interested to see how the one may impact the other -
Ken Lambert at 01:09 AM on 7 February 2012NASA scientists expect more rapid global warming in the very near future (part 2)
Rob #Original Post "Small fluctuations in the sun's output occur over a roughly 11-year cycle (peak-to-peak) and vary by as much as 0.25 watts per square metre(W/m2). This may sound sound small, but it's rather substantial when compared to Earth's energy imbalance - that is: the difference between energy (heat) entering and leaving Earth's atmosphere - the global warming-caused imbalance." Well Rob, when I started commenting on SKS, Solar was a lot smaller. When the warming imbalance was 0.9W/sq.m - Solar was only 0.13 +/-0.13 W/sq.m. Now its rather substantial. How can it be a contributor to global warming if it is a predictable cyclical variation which has always been there? Further this 'warming already committed but not yet manifest in surface temperatures' is somewhat misleading. The energy is already stored somewhere - expressed as increased ocean temperatures or phase change right now. All the temperature expression we have now is a reflection of cumulative past global energy gain or loss. Future warming can come only from future energy gain. -
muoncounter at 00:43 AM on 7 February 2012Water levels correlate with sunspots
This sounds like a bizarro world claim at best. TSI has a 1 month lag to temperature anomalies in FR2011 (and Lean and Rind 2008) and an 18 month lag due to ocean thermal inertia (Hansen). Now a 33 year lag? It's hard to credit a lag that's an integer multiple of the underlying 11 year cycle. -
Michael Whittemore at 00:37 AM on 7 February 20122012 SkS Weekly Digest #5
A link to a list of skeptical peer reviewed papers that have been found wrong or not up to scratch would be great. Have them in alphabetical order from the title of the paper (to make them easy to find). With a brief description of why they are not accepted. Then when you click on the paper there can be more detailed reasons with links to where on Skeptical Science the papers have been debunked. Even have them categorised, for example, sensitivity and proxy records. Deniers just keep on repeating the same papers and to be able to link them to a detailed rebuttal of the work would save a lot of time. -
Piet R. Zijlstra at 00:37 AM on 7 February 2012NASA scientists expect more rapid global warming in the very near future (part 2)
Dear Rob, Dear SkS team, I am now four months studying climate change. Next to attending David Archers lectures on climate science I could achieve the best learning curve at SkS. The year end summaries came just in time to get an overview. From now on this posting and the Hansen 2011 article will be the basis for next months study. Thanks, -
Delmar at 23:55 PM on 6 February 2012Renewables can't provide baseload power
Hydro can be a power source or energy storage system. For energy storage water is pumped from a low level dam to a high level dam when there is excess power, say with solar PV during the day, and then used to generate power in the evening by running the water back to the low level dam. Of course the measure for all energy storage systems is what percentage of the energy do you get back, and what are losses during holding. Hydro has very low holding lossess. You can store it for 12 months and only lose a little to evaporation and seepage. -
Fred Staples at 23:30 PM on 6 February 2012Skepticism About Lower Atmosphere Temperature Data
Your comment, Tom, repeats the regular comment at RC that the mid-troposphere satellite record is distorted downwards by stratospheric cooling, and that this cooling is the principal AGW signature. If you look at the HADAT charts, you will see that this cooling stopped after the last major volcanic eruption in 1994. From your weighting chart (repeating Roy Spencer), the stratospheric temperatures between 10 and 15 kms will affect the satellite readings. From the HADAT data, the overall cooling trends at these altitudes from 1958 to 2010 are: 9.13 Kms +1.27 degrees per century 11.74 kms - 0.28 degrees per century 13.5 Kms -1.02 degrees per century 15.75 Kms -2.26 degrees per century However, the data shows an absence of cooling after the mid-nineties. We can ask, therefore, how far back we must go from the present at these altitudes to detect a significant cooling trend. These are the answers: 9.14 Kms 19 years to significant warming 11.74 Kms 53 years 13.5 Kms 52 years 15.75 Kms 22 years So, Tom, if the effect you, and RC, cite so regularly exists at all, it can only ever have been marginal, (at 15 kms) and it ceased about 20 years ago. -
apiratelooksat50 at 22:57 PM on 6 February 2012NASA scientists expect more rapid global warming in the very near future (part 2)
Mods, Am I allowed to post an email from another person? If so what are the guidelines? ThanksResponse:[DB] You would need:
- Consent from them, either written or via email, that they agree to allow you to post the email on SkS
- To repost the message from them in it's entirety so context is preserved
- The email must not contain personal information of a sensitive nature
- The email must be on-topic to the post on which it is placed
- The email must be written to comply with the SkS Comments Policy
- The email must add to the discussion; i.e., it must provide information/context to the discussion on that thread not already covered prior to this, nor itself also not available via link to peer-reviewed, published literature (no anecdotal reposting of the science)
-
Esop at 22:28 PM on 6 February 2012NASA scientists expect more rapid global warming in the very near future (part 2)
#20: Excellent summary of denier excuses. One important thing to remember is that the deniers have painted themselves into a corner by predicting rapid cooling in the coming years/decades. There will no doubt be an effort to delete webpages with such statements, etc, so it would be wise to save as much of this info as possible. I have adviced local journalists (who can't print enough denier drivel, it seems) to take note of these cooling claims and then follow up on them around 2014. When the next El Nino comes around and the new global record is set, being able to point to the science predicting that, and then pointing out that the deniers forecasted the opposite will cause at least reasonable folks to open their eyes a little. Note that immediate cooling was the hot denier topic back in 2008 as well, and they could not wait until 09 and 10 rolled around with their predicted continuing cooling, proudly claiming the "La Nina excuse" could not be used anymore. It was the negative PDO that was the denier favorite back then. We all know what happened in 09 and 10, but the deniers got away with it despite their prediction being dead wrong. This is the sort of stuff that even an illiterate public will understand when pointed out to them, so when the next record is being set sometime from 2013 to 2016 we can't put enough emphasize on the (once again) failed denier cooling predictions. -
Sapient Fridge at 22:19 PM on 6 February 20122012 SkS Weekly Digest #5
Personally I'd prefer if there were a single page listing all the "skeptic" scientists and linking to a page for each one, in the same style as the "Climate myths from politicians" page. Doing it like that keeps it dry and avoids accusations of unprofessional attacks from SKS. I would also really like the short links to be available from the "Link to this page" selection of links e.g. http://sks.to/sun to be included in the "Link to this page" selection for http://www.skepticalscience.com/solar-activity-sunspots-global-warming.htm. The reason being that when answering misinformation on comment pages (e.g. the BBC) space is often a premium so the short links are really useful, but finding the appropriate link for an argument page is currently awkward. -
Paul D at 21:40 PM on 6 February 2012NASA scientists expect more rapid global warming in the very near future (part 2)
andylee@18 I'm not sure dawn and dusk really have any relevance since they are purely human perceived timing events at specific points on the globe. I get the point you make about the atmosphere, part of the suns rays are going to hit the surface and those rays on the periphery of the imaginary circular slice through the rays, will pass through the atmosphere. It is a continuous process as the earth revolves. There is no need to perceive any special case or moment in time. -
Rob Painting at 20:06 PM on 6 February 2012It hasn't warmed since 1998
Further to Tom Curtis' comments the image below is from Loeb (2012) and is the subject of an upcoming post: Note the 15 climate model simulations versus observations of the period in question.
But then fake-skeptics always focus on what they want to see and ignore the obvious - just like the GWPF:
Note the 15 climate model simulations versus observations of the period in question.
But then fake-skeptics always focus on what they want to see and ignore the obvious - just like the GWPF:

-
Tom Curtis at 19:25 PM on 6 February 2012It hasn't warmed since 1998
RonManley @168, climate models predict non-linear trends that still approximate to linear trends over short intervals (30 years or less). Therefore, the easiest test to falsify the climate model projections in the short term is does the temperature record depart significantly from a linear trend approximating to the model predictions over that short term. In order to falsify those projections, you would need to do two simple things: 1) Show that a statistically significant and robust short term trend lies outside the significance interval of a trend approximating to that of the predictions; and 2) Show that the assumed conditions of the projections in fact held over the period in question. Fake skeptics have repeatedly drawn attention to short term trends which are not statistically significant. What is more, they are not robust. The are not duplicated across all temperature indices (for instance), and they change significantly with small changes in start and end point. Therefore they have not shown (1). Never-the-less Foster and Rahmstorf jumped ahead and tested (2). They showed that conditions did vary significantly from those assumed by the model projections, due to the coupling of several strong La Ninas with an exceptionally weak period of insolation. Further, the showed that if you correct for those factors, the trend is well within the confidence interval of the projected model trends. The use of the linear trend in that context is unexceptional because of the hypothesis they were testing. -
RonManley at 19:07 PM on 6 February 2012It hasn't warmed since 1998
1. Is it perhaps time to update some of your graphs many of which end around 2007? 2. Do you not feel that the Foster and Rahmstorf analysis is compromised by the fact that they assumed a linear trend? ("The influence of exogenous factors will be approximated by multiple regression ... and a linear time trend"). They then derived the coefficients that came closest to that hypothesis. On my own web site for fun I've done a similar analysis for the period 1998 to 2011 and 'proved' that the trend is completely flat for that period. Adjusted temperature 1998 to 2011 -
Tom Curtis at 19:07 PM on 6 February 2012NASA scientists expect more rapid global warming in the very near future (part 2)
chirhphoros @23 your categories are non-exclusive, and significantly overlapping. Specifically, if a person stood at the edge of the Grand Canyon, and somebody deliberately pushed her to her death, proof "beyond reasonable doubt" that they pushed her, and did so with the intention of causing her harm would be proof beyond reasonable doubt that that person was guilty of murder. However, the push was neither a necessary nor a sufficient condition for the death of the victim. Necessarily it is just a small part of the causal chain leading to the victims death. Other parts include the force of gravity, the height of the drop, the lack of a safety rail, the lack of a safety net, and so on. Therefore the push was not sufficient for the death of the victim. Neither was it necessary for the victim could have stumbled, been accidentally bumped, or just had an embolism, and died even in the absence of the push. So, despite the classical development of the notion of causation as a necessary and sufficient condition for an event to occur, in actuality "causes" are only necessary if we exclude alternative non-realized scenarious, and if we include rigorous assumptions about what is reasonably expected (ceterus paribus clauses). Likewise they are only sufficient with similar assumptions about reasonable expectations. Further, the legal distinction of "beyond all doubt" is bizarrely (at least in Australian Jurisdictions) undefined and hence meaningless. Judges, under common law, are not permitted to direct the jury as to what level of probability constitutes beyond reasonable doubt, or in any other way define the phrase beyond its own words. Hence, by law it is an undefined and undefinable. And as a matter of logic, any term which is undefined and undefinable is strictly meaningless. In the end, it reduces to an emotional appeal to be as certain as you can be before recording a conviction, ie, to take your job seriously and to not convict lightly. Such a standard has no place in science. For myself I parse "beyond reasonable doubt" to mean that the evidence shows the conclusion with greater than 99% probability (necessarily subjectively estimated) and no reasonable hypothesis which, if true would mean the defendant is not guilty has been proposed as true and not refuted. Note that this is my personal definition, and by force of law not the actual definition, because by force of law it has no actual definition. However, it is obviously an absurd standard for science. In science it would mean that no hypothesis could be accepted even provisionally if there existed any alternative hypothesis that had not been refuted. In science, however, showing that Hypothesis A has a probability given the evidence, at least 20 times greater than the probability of Hypothesis B given the evidence is sufficient to provisionally reject B in favour of A. Provisionally, because all theories or laws in science are only ever provisionally accepted. (The 20 times is not a hard and fast rule. Nobody has ever sat down an legislated it. But it is a good rule of thumb.) Returning to the anomalies, look at the following very important graph: The Hot events are greater than 0.43 sigma, Very Hot greater than 2 sigma, and extremely hot, greater than 3 sigma. If you look at the graph, you can see that we now have events with a probability (assuming stationary climate) of 2.1% occurring around 20% of the time (area covered); and events with a probability (assuming stationary climate) of 0.1% occuring between 5 and 10% of the time, ie, between 50 and 100 times as frequently as they previously occurred. I haven't done the maths but that global warming is the cause of those events (all else being equal) seems well established.
The all else being equal, of course, just assumes a continuing pattern of El Ninos and blocking events, which are of course contributory causes to any particular heat wave.
The Hot events are greater than 0.43 sigma, Very Hot greater than 2 sigma, and extremely hot, greater than 3 sigma. If you look at the graph, you can see that we now have events with a probability (assuming stationary climate) of 2.1% occurring around 20% of the time (area covered); and events with a probability (assuming stationary climate) of 0.1% occuring between 5 and 10% of the time, ie, between 50 and 100 times as frequently as they previously occurred. I haven't done the maths but that global warming is the cause of those events (all else being equal) seems well established.
The all else being equal, of course, just assumes a continuing pattern of El Ninos and blocking events, which are of course contributory causes to any particular heat wave.
-
Tom Curtis at 18:14 PM on 6 February 2012Still Going Down the Up Escalator
RobertS @62, in that case his argument is nothing more than bait and switch. If he wanted to show poor interpretation of the (classical statistics) prediction interval of the regression, the proper Bayesian comparison was the credible interval of the regression as calculated by Dikran Marsupial. Remember that his conclusion was that "Users of classical statistical methods are too sure of themselves." He did not conclude that sometimes classical statistical results are sometimes misinterpreted. That is because he intended an assault on classical statistical methods per se, rather than occasional particular misinterpretations. What is more, if he is not simply misinterpreting the confidence interval of the regression for the confidence interval of the data, then his comparison is bizarre. The "confidence interval" of the regression using Bayesian methods would have been similarly narrow; and the confidence interval of the data using classical methods would have been almost as wide as that which he calculated using Bayesian methods, and indeed would have included 95% of the data used to calculate it. What is worse, if this is the basis on which he asserts classical confidence limits are too narrow, he has no basis for that assertion. That goes directly to the issue of the main post here. -
Michael Whittemore at 18:07 PM on 6 February 2012Water levels correlate with sunspots
WUWT is suggesting this is the reason for the rising sea levels we are seeing around the world. http://wattsupwiththat.com/2012/02/03/quantifying-sea-level-fall/ they even suggest that due to this correlation sea levels will decrease by 2050. -
heijdensejan at 17:43 PM on 6 February 2012It's the sun
There is a new paper out by Abdussamatov here, he is claims a total decrease in TSI of 6.8 W/m2 due to a decrease in the bicentennial activity of the sun. Of course this big decrease will cause a new little ice age etc. etc. Only problem I have is that I am not able to find anything on the "Bicentennial Decrease of TSI". -
chirhophoros at 17:09 PM on 6 February 2012NASA scientists expect more rapid global warming in the very near future (part 2)
Pirate @ 9 & Tom Curtis @10: Most inferences in science (apart from mathematics) relate to probability. In analysing data with public policy and especially legal implications , the language goes as follows: A caused B beyond reasonable doubt (the criminal test). On the balance of probabilities A caused B, ie, it is more probable than not that A caused B (the civil test). On the balance of probabilities A substantially contributed to B, ie, A need not have been the entire, largest, or even majority contributor to B. A needs only to have made a contribution which was large, more than trivial, not small, etc (a subtle refinement of the civil test). I'm curious how you would fit the issue of the anomalies into this framework. At any rate, thanks to RP for a very clear explanation of the Gaussian curve underpinning temperature. Do we have enough data to say that the current shift to the right is unprecedented? -
muoncounter at 15:06 PM on 6 February 2012Still Going Down the Up Escalator
RobertS#106: "some unobservable, unverifiable parameter like "slope" under the assumption that your straight line model is correct." In this case there are physical models and they predict a slope that is verified by the observables. -- source
So Briggs' argument hardly applies here. But 'unobserved observables'? Are they like known unknowns?
-- source
So Briggs' argument hardly applies here. But 'unobserved observables'? Are they like known unknowns?
-
RobertS at 14:30 PM on 6 February 2012Still Going Down the Up Escalator
Stephen Baines @74 "To imply it is a common mistake among those doing analyses of temperature patterns is downright puzzling." Is it? You make this very mistake in your comment @81: "If we have confidence that the slope parameter is positive, we can say confidently that temperature has increased." But it's not just you. It is incredibly common when looking for a change in some dataset, not just in climate science, to plot a linear regression and calculate a confidence interval with the hope of finding a small p-value so statistical significance can be claimed. This method, however, doesn't do what many think it does - all it does it reject some (often silly) null hypothesis for some unobservable, unverifiable parameter like "slope" under the assumption that your straight line model is correct. And because you're uninterested (at least explicitly) in seeing if your model can forecast skillfully, we don't know if it is even very good. Briggs argues that most people aren't actually interested in the uncertainty in unobservable model parameters, but the uncertainty in the unobserved observables - the temperature at places where averaging techniques (statistical models) attempt to predict, and where we don't have measurements (though theoretically we could). That's how I interpret what he's saying, anyway.
Prev 1284 1285 1286 1287 1288 1289 1290 1291 1292 1293 1294 1295 1296 1297 1298 1299 Next


