


 Arguments


Recent Comments
Prev 24 25 26 27 28 29 30 31 32 33 34 35 36 37 38 39 Next
Comments 1551 to 1600:
-
Rob Honeycutt at 03:58 AM on 30 May 2023Don’t get fooled: Electric vehicles really are better for the climate
definitelynotizume @47... Can you share what EV you have and more specific numbers related to your challenges?
-
definitelynotizume at 03:21 AM on 30 May 2023Don’t get fooled: Electric vehicles really are better for the climate
For me i have some relaiability issues for instance my EV battery does not do well in cold or hot temperatures and i cannot go far with it as it takes a long time to get chargred.
-
BaerbelW at 21:56 PM on 29 May 2023Animals and plants can adapt
Please note: the basic version of this rebuttal was added on May 29 and includes an "at a glance“ section at the top. To learn more about these updates and how you can help with evaluating their effectiveness, please check out the accompanying blog post @ https://sks.to/at-a-glance
We also moved the existing intermediate version to a new advanced version and then updated the intermediate version, so that now all three rebuttal versions exist for this myth.
Thanks - the Skeptical Science Team.
-
michael sweet at 05:02 AM on 27 May 2023What role for small modular nuclear reactors in combating climate change?
The Union of Concerned Scientists just published an article on problems with Moltex Energy's reactor. They find that there are severe problems reprocessing the fuel, large amounts of waste generated and proliferation problems. They want to use 2.5 tons of plutonium, purified from CANDU reactor waste, to startup the reactor.
Nuclear is too expensive and the materials do not exist.
-
BaerbelW at 04:09 AM on 26 May 2023Models are unreliable
Please note: the basic version of this rebuttal has been updated on May 26, 2023 and now includes an "at a glance“ section at the top. To learn more about these updates and how you can help with evaluating their effectiveness, please check out the accompanying blog post @ https://sks.to/at-a-glance
Thanks - the Skeptical Science Team.
-
michael sweet at 02:54 AM on 26 May 202310 year anniversary of 97% consensus study
John Kerry was quoted addressing the British Parliment as saying:
"“If you have five tipping points, and two of them involve the potential of metres, literally multiple metres, double digits of sea level rise, that’s as good a definition of catastrophe as you can achieve.
“And the reality is that that is where we are headed unless we do more about it. Now, why do I have this measure of optimism and of our capacity? Because it is within our capacity."
I thnk in addition to multiple meters of sea level rise there are other potential consequences of climate chnge that would qualify as "catastrophic". Perhaps we could make a list.
I saw a projection of a billion climate refugees or more under some conditions. For me that is way past catastrophic.
How many human deaths in one year , or cumulative, before it counts as catastrophic? Only one if it is a close friend or relative.
What conditions do others here think would count as catastrophic. Perhaps we could find a consensus, Undoubtedly we all have different conditions that have to be met for the problem to be catastrophic.
I remember when the IPCC AR5 came out in 2014 with a list of severe consequences. I wondered at the time if I would live to see sea level rise causing damage, widespread fire storms, heat conditions killing millions etc. I was 56 at the time and thought I would live another 30 years. Now, only 8 years later, we see these problems already happening around the world. I can only imagine what it would be like in 2100 if we do not take as strong action as possible immediately.
In my experience, persons who ask for definations of catastrophic want to minimize the actions we take to try to avoid the already begun catastrophic climate change.
-
scaddenp at 07:41 AM on 25 May 2023Antarctica is gaining ice
Just for clarification for other readers, as I pointed out above, Bart's conjecture "reduced sea ice mean more snowfall" is not expected given very low sea surface temperatures. To demonstrate that, Bart would need to show that precipatation varies in sync with sea-ice (which has both increased and decreased in recent history). By contrast, there is evidence for variations being due to multiyear weather cycles.
As to ice loss (overwhelmingly calving since most of Antarctica is too cold for melt), while the SAM is positive then continued basal erosion of the ice shelves is expected from warm deep water (eg see "The circum-Antarctic ice-shelves respond to a more positive Southern Annular Mode with regionally varied melting" ) and a useful summary here.Loss of ice shelves leads to increased calving (see here with its links to relevent papers) as does loss of sea ice. That is why my money is on continued ice loss despite some weather noise. Let's see what an El Nino will bring after three La Nina years.
-
Bart Vreeken at 19:51 PM on 24 May 2023Antarctica is gaining ice
Thank you very much, scaddenp #579
So text was just removed, which is very annoying! I wasn't sure if I had done anything wrong myself.
But indeed, a rising air temperature and reduced sea ice mean more snowfall and a higher Surface Mass Balance according to multiple models. The question is how that relates to the increased melting and calving along the edges. Nobody knows exactly, and therefore it's good to have a close look on what happens.
BL #577 "He's made a big thing about NASA's 149 Gt/yr value"
Huh ...? I simply changed the number, for it was wrong. Bob Loblaw was the one who kept talking about it. And yes, "it ignores all the data in between." But that's not what the discussion was about. Replacing the 'last-first' by 'regression' doesn't make it better, for that still ignores all the data in between.
Moderator Response:[DB] Hyperbole and sloganeering snipped. The commenter has recused himself from further participation here.
-
scaddenp at 12:51 PM on 24 May 2023Antarctica is gaining ice
Before Bart was moderated, he made some speculative comments about the contribution from loss of sea ice. At first glance this doesnt sound like something that would have a big effect. The ocean surface temperatures are still very cold so not a lot of scope of increased evaporative water content, especially compared to incursions of moist air due to positive SAM. However, this seems a very testable hypothesis since different parts of Antarctica would have different response to changes in air circulation, whereas arctic seaice has varied a lot (up and down) over past 20 years and if it was a factor, then expect precipation to vary accordingly (and in the regions where change happens).
-
Steve L at 08:07 AM on 24 May 2023It's cooling
I kind of feel like the global temperature escalator should be featured on rebuttals for every debunked argument against the increasing temperature trend.
-
scaddenp at 07:54 AM on 23 May 2023Antarctica is gaining ice
"Nobody knows.." Hmm. Certainly investigated. See "Interannual ice mass variations over the Antarctic ice sheet from 2003 to 2017 were linked to El Niño-Southern Oscillation"
Shows correlation of AP and WAIS with ENSO and anticorrelation of EAIS.

Hmm. ok, only 2017. What about GFO and recent records. There is some detailed analysis in "Spatially heterogeneous nonlinear signal in Antarctic ice-sheet mass loss revealed by GRACE and GPS (2023)"
and another study of links with other quasi-periodic cycles in Antarctica in "Antarctica ice-mass variations on interannual timescale: Coastal Dipole and propagating transports"
Evidence to date - based on correlations of where the changes in ice mass are occurring - links interannual change to short term (2-8 year) quasi-periodic weather cycles (ENSO, Antarctic Circumpolar Wave, Antarctic Occillation) influencing Antartica.
My money (literally) would be on continued long term ice loss. Short term variation as observed here to date would certainly NOT be a reason for change in climate mitigation policy.
-
Rob Honeycutt at 04:37 AM on 23 May 2023Antarctica is gaining ice
Bart... It would incumbent upon you to put forth a physical, testable hypothesis and then do the work to validate it. Speculations aren't really useful without some hard data.
Moderator Response:[BL] In terms of hard data, Bart has not advanced anything new in the way of analysis since March. He's made a big thing about NASA's 149 Gt/yr value, presenting his own calculation of 114 Gt/yr.
...but that calculation uses the start and end points from February 2003 to February 2023. That is not an appropriate way to do a trend analysis - it ignores all the data in between.
A first approximation of the overall trend is a linear fit. If we take the GRACE data starting in October 2002 (where the zero relative mass value originates), we can compare the "last minus first" approach with a linear regression. If we repeat this calculation for each time in the time series, we can plot the two calculations as a function of the last time in the calculation and see how that evolves over time.
This is what we get:
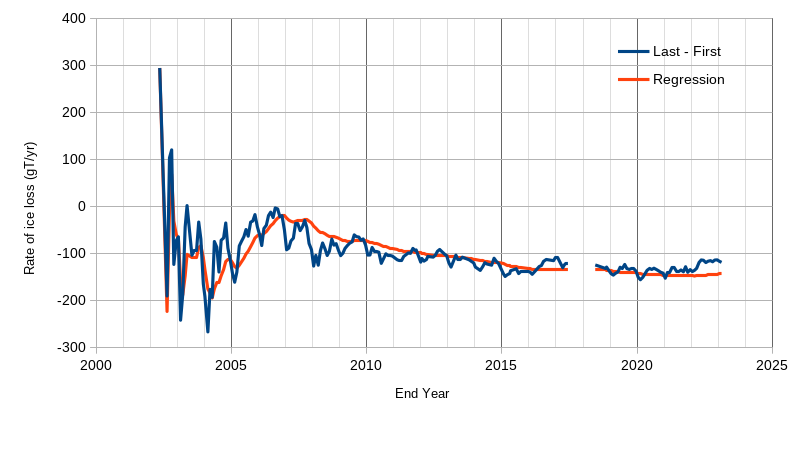
As expected, in the early times the noisy signal gives us a lot of variation in the "average" loss rate. Over time, the two values stabilize, but the "last minus first" approach is always more influenced by noise. The regression results become quite stable, and the last 2-3 years of higher mass have little effect on the regression slope. The "last minus first" approach creates a noticeable rise not seen in the regression slope (which uses all the data).
We can see this better if we zoom in on the last three years:
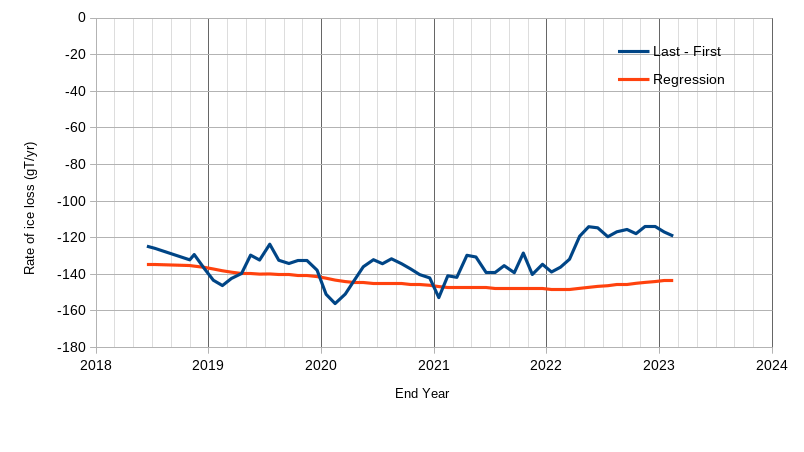
With calculations done each month, we can see somewhat of an annual cycle in the "last minus first" calculation, but this largely vanishes in the regression analysis. Bart's "interesting" rise in 2022-2023 results does not look much different from previous noise in the signal.
-
Bart Vreeken at 01:41 AM on 23 May 2023Antarctica is gaining ice
"Are you suggesting the most recent changes in ice mass are indicative of a substantive change in the trend? And if so, what do you think is driving such a change?"
That might be, yes. The driving force could be the low amount of sea ice, and the rising temperatures. Both of them can produce more snowfall. The question is: how will the discharge of the ice along the edge of the ice sheet react? And how is the balance between these two? Of course, things can be less positive when the climate change goes on. More precipitation can fall in the form of rain than, and the discharge can overrule the gain of ice again. Nowbody knows, that's why it's so interesting to have a close look on what happens.
 Moderator Response:
[BL] Speculation snipped - "might be" and "nobody knows" is a concrete indication that you are engaging in pure speculation again. Again, you are contributing nothing that has not been said before. It was not "interesting" in March, and it is not "interesting" now.
-
Rob Honeycutt at 01:16 AM on 23 May 2023Antarctica is gaining ice
@571... "The amount of ice above the previous trend will first have to melt away again."
Come again? Would like to explain that?
Moderator Response:[BL] Bart appears to think that the processes that have decreased Antarctic ice mass by 2500 Gt in the last 20 years will have some sort of difficulty in removing 330 Gt that have accumulated in the past three years.
-
Rob Honeycutt at 01:11 AM on 23 May 2023Antarctica is gaining ice
You seem beligerently intent upon missing the forest for the trees, Bart.
Let's put it this way: Are you suggesting the most recent changes in ice mass are indicative of a substantive change in the trend? And if so, what do you think is driving such a change?
-
Bart Vreeken at 00:23 AM on 23 May 2023Antarctica is gaining ice
'Accusing NASA of cherry-picking, when they used what was probably all the available data at the time the analysis was done - and then claim that your analysis also ending in February is not cherry-picking because it is "all the available data", is hubris.'
Please have a better look.
- The data of the analysis by NASA run up to August 2020, but the last part is not used
- The data of my analysis starts and ends in February, so there is no seasonal effect.
Moderator Response:[BL] and it was explained back in March that the 149 gT/yr came from picking the maximum and the minimum. You can question that methodology, but accusing people of "cherry-picking" is an accusation of dishonesty.
Do you understand?
-
Bart Vreeken at 18:44 PM on 22 May 2023Antarctica is gaining ice
There is something wrong with the link above. It should be:
climate.nasa.gov/climate_resources/265/video-antarctic-ice-mass-loss-2002-2020/
-
Bart Vreeken at 18:39 PM on 22 May 2023Antarctica is gaining ice
"Where the 149 Gt/yr number comes from was discussed in March"
OK, let's have a look at the discussion in March. The 149 Gt/yr number comes from a video by NASA, published April 1, 2021.
https://climate.nasa.gov/climate_resources/265/video-antarctic-ice-mass-loss-2002-2020/
The selected data runs from October 2002 (+65 Gt) to February 2020 (-2808 Gt). That's already cherry-picking, for the ice mass tends to be low in February. Why do so? Maybe the publication date gives a hint ;-).
But ignoring the last two years, like Bob Loblaw does, is even more cherry-picking. This is how it looks like:

Is it also cherry-picking to end in February 2023? Not really, for it includes all the available data. Maybe we have a relatively high amount of ice now, according to the trend. But we won't know until afterwards. And remember that these are cumulative data. The amount of ice above the previous trend will first have to melt away again. That makes this figure different from a figure in which the temperature is displayed.
Moderator Response:[BL] Accusing commenters here of cherry-picking, when all they are doing it trying to explain how the NASA numbers were determined by NASA, is a violation of the comments policy. The numbers that went into the 149 gT/yr value were clearly stated last March in comment #540.
No accusations of deception. Any accusations of deception, fraud, dishonesty or corruption will be deleted. This applies to both sides. You may critique a person's methods but not their motives.
Accusing NASA of cherry-picking, when they used what was probably all the available data at the time the analysis was done - and then claim that your analysis also ending in February is not cherry-picking because it is "all the available data", is hubris.
Your argument about how the last few years changes the trend results was addressed in comment # 543, last March.
Once again, you are attempting to attribute great significance to short-term noise.
You are adding nothing new to the discussion. Repeating arguments without addressing the counter-arguments falls under the sloganeering category in the Comments Policy.
No sloganeering. Comments consisting of simple assertion of a myth already debunked by one of the main articles, and which contain no relevant counter argument or evidence from the peer reviewed literature constitutes trolling rather than genuine discussion. As such they will be deleted. If you think our debunking of one of those myths is in error, you are welcome to discuss that on the relevant thread, provided you give substantial reasons for believing the debunking is in error. It is asked that you do not clutter up threads by responding to comments that consist just of slogans.
If you continue to simply re-assert opinions with no substantive argument, expect to see your comments deleted.
[BL - added] Attributing the 149gT/yr number to a commenter (me) that simply demonstrated the source of the number is scientific malpractice. Such dishonesty will not be tolerated here.
-
Rob Honeycutt at 09:57 AM on 21 May 2023Antarctica is gaining ice
Bart @568... Wrong answer. Clearly all the red notations are your modifications, thus an unwary viewer might assume those notations are coming directly from NASA when they are not.
-
Bart Vreeken at 05:44 AM on 21 May 2023Antarctica is gaining ice
"Where the 149 Gt/yr number comes from was discussed in March"
OK, let's have a look at the data of IMBIE, then. IMBIE is the Ice Sheet Mass Balance Inter-comparison Exercise. They compare data from different sources: gravimetry, altimetry, input-output.
essd.copernicus.org/articles/15/1597/2023/
There, the average number over April 2002 - December 2020 is 114,9 Gt/Yr. Very much like my calculation, but without the data of 2021 and 2022.
 Moderator Response:
[BL] Once again, you are following the same path you followed in March. Instead of explaining what the source of your figures and numbers and results are the first time you post them, you are forcing people to ask questions, guess at the meaning of your material, speculate on how values are derived, etc. Only then do you provide relevant details.
For the final time, read the Comments Policy. In this case, the section that applies is:
No link or picture only. Any link or picture should be accompanied by text summarizing both the content of the link or picture, and showing how it is relevant to the topic of discussion. Failure to do both of these things will result in the comment being considered off topic.
If you post any further images without a clear indication of what modifications you have made and the source of any data you present, or comments that lack clarity, they will be considered off topic and deleted.
And again, like you did in March, you are jumping from GRACE to mass balance, to whatever pops up in your head next., Take the time to prepare one comprehensive and coherent comment, instead of a bunch of small scattered ones.
-
Bart Vreeken at 04:18 AM on 21 May 2023Antarctica is gaining ice
Hi Rob Honeycutt @567, there is no modification at all on the original graph from NASA itself. You can find the source below:
climate.nasa.gov/vital-signs/ice-sheets/
I only added the exact month of some of the extremes. And as you can see, I made my own calculation of the 'rate of change', with a very different result. Its calculated over 20 full years since February 2003, to avoid seasonal effects. (2280 Gt / 20 = 114 Gt/y). Where the 149 Gt/y published by NASA comes from, I really don't know. In the previous version it was 151 Gt/y.
Moderator Response:[BL] "There is no modification" and "I have only added" are mutually contradictory claims. This does your credibility no good.
Where the 149 Gt/yr number comes from was discussed in March. Please read over the older discussion before posting again.
-
Rob Honeycutt at 03:30 AM on 21 May 2023Antarctica is gaining ice
Bart @566... When posting a graph like this it would be wise and honest to make a clear notation clarifying it is a modification of the original graph from NASA, citing yourself as the source of the modifications. Otherwise you're misleading people to believe the modifications come directly from NASA.
Moderator Response:[BL] Indeed.
In particular, Bart's graph in comment # 566 has crossed out the value 149 Gt/yr and replaced it with 114 Gt/yr. The 149 is from NASA, and the 114 is from Bart. The difference between those two values was discussed in March, when Bart first introduced the 114 number in his first comment on this thread (#533). The 149 Gt/yr value is explained in the comments that follow.. I had linked to a site with GRACE data in comment 534, and explained the 149 Gt/yr number in comment #540.
If Bart is hoping that the previous discussions on this matter will be forgotten, he is wrong. If he is hoping to be able to post the same claims he made in March, without reflecting on the counter-arguments that were made then, he is wrong. He should in particular read the section of the Comments Policy on excessive repetition:
Comments should avoid excessive repetition. Discussions which circle back on themselves and involve endless repetition of points already discussed do not help clarify relevant points. They are merely tiresome to participants and a barrier to readers. If moderators believe you are being excessively repetitive, they will advise you as such, and any further repetition will be treated as being off topic.
-
Bart Vreeken at 18:50 PM on 20 May 2023Antarctica is gaining ice
 After three months, there is another update of the gravitational measurements of the Antarctic ice sheet. The series now runs until February 13, which includes most of the Antarctic summer. Often in February there is a minimum in the amount of ice, but the pattern is not very tight.
We still see that Antarctica as a whole has a better period. Over the last three years, there has been no net decrease in land ice. The small amount of sea ice must play an important role in this. As a result, more snow falls. Apparently, that was enough to compensate for the increased melting and calving along the edge.
Changes to the floating ice shelves cannot be measured in this way.Moderator Response:[BL] Back to this again, with three months more noise to add to the end of the longer-term trend?
Once again, you are rambling and failing to make a clear explanation of what you expect people to see. The latter part of your comment (marked as "warning") is an assertion of highly speculative, unsupported statements made before.
If your intention is to return to previous posting patterns, expect to see strong moderation of your comments.
Please note that posting comments here at SkS is a privilege, not a right. This privilege can be rescinded if the posting individual treats adherence to the Comments Policy as optional, rather than the mandatory condition of participating in this online forum.
Please take the time to review the policy and ensure future comments are in full compliance with it. Thanks for your understanding and compliance in this matter.
-
nigelj at 06:56 AM on 19 May 2023‘It’s gotten really ugly.’ A community of freedom-lovers squares off against climate change in the Arizona desert
Reminds me of this commentary "How a New Hampshire libertarian utopia was foiled by bears:"
It really happened, its amusing, and says something about the unintended consequences of 'libertarianism.'
-
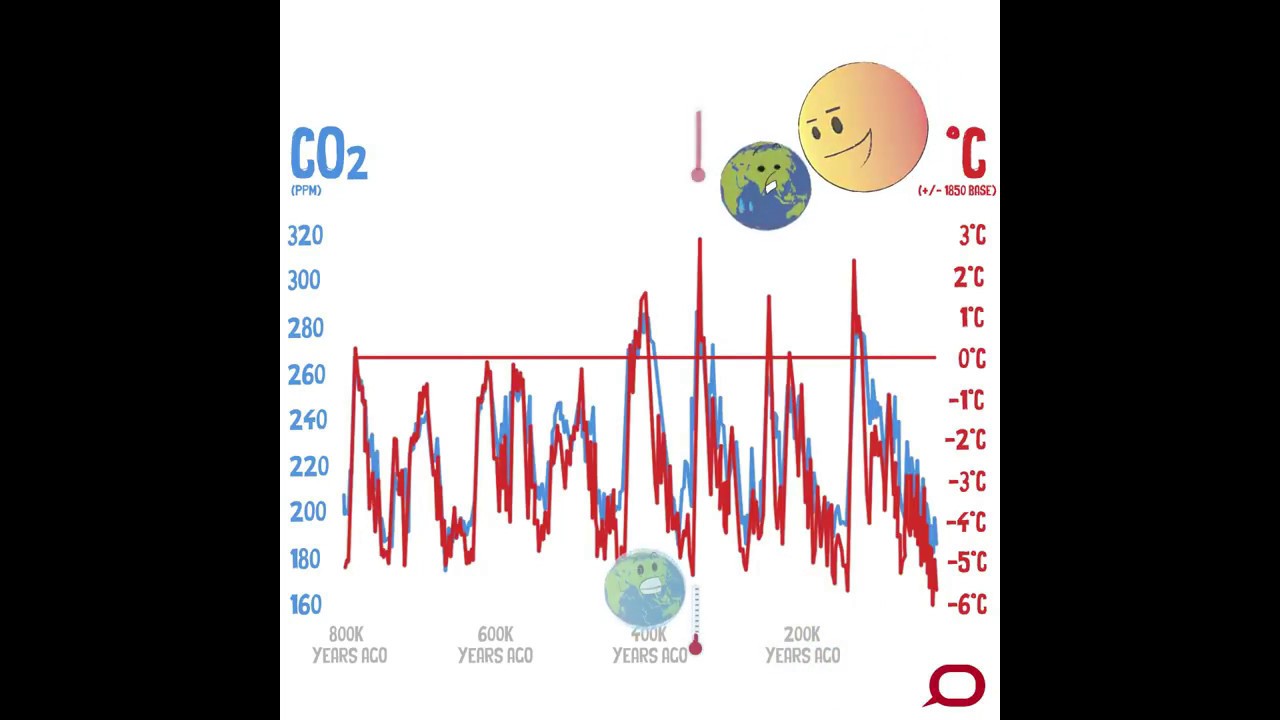
Ron at 03:18 AM on 19 May 2023CO2 lags temperature
Thanks Bob. I was just looking for something clearer. Don't really like the presentation on the intermediate and advanced tabs (forgot about those tabs, btw). Something with the lines closer together and the association clearer. With the lines colored and over each other. Thanks for your and other's efforts.
I did see one that made me gasp that blamed it somehow on jupiter and dust. Huh?
-
Bob Loblaw at 01:46 AM on 19 May 2023CO2 lags temperature
Thanks, MAR. I see that the story at The Conversation mentions one of the references linked in the Intermediate tab of this post (Parrenin et al, 2013).
-
Daniel Bailey at 01:46 AM on 19 May 2023CO2 lags temperature
For a longer view of the correlation between CO2 concentrations and global temperatures, look no further than this reconstruction of the past 540 million years of such from Scotese (Scotese 2021 - Phanerozoic paleotemperatures: The earth’s changing climate during the last 540 million years):

Link to paper
And leaving the last word on the subject to Scotese, a true expert in the field:
"It has been long recognized that the Earth’s climate, in particular the average global temperature, has alternated between ”icehouse” and “hothouse” states. More than 70 years ago, studies recognized that these climatic “modes” varied on short-term, medium-term, and long-term timescales. During the past 20 years, due to much outstanding research, we now stand at the threshold to a deeper, more complete understanding of both the tempo and mode of global temperature change during the Phanerozoic.
The Earth’s long-term temperature change is controlled by multiple tectonic and environmental processes that drive the Earth’s climate from icehouse to hothouse conditions, and vice versa. Many of these factors are interconnected by a complex network of positive and negative feedback loops that can accelerate or decelerate changes in long-term global temperature.
We are currently about halfway through a typical glacial/interglacial cycle. If humans did not inhabit the Earth, about 20,000 years from now, global temperatures would have once again begun to fall and ice sheets would have expanded into the oceans surrounding Antarctica and would have descended from the Arctic to begin a slow and steady march across the northern continents. However, this will not happen. The Earth has entered a “super-interglacial”. The injection of CO2 into the atmosphere as a consequence of the burning of fossil fuels has warmed the Earth more than 1°C and will continue to warm the Earth for another 300 years (~2300 CE).
In conclusion, we are leaving our Ice Age heritage behind. A new, warmer world awaits us. The problem we face is not so much where we are headed, but rather how we will get there."
-
MA Rodger at 01:20 AM on 19 May 2023CO2 lags temperature
Bob Loblaw @649,
The third of the graphics linked-to by Ron @647 (below) is sourced here and does have referenced sources.
-
Bob Loblaw at 23:27 PM on 18 May 2023CO2 lags temperature
Ron @ 648:
I am not sure exactly what you are looking for, or what you want to compare. The post here (check out all three of the basic, intermediate, and advanced tabs, plus the extra information that is posted below the comments) talks about some of the complexities of comparing ice core CO2 data to temperature. There is also a good post here at SkS about ice core data.
Ice core "temperature" is not global - it's more local or regional, as it is based on oxygen isotope ratios in the core. This is affected by the temperature at which the precipitation is formed. See this page or this page for more details. When comparing CO2 and temperature, careful consideration of the source of temperature data is needed in order to assess the meaning of the comparison. In addition, estimating age in ice cores involves complexities of glacial flow, how long it takes gas to get trapped, etc.
The figures you link to do not mention the data sources used. The OP here lists some data sources, but unfortunately it looks like some of the links are broken. A quick search finds sources for Dome C data here and here. Those pages include links to other pages, graphs, and original studies. Depending on just what sort of comparison you are trying to do (especially if it is statistical), you may be best off finding original data and making your own graph. At least then you know exactly what data you are getting.
The Intermediate tab here also has a section pointing out that later studies have revised some of the timing interpretations of the ice core data. Read down to section 4 "This myth is based on old data".
-
Ron at 10:48 AM on 18 May 2023CO2 lags temperature
Was there a graph included with the 800,000 yr study? Just want an easy to compare and valid one that I can use.
-
Ron at 10:38 AM on 18 May 2023CO2 lags temperature
Hi Bob. SkS (SkepticalScience?) ;) Yes, I guess that SS has some bad connotations to it. Sorry.
There seem to be a lot of graphs out there. Like this one one, or this one. I was thinking of something closer together like this one.
-
nigelj at 06:38 AM on 18 May 202310 year anniversary of 97% consensus study
Polling by Pew Research on American scientists attitudes to the climate issue. (Appears to be all scientists not just climate scientists)
".....And 77 percent of scientists said climate change is a very serious problem......"
So quite a strong majority of scientists think climate change is a very serious problem.
-
Bob Loblaw at 06:36 AM on 18 May 2023CO2 lags temperature
Ron @ 645:
Although the Basic tab shows a Vostok ice core that only covers 400,000 years (the limit available at that station, according to Wikipedia), the Intermediate tab of this article includes another station (Dome C) with an 800,000-year record. Is that the graph you are thinking of?
https://skepticalscience.com/co2-lags-temperature-intermediate.htm

P.S. The preferred abbreviation for Skeptical Science is SkS. Three guesses for why. (First two guesses don't count.)
-
Ron at 05:40 AM on 18 May 2023CO2 lags temperature
Hi SS. You have a graph showing the relation between Co2 and Temperature going back 400,000 years, but I'm wondering if you can insert the one that goes back 800,000 years?
-
John Mason at 03:11 AM on 18 May 202310 year anniversary of 97% consensus study
Yes Bob - so it proved. Made the beer taste especially good at - I think because it was a while back - the Braunschweiger Hütte. The next day on the Otztaler Wildspitze was a cracking one, despite most of the party being a tad hungover to start with. High mountains magic. Sorry to take this even further O/T: just revisiting memories!
-
Bob Loblaw at 00:29 AM on 18 May 202310 year anniversary of 97% consensus study
John Mason @ 20:
It sounds to me like you were only caught in a "potentially catastrophic" situation. Since nothing bad actually happened, then obviously it would be pointless in the future to avoid being out on glaciers during lightning events, or running quickly down glaciers with deep crevasses.
(Where is that html sarcasm tag???)
-
Bob Loblaw at 00:20 AM on 18 May 202310 year anniversary of 97% consensus study
To borrow a contrarian meme, "one more nail in the coffin" of Gordon's quest "to find out what percentage of climate scientists believe that global warming will be catastrophic."
The study referenced in the OP is not a survey of "what scientists believe". Skeptical Science has a longer post on the 97% consensus theme. The Cook et al (2013) study is just one of the papers discussed there, and this is how it is described (including a link to the paper itself):
A Skeptical Science-based analysis of over 12,000 peer-reviewed abstracts on the subject 'global climate change' and 'global warming', published between 1991 and 2011, found that over 97% of the papers taking a position on the subject agreed with the consensus position that humans are causing global warming. In a second phase of the project, the scientist authors were emailed and rated over 2,000 of their own papers. Once again, over 97% of the papers taking a position on the cause of global warming agreed that humans are causing it
Note that the study looked at the abstracts of published papers. And in a second phase, the study did not ask scientists "what they believed" - they asked authors of papers to rate the papers they had written.
That Gordon confuses reading the literature with "asking what someone believes" tells us more about Gordon than we probably need to know.
If Gordon seriously wants an answer to his "catastrophic" question, along the lines of the study done by Cook et al (2013), there is an obvious solution:
Read the scientific literature
-
John Mason at 11:32 AM on 17 May 202310 year anniversary of 97% consensus study
I suppose when it comes to catastrophic, lightning could be cited as an example. I've been caught way back in my youth in severe electrical storms high up in the European Alps. I recall one occasion when a multi-channel CG strike hit the large glacier I was descending, some 100 metres away - far too close for comfort. Even the guide I was with was freaked out. Memorable, as readers might well imagine. Nevertheless it would only have been catastrophic if it had instead grounded through either (or both) of us. We ran the few miles to the hut from that moment - it was a long glacier - thereby risking the further catastrophe of both of us dropping down a hidden crevasse simultaneously. I don't know, because we escaped both fates, which catastrophe would have been worse!
-
Bob Loblaw at 11:17 AM on 17 May 202310 year anniversary of 97% consensus study
Also note that Gordon has taken his "definition" quote from the Positives and negatives of global warming post. He linked to the advanced tab in comment 6, and I have now linked to the basic version three times (including this comment).
Gordon has absolutely no justification in ignoring that post, where the consequences are laid out in detail. If he disagrees with those consequences - either that they won't happen, or that they are not bad - then he needs to go to that thread and discuss them there.
If Gordon continues to post off-topic here, there will be consequences. (He can read the Comments Policy to find out what they are.)
-
Bob Loblaw at 11:08 AM on 17 May 202310 year anniversary of 97% consensus study
In spite of being given a definition of "definition", Gordon @ 16 still fails to provide his definition of "catastrophic".
The quote he has provided, and doubled-down on, says "...the consequences of 4C being potentially catastrophic".
So, we are back to word games. Let's start with the first key word - consequence:
consequence (plural consequences)
- That which follows something on which it depends; that which is produced by a cause.
- A result of actions, especially if such a result is unwanted or unpleasant.
I'm warning you. If you don't get me the report on time, there will be consequences. - A proposition collected from the agreement of other previous propositions; any conclusion which results from reason or argument; inference.
- Chain of causes and effects; consecution.
- Importance with respect to what comes after.
- The power to influence or produce an effect.
- (especially when preceded by "of") Importance, value, or influence.
So, clearly it is not the 4C that is catastrophic, - it is (as Eclectic has pointed out), what comes along with the 4C. And Gordon has utterly. completely failed to provide any constructive input on just what those consequences are. He even uses the phrase "..the environmental effect of..." as a substitute for "consequences", without ever actually specifying what those effects would be.
Second important word: potential.
potential (countable and uncountable, plural potentials)
- A currently unrealized ability (with the most common adposition being to). Even from a young age it was clear that she had the potential to become a great musician.
- (physics) The gravitational potential: the radial (irrotational, static) component of a gravitational field, also known as the Newtonian potential or the gravitoelectric field.
- (physics) The work (energy) required to move a reference particle from a reference location to a specified location in the presence of a force field, for example to bring a unit positive electric charge from an infinite distance to a specified point against an electric field.
- (grammar) A verbal construction or form stating something is possible or probable.
Note definitions 1 and 4. Note the use of "unrealized" and "possible or probable". We are talking here about risk. The "definition" that you have given for "catastrophic" is simply stating that the consequences (of something) are potentially catastrophic.
Your "question", Gordon, is still just as poorly specified as it was in your first comment on this thread,. Since you refuse to say what consequences (or effects) you want people's opinion on, you are asking a meaningless question.
And it is still off-topic for this thread. Go to this one, read it, and pose your questions there. But do not simply triple-down on your useless version.
-
John Mason at 11:02 AM on 17 May 2023At a glance - The 97% consensus on global warming
@ NigelJ - thanks. At a glance are always ideally <500 words that can be read e.g. when you have phoned that utility company and are waiting for an actual human to answer while the tinny music plays on - in fact my experience of the utilities of late is that I could get through a dozen of them. The longer ones (this one's around 700 words) occur either when something has been so slagged off by the opposition that it deserves fuller explanation at all levels - OR when said opposition has picked an obscure and complex topic with which to make word-salad, so lots of first principles have to be explained. In summary - there's no one typical climate myth. Each has to be treated on its anti-merits!
-
Eclectic at 09:58 AM on 17 May 202310 year anniversary of 97% consensus study
Gordon ~ regarding Dana Nuccitelli, it's all a matter of context.
Easy to see when "catastrophic" is being used as a deflection / strawman that is being shouted (to abort rational thinking).
Catastrophic is defined by the effect (not the absolute temperature e.g. 4 degrees rise). As I am sure you know very well, Earth's surface temperature was above that 4 degC level in the distant past ~ but then there was much more carbon in the biosphere. Nowadays . . . not so much carbon "available", but the biosphere is far less resilient against rapid warming (in large part, thanks to the presence of 8+ Billion humans ~ and many of whom live in poverty already).
Your question about % of scientists "believing" in catastrophic probabilities, is a question that is moot. It is a question that is designed (consciously or otherwise) to deflect thought away from the practicalities of our current situation. Or to deflect from the 97% topic?
-
Gordon at 09:01 AM on 17 May 202310 year anniversary of 97% consensus study
Bob @12 & 13,
I would prefer to refer to the Skeptical Science definition of catastrophic, that being a the environmental effect of a greater than 4°C temperature rise. We could also ask Dana Nuccitelli (a regular cotributor here) what his definition was when he wrote:
Climate contrarians will often mock 'CAGW' (catastrophic anthropogenic global warming), but the sad reality is that CAGW is looking more and more likely every day.
(Eclectic, is Dana just shouting a slogan here ?)
My original question was what percentage of climate scientists today believe that global warming will be catastrophic ? Given that the IPCC now believes that RCP8.5 has a low likelyhood of occuring, the chances of a greater than 4°C warming along with the prophesied catastrophic effects seem unsupported.
-
Eclectic at 08:25 AM on 17 May 202310 year anniversary of 97% consensus study
Scaddenp @14 ,
Very droll. And on target. As well as anything causing "change".
Many of them use the same catastrophic ideation about taxation & governments . . . except when the guvmint supplies services to *me*
-
scaddenp at 07:50 AM on 17 May 202310 year anniversary of 97% consensus study
I thought the working definition of "catastrophic" for deniers was "something that would force me to pay more tax"
-
nigelj at 05:35 AM on 17 May 2023At a glance - The 97% consensus on global warming
Incredibly well written, informative, accurate explanation. A delight to read. Although I still have some trouble reconciling "at a glance" with quite a long explanation.
-
Bob Loblaw at 00:19 AM on 17 May 202310 year anniversary of 97% consensus study
To avoid further distractions on this thread, it is worth noting that the studies mentioned are addressing the question of the cause of recent warming (roughly, over the past century). There are three implications in this:
- The global climate has warmed over the last century.
- The warming is not just "random variation" - it has been caused by something.
- Increases in atmospheric CO2, from human activity, are the major cause.
Three contrarian "talking points" are discounted by these studies:
- The "it's not happening" position in wrong.
- The "it's not us" position is wrong.
- The "there is lots of disagreement on 'it's not us'" is wrong.
Gordon's misdirection on "catastrophic" suffers from at least two problems:
- The studies look at what the literature says about the cause of climate change up to the present date, with no consideration of the good/bad nature of those changes.
- The studies do not examine what the literature predicts will happen in the future, or whether that will be good/bad.
Gordon is following the expected contrarian path. Having failed on the 'it's not happening" and "it's not us" arguments, the expected third stage is well under way: "it's not bad". That, too, is an extremely weak position, and few climate scientists exist that hold that position.
-
Bob Loblaw at 23:07 PM on 16 May 202310 year anniversary of 97% consensus study
Gordon can't or won't provide a definition of "catastrophic"? I'm shocked, I tell, shocked.
Maybe he does not know the definition of "definition". Here it is, from Wiktionary:
(semantics, lexicography) A statement of the meaning of a word or word group or a sign or symbol (dictionary definitions).
Your definition of "elephant" needs to be more precise than "a big animal with large ears".
While I am at it, let's look at "catastrophic" (also from Wiktionary):
catastrophic (comparative more catastrophic, superlative most catastrophic)
- Of or pertaining to a catastrophe.
- Disastrous; ruinous.
- From which recovery is impossible.
catastrophic failure
At which point we may as well add "catastrophe":
catastrophe (plural catastrophes)
- Any large and disastrous event of great significance.
- (insurance) A disaster beyond expectations.
Still rather general - losing one's house in a flood may be catastrophic for the people living in that house, but is not catastrophic for another person half way around the world.
...but such vagueness is a feature for Gordon, not a bug. By avoiding his own definition, he gets to use it as a "slogan for shouting" (to use Eclectic's words). He gets to avoid any real discussion of the implications of warming, can repeatedly take positions such as "I don't think that is catastrophic" without saying what he thinks is catastrophic, and just use the slogan as an attack on the significance of the studies mentioned in this blog post.
Gordon is introducing "catastrophic" as a red herring. He is engaging in misdirection (Look, squirrel!):
misdirection
- An act of misleading, of convincing someone to concentrate in an incorrect direction.
The magician used misdirection to get us to watch his left hand while he did something with his right hand.
...and just in case anyone does not know what a squirrel is (it's not just "a small animal with small ears"):
squirrel (plural squirrels)
- Any of the rodents of the family Sciuridae distinguished by their large bushy tail.
Any further discussion of whether or not global warming is bad should probably go on this thread:
-
Eclectic at 23:03 PM on 16 May 202310 year anniversary of 97% consensus study
Michael @10 ~ yes, points taken.
But the question of time scale : that's probably best viewed by the usual legal yardstick of "reasonable" ~ that which would be reasonably expected over a reasonable timespan in reasonably predictable circumstances, as viewed by a reasonable person (or better, by a reasonable climate scientist). Does that sound reasonable?
A future sea level rise of 1 meter has been closely estimated as displacing around 230 million people. Presumably a rise of 2 meters would displace well over twice that number, and would destroy a far greater amount of fertile farmland into the bargain. Perhaps not a problem if occurring over 2,000 years ~ but not-quite-unbearably-catastrophic if occurring over the more reasonably likely timespan of 200 years.
In short, the term "catastrophic" is nearly useless.
Beg to differ on (your) suggestion of catastrophe definition by dollar scale. Too much room for endless wrangling there, whether the figures be $10 Trillion or $50 Trillion or $500 Trillion (not to mention if these figures are additional costs or partly-substitute costs +/- dependence on future unknowable technologies). Besides, oooooodles of zeros can have a stultifying effect on the average mind [such as mine].
Dollar scale is inferior to scale by Deaths & Displacements & Destroyed farmlands.
-
michael sweet at 22:26 PM on 16 May 2023EPA’s car pollution rules would save Americans trillions of dollars
Nigelj,
I have seen many comments online about electric cars being heavier than ICE cars. I was very surprised to see your numbers showing that the difference is only 10-15% of the total weight. Since batteries improve every year, in the near future the weight difference will depend completely on the range the designers want (more range more weight). I note that popular big SUVs and 4 door pickups are even heavier.
I agree with you that this is trivial. As I said in comment 4, this looks like fossil propaganda.


