


 Arguments


Recent Comments
Prev 29 30 31 32 33 34 35 36 37 38 39 40 41 42 43 44 Next
Comments 1801 to 1850:
-
JohnSeers at 23:06 PM on 4 April 2023Two attempts to blame global warming on volcanoes
There is a third argument made that volcanoes cause global warming. Many underwater volcanoes heat the ocean and transfer heat via the PDO, AMO, ENSO etc.
Is there any debunking of that anywhere? -
alonerock at 22:46 PM on 4 April 2023Inside the quest to develop long-range tornado forecasts
Can someone please tell me the approximate minimum depth of the Atlantic ocean off the coast of Newburyport Mass. when vast amounts of water was locked up in the ice caps ? In other words, how much less than current sea level. 200 feet ? IWhen I have talked with captains of dredgers over the past 50 years, many of them have pulled up mammoth skeletons with spear points, skeletons of saber-tooth tigers, camels and other Pleistocene species many miles off the coast, so I suspect that the seal and mammoth hunters from the Spain-French occupied eastern North America long before the Indians who crossed Beringia. I believe this idea is supported with DNA evidence as well. Any thoughts ?
Moderator Response:[BL} This is rather off-topic for this blog post. There are many other posts here at Skeptical Science that discuss sea level change over the time scale you are questioning.
This post on the importance of CO2 over glacial periods shows global sea level changes of about 100m.
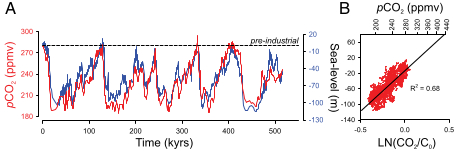
This post covers sea levels over the past 150,000 years, and includes this figure:
Those are global averages. Along the Mass. coast, glacial ice weight (added, removed) will cause additional local changes. The effect is explained in this post on This Elastic Earth. It includes this animation . (Go to the post to understand what it is showing.)

-
Terry2 at 18:01 PM on 4 April 2023CO2 lags temperature
Thank you for your excellent website and all the valuable information. I found this FAQ on CO2 lagging temperature very helpful. I found a copy of the Lorius et al. (1990) paper in Nature and it is great.
Pardon me if this has been said before in the may posts, but I could not see the direct quote that you present in the paper. The sentiments are definitley there and reflect the findings in the Lorius et al. paper, but not in those exact words. Perhaps the direct quote you have included comes from a different paper. It seems more like a commentary on the paper.
Thank you again.
-
One Planet Only Forever at 03:06 AM on 4 April 20232023 SkS Weekly Climate Change & Global Warming News Roundup #13
The Story of the Week raises interesting questions about how 'progress, advancement and improvement' are evaluated (and valued). New technology developments can be very negative in spite of the promotion of positive perceptions about the 'amazing new developments'. Many developed measures of status, like popularity or profit, do not relate to, or indicate, helpfulness or harmfulness.
More freedom to develop and spread misleading marketing is potentially the most harmful type of 'freedom'. And the most effective counter-measures appear to be educating people by more effectively exposing 'everyone' to the harmful misunderstandings some people try to benefit from developing and spreading.
Requiring AI guardrails to make it harder to abuse is helpful. The challenge is ensuring that constantly improved guardrails are being implemented on every AI. But creative people would still figure out how to harmfully abuse those developed systems.
In addition to rigorous requirements for guardrails, it would be helpful to have the AI developers share their product knowledge with a UN organization of global experts. That team of experts would develop and deploy a powerful AI application that seeks out misleading claims and rapidly responds with effective educational information. If it is well developed it could even produce responses that appeal to people who have become deeply immersed in harmful misunderstanding.
-
Bob Loblaw at 23:36 PM on 2 April 2023CO2 limits will harm the economy
As usual, MA Rodger @115 manages to find links to useful links to these things...
I did read Lomborg's "The Skeptical Environmentalist" many years ago. The major thing that struck me was the way he compartmentalized the various "costs" and alternative solutions. He'd look at one specific/isolated problem caused by climate change, and then claim that it was cheaper to fix that problem after the fact than to avoid the climate change.
Of course, to avoid climate change you only have to pay for it once - not many times for each individual/isolated problem. He would never add up all the costs of the different isolated problems and compare that total to the one-time "avoid climate change" cost.
It's like saying "it will cost me $10,000 to fix that leaking roof on my house", and then conclude that it is cheaper to clean and repaint the bedroom ceiling when the water damages it. And then when the leaking roof causes damage to wall insulation, it's cheaper to replace the insulation. And when electrical wiring shorts out, it's cheaper to re-do the wiring. And when the TV gets wet, it's cheaper to replace the TV. And on, and on, and on.
Eventually, the rational home owner realizes that it would have been cheaper to fix the roof than to replace the many, many things that the leaking roof damaged. But as long as you can fool the home owner into looking at each individual problem in isolation, you can sell them a paint job, an electrical job, and new TV, etc. If your business is home repair - not roofing - then it becomes a lucrative approach. Also lucrative if your business is to prevent roof repairs.
MA Rodger's link to the rebuttal is worth reading. Lomborg, not so much. All you need to do is look to see what Lomborg's proposed alternatives are and assess how much effort he puts into making those alternatives happen - as opposed to how much effort he puts into arguing against preventing climate change. (Cue the XKCD cartoon...)
-
MA Rodger at 18:35 PM on 2 April 2023CO2 limits will harm the economy
retiredguy @112,
You do specifically ask about rebuttals of Lomborg's verbose 2020 paper 'Welfare in the 21st century: Increasing development, reducing inequality, the impact of climate change, and the cost of climate policies' and as has been pointed out, this paper is packed full of the usual Lomborg nonsense. I don't know of any specific rebuttal to this paper. I think with a 'broken record' like Lomborg, you need the expertise to unpick his nonsense as well as the dedication to keep at it. A month after this paper, Lomborg published a book 'False Alarm: How Climate Change Panic Costs Us Trillions, Hurts the Poor, and Fails to Fix the Planet' and that did result in a rebuttal.
As for the paper 'Welfare in the 21st century: Increasing development, reducing inequality, the impact of climate change, and the cost of climate policies,' we can cut through all Lomborg's nonsense and simply consider his basic argument which is that AGM mitigation preventing large levels of global warming (as in scenario SSP1-1.9) is, according to Lomborg, not as benificial to mankind as allowing fossil fuel use to continue without restriction (as in secanario SSP5-8.5, roughly similar to the previous RCP8.5). From the abstract:-
Long-term impacts of climate policy can cost even more [than 2030 costs]. The IPCC's two best future scenarios are the “sustainable” SSP1 and the “fossil-fuel driven” SSP5. Current climate-focused attitudes suggest we aim for the “sustainable” world, but the higher economic growth in SSP5 actually leads to much greater welfare for humanity. After adjusting for climate damages, SSP5 will on average leave grandchildren of today's poor $48,000 better off every year. It will reduce poverty by 26 million each year until 2050, inequality will be lower, and more than 80 million premature deaths will be avoided.
This argument is thus mainly based on the economic predictions set out by IPCC ARs within these SSPs and then downplaying to the point of insignificant the economic damage in a SSP5-8.5 world experiencing +4.4ºC by 2100 (this a central figure in the range +3.3ºC-5.7ºC) and which will continue warming post-2100, the 2300 range being given as +6.6ºC−14.1ºC. Now that is scary. (And note in the graphic below, the SSP5/RCP8.5 temperatures are still rising in 2300. There is even more to come.) Lomborg is advocating a really scary future while insisting there is no scary future.

-
One Planet Only Forever at 10:05 AM on 2 April 2023CO2 limits will harm the economy
retiredguy @112,
As Bob Loblaw has pointed out, serious pursuers of better understanding may not have bothered to do 'yet another' detailed debunking of Lomborg's nonsense. I read some of his earlier books and was able to easily identify many misleading claims he made. He has a history of changing his claims, but not his motivation to be misleading regarding the climate impact problem and its solutions.
Based on the title of the 2020 Lomborg item, I am almost certain that this version of his misleading story-telling efforts can be effectively corrected by reading helpful detailed documents like the UNDP's Human Development Reports. I particularly recommend the 2020 HDR which includes a robust evaluation that dispels the myth that GDP is a meaningful measure of advancement.
Other documents that help people learn how to dismiss the claims of people like Lomborg include:
- The series of documents in the SkS "New reports spell out climate urgency, shortfalls, needed actions"
- The Story of the Week in the 2023 SkS Weekly Climate Change & Global Warming News Roundup #5: "Social change more important than physical tipping points" and the "Hamburg Climate Futures Outlook 2023" it summarizes.
-
Bob Loblaw at 04:44 AM on 2 April 2023At a glance - What do the 'Climategate' hacked CRU emails tell us?
That's a new trick for me, jimpsy.
Similar to the trick I learned when I was young, for multiplying 2-digit numbers by 11:
- Take the two digits, and insert a space between them.
- Add the two digits together.
- Insert the sum in the space you created.
23x11 becomes 2[space]3, and the sum of 2+3 = 5, so 23x11 = 253.
47x11 becomes 4[space]7, and 4+7 = 11, so you insert 11 in the space by adding the first 1 to 4 and leaving the second 1 in place, so 47x11 = (4+1)17 = 517.
An absolutely dastardly trick if I ever saw one...
-
Bob Loblaw at 04:34 AM on 2 April 2023CO2 limits will harm the economy
retiredguy:
Bjorn Lomborg is a broken record, who basically keeps repeating most of the same arguments over and over and over (and over). Much of his stuff has been debunked in a variety of sources (over, and over, and over, and over).
Is there anything particularly new in that work you linked to? Any reason to spend time on it, since (for me, at least) it has been years (if not decades) since I have seen anything worth reading from him?
You can read more about his general track record at Desmog.
...and for the most, part, I think what he usually has to say bears a strong resemblance to this XKCD cartoon:

-
Rob Honeycutt at 03:01 AM on 2 April 2023At a glance - What do the 'Climategate' hacked CRU emails tell us?
jimspy... I think that qualifies as Voodoo. ;-)
-
retiredguy at 01:09 AM on 2 April 2023CO2 limits will harm the economy
Can anyone point me to a comprehensive review and response to Bjorn Lomborg's July 2020 article, "Welfare in the 21st century: Increasing development, reducing inequality, the impact of climate change, and the cost of climate policies" ?
https://www.sciencedirect.com/science/article/pii/S0040162520304157
Moderator Response:[BL] Link activated. Please learn how to do this yourself.
As previously mentioned, you can do this when posting a comment by selecting the "insert" tab, selecting the text you want to use for the link, and clicking on the icon that looks like a chain link. Add the URL in the dialog box.
-
jimspy at 18:41 PM on 1 April 2023At a glance - What do the 'Climategate' hacked CRU emails tell us?
If I had a nickel for every time I had to remind skeptics that there are two, subtly but distinctly differentiated meanings of the word trick... A simple way to present it, at least in person, is to demonstrate how to mutiply by 9 on your fingers. The multiplicand is 9. Count on the fingers of your left hand up to the multiplier, let's say it's 5. You bend your fifth finger (pinky) down. There are 4 fingers remaining on your left hand, and 5 remaining on your right - 45. Now, I just showed you a trick....but did I trick you?
-
One Planet Only Forever at 14:30 PM on 1 April 2023Extreme heat waves in Europe may be linked to melting Arctic sea ice
Gordon and Bob,
I agree that discussing 'energy poverty' is getting off-topic. But raising the related problem of 'energy gluttony' seems appropriate, because 'harmful energy gluttony' is a major root of the climate impact problem.
All I will add is that 'energy gluttony' can be understood to be a major aggravating factor regarding 'energy poverty'.
-
Bob Loblaw at 11:18 AM on 1 April 2023Extreme heat waves in Europe may be linked to melting Arctic sea ice
Now that I am looking at the maps that you mention regarding the "energy poverty" issue, it looks like that December high mortality rate is in reference to the 2016-2019 average. The way they worded that suggests that they have not adjusted for seasonal patterns, which makes it very difficult to tell if the December 2022 value is really an unusual case, or just a normal seasonal effect.
As for the similarity between the "can't keep the home warm" and the "Dec 2022 excess mortality" maps - I am not seeing a strong link. Norway and Finland score high on the excess deaths map, but they are in the lowest category for "problems heating". Switzerland and Austria also show a similar pattern. Romania and Bulgaria are the opposite: they score very low on excess deaths, but are in the highest two categories for "unable to heat the home". The geography of Europe suggests that some countries may be much better prepared for heating in the cold season. There are a lot of variables involved.
Your definition of energy poverty also seems rather vague. There are a multitude of levels of "negatively affect", and "health and well-being" also covers an awful lot of ground.
And finally - this is really getting off-topic for the blog post.
-
Bob Loblaw at 10:57 AM on 1 April 2023Extreme heat waves in Europe may be linked to melting Arctic sea ice
Thanks for the link, Gordon. For future reference, when you provide a quote like that one, it really helps if you give a proper link to the source, rather than leaving people guessing.
I can find that quote on page 22. There is very little context there. They repeat the 40,000 number on page 37, where they say:
Gallagher Re estimates that as many as or more than 40,000 excess deaths were recorded between June and August from heat-related activity in the region, which particularly hit the UK, France, Spain and Portugal. This was conducted based on national-level mortality analysis.
and then again in the appendix tables on page 52. In none of those cases do they provide any further details on the analysis method.
Without details on the analysis method, there isn't much hope in trying to come up with an explanation of why they attribute European summer deaths to heat, and other spikes are attributed to other causes. The original quote you provided does state that this was a "preliminary estimate", which suggests that it was not as thorough as they would like.
You may wish to read this Reaclimate post on heat-deaths vs cold-deaths under a warming climate. It mentions that winter mortality rates in Europe are normally higher - but hopefully an "excess mortality" assessment would take this into account.
The Eurostat link in comment #1 does not tell us if the 19% "sharp rise" in December 2022 is within a normal range of variability for December, and it does not tell us if they use individual monthly averages for each "excess death" calculation, or an average over several months, a full year, or several years. The quote I gave in comment #2 contains values for four other peaks in the past three years - two in April, and two in November. That suggests that they might not be making monthly base/reference calculations - but it's really hard to tell.
Methodology is critically important in these sorts of calculations.
-
Gordon at 09:43 AM on 1 April 2023Extreme heat waves in Europe may be linked to melting Arctic sea ice
Bob:
Here is the LINK to the quote in comment#1.
Energy poverty is defined as such:
Energy poverty occurs when energy bills represent a high percentage of consumers’ income, or when they must reduce their household's energy consumption to a degree that negatively impacts their health and well-being."
A simple example supporting my belief can be found by comparing the MAP in this article with the MAP in this one. Note that Germany's situation has deteriorated substantially since 2020 due to the war and loss of Nordstream. You can find the MAP for July here by selecting the the appropriate time series on the top left hand corner.
-
Bob Loblaw at 23:43 PM on 31 March 2023Solar cycles cause global warming
As a further follow-up to the responses to retiredguy, note that the Beer et al paper mentioned in comment #60 is from 2000, when a lot of contrarians were still beating the "cosmic rays" drum pretty hard. You can read more about it here. In the past 20 years, that drum has been beaten to death.
Just over a year ago, I also did a more thorough review of another "it's the sun" paper that SkS was asked about in email. You can read that review to see where the paper went wrong. That paper argued (incorrectly) for "indirect solar effects" in an attempt to get around the weak direct effects (changes in total energy from the sun).
And finally, reading my comment #62 here in the original thread (instead of in "Recent Comments"), I see that the graph I provided is also in Comment #59.... Plus ca change...
-
Bob Loblaw at 23:25 PM on 31 March 2023Extreme heat waves in Europe may be linked to melting Arctic sea ice
Gordon:
I am still not finding the quote you provided in comment #1 in your link in comment #1 (repeated in comment #3). The word "heat " only appears on that page once, and it is in the text that I quoted in comment #2. The second link that you provided in comment #3 does not contain the word "heat" at all (letting my browser search for it).
Please check your sources and given a proper reference/source for the quote. To understand the quote, we need more information about context and methodology.
Your second link does provide Covid-related deaths in raw numbers, but does not let us determine how to transform that into "excess mortality" as a percent - we need to know both a numerator and a denominator to be able to calculate percent.
As for your closing statement about energy poverty, you are going to have to define what you mean by that term and provide some supporting data/information if you want us to think it is anything more than a belief on your part.
-
MA Rodger at 19:51 PM on 31 March 2023Solar cycles cause global warming
retiredguy @60,
A pointed out by responding comment, Beer et al (2000) is quite old and struggles with its solar irradience reconstruction. A more recent paper of which Beer is a co-author is Gray et al (2010) 'Solar influences on Climate'. This concludes by saying:-
Despite these uncertainties in solar radiative forcing, they are nevertheless much smaller than the estimated radiative forcing due to anthropogenic changes, and the predicted solar cycle‐related surface temperature change is small relative to anthropogenic changes.
-
Gordon at 17:28 PM on 31 March 2023Extreme heat waves in Europe may be linked to melting Arctic sea ice
Hi Bob,
The quote comes from the paper referred to in the second paragraph link "40,000 people died". Incidently the paper was written by an insurance company and does not contain any references that I can find to support the claim. Whilst the excess mortality LINK shows 17% for July and 19% for December it does not distinguish between Covid and other causes. This LINK, however, does show the number of Covid deaths for the respective periods. Interestingly, the deaths from Covid in July were higher than in December. It is well known that more people die during cold periods than during warm (as demonstrated here), however, I believe the main driver behind these increases is energy poverty.
-
Bob Loblaw at 11:35 AM on 31 March 2023Extreme heat waves in Europe may be linked to melting Arctic sea ice
Gordon:
I have not watched the video. Is the quote you provide transcribed from the video? At what time point?
The link you provide referencing the December 2022 spike generally makes no attempt to attribute the spikes it sees (in any period, let alone Dec 2022). It just reports numbers compared to a reference period. There is a paragraph saying:
"The EU registered earlier major peaks in excess deaths in April 2020 (+25%), November 2020 (+40%), April 2021 (+21%) and November 2021 (+27%). July 2022 also showed significantly higher than the baseline mortality, possibly due to the heatwaves that affected parts of Europe during the reference period.
The quote you provided includes the phrase (emphasis added) "...by subtracting from recent decadal averages and COVID-19 spikes...". That means it the raw excess mortality has been adjusted for Covid-19 (a known cause of excess mortality).
The link you gave also includes this paragraph:
"Please note that while a substantial increase in excess mortality largely coincides with the COVID-19 outbreak, this indicator does not discriminate among the causes of death and does not identify differences between sex or age.
Do you know the cause of the Dec 2022 spike, or are you just speculating?
And do you have numbers available that will allow a proper comparison of excess deaths measured as a number (40,000) and a % (the 19% given for December in the link you gave). You can't compare apples and oranges,
-
Bob Loblaw at 11:09 AM on 31 March 2023Solar cycles cause global warming
retiredguy:
You have linked to the publisher's site, which only has a portion of the paper visible (along with "Access through your institution" and "Purchase PDF" buttons). Google Scholar led me to a full version here.
The first half of the paper simply reiterates a variety of reasons to expect variation in solar input to the earth system on a variety of time scales, without getting into specific solar irradiance values. They also talk about the importance of spectral variations - in addition to simple variations in total energy input.
In section 3.1, they cover "the reconstruction of the past solar irradiance". In that section, they state (emphasis added):
"Our own irradiance reconstruction is based on the frequency of the Schwabe cycle because we find a better fit with the temperature data if we assume a linear relationship between cycle frequency and irradiance (Fig. 7).
Their figure 7 is a graph of the reconstructed solar irradiance. It shows a solar irradiance value of about 1362 W/m2 in 1850, and a value of about 1366 W/m2 in 1990, for a difference of 4 W/m2. The wiggles in their reconstruction go as low as 1361 W/m2 in 1900, up to 1364 W/m2 from 1920-1950, and down to 1362 W/m2 around 1965.
Skeptical Science also has another page on "It's the sun". On that page, we see another solar irradiance reconstruction:

Note that the reconstruction from the paper you linked to shows much more variability and range. Their figure 7 mentions a "14-y low-pass filter", so it should probably be compared to the 11-year average in the above figure.
So, the first thing is that they have estimated a much larger change (about 4x) in solar irradiance over the 1850-1990 period than most other sources. This would explain their conclusions that solar forcing is a strong effect.
So, you have to ask, which solar reconstruction is better? Well, I think the clue is in the section I quoted and highlighted above, regarding their choice of method of reconstruction:
"...because we find a better fit with the temperature data..."
To put it bluntly, to claim that solar forcing is an important factor affecting temperature after choosing a solar reconstruction "because we find a better fit with the temperature data" is plain bad science. In all likelihood, they have erroneously fitted other causes of temperature change into their solar reconstruction, which leads to an overestimate of the magnitude and importance of solar forcing.
I notice their figure 10 is also for northern hemisphere temperature, not global. They do talk about the two hemispheres in the text, but I don't see an explanation as to why they did not use global temperature in their final evaluation.
In short, the main weakness is that they have a really bad solar irradiance reconstruction.
-
Rob Honeycutt at 09:52 AM on 31 March 2023Solar cycles cause global warming
retiredguy... That's a very old paper and really doesn't claim much nor does it seem to present any actual research. I don't see any claim of 40%. Is there more to the paper that I'm not seeing? I ask because the the paper in that link ends with an ellipsis suggesting there's more.
-
retiredguy at 09:19 AM on 31 March 2023Solar cycles cause global warming
Can anyone comment on J. Beer et al's assertion in 2000 that 40% of global warming which occurred between 1850 and 1990 was due to the sun ?
Moderator Response:[RH] Link activated
-
MA Rodger at 09:17 AM on 31 March 2023Climate sensitivity is low
retiredguy @387,
Lewis (2022) 'Objectively combining climate sensitivity evidence' was given the once-over in a comment thread at RealClimate when it first appeared last year.
-
Gordon at 08:55 AM on 31 March 2023Extreme heat waves in Europe may be linked to melting Arctic sea ice
"Preliminary estimates based on Gallagher Re analysis of
country-level excess mortality statistics, which determined totals
by subtracting from recent decadal averages and COVID-19 spikes,
suggested that as many as or more than 40,000 excess deaths
may be attributed to the extreme heat across the continent during
the summer months."If this really was the case why then did excess deaths spike more in December 2022 than in July 2022 ? Is this just a case of the cold being more deadly than the heat or is there something else going on here ?
-
retiredguy at 08:29 AM on 31 March 2023Climate sensitivity is low
Can anyone comment on Nic Lewis' 'rebuttal' of Sherwood et al's findings ?
https://link.springer.com/article/10.1007/s00382-022-06468-x
Moderator Response:[BL] Link activated.
The web software here does not automatically create links. You can do this when posting a comment by selecting the "insert" tab, selecting the text you want to use for the link, and clicking on the icon that looks like a chain link. Add the URL in the dialog box. -
retiredguy at 08:22 AM on 31 March 2023Models are unreliable
Can anyone comment (in terms that an intelligent but relative domain novice might understand) on Nic Lewis's 'rebuttal' (specifically his 3 claims and conclusion) of Steven Sherwood et al's findings relative to effective sensitivity and it's uncertainty ?
Sherwood: https://agupubs.onlinelibrary.wiley.com/doi/full/10.1029/2019RG000678
Lewis: https://link.springer.com/article/10.1007/s00382-022-06468-x
Moderator Response:[BL] Links activated...
...but, you have asked the same question on another thread, and have already received an answer there.
Please do not post the same information on multiple threads. Pick one, and stick to it, so all responses can be seen together. New comments are always visible - regardless of the thread - from the Comments link immediately under the masthead.
Anyone reading this comment in the "Models are unreliable" thread should follow the link to the comment on the "How sensitive is our climate?" thread and respond there.
-
Bob Loblaw at 23:50 PM on 30 March 2023Gas stoves pose health risks. Are gas furnaces and other appliances safe to use?
A quick reference to a news item I came across this week. Earlier this month, Desmog had an article about this gas stove issue, with the under-the-headline statement "The American Gas Association is trying to discredit research on the health impacts of gas stoves today. But newly revealed documents show it was discussing indoor air pollution concerns five decades ago."
As described in the Desmog article, the pattern of behaviour by an industry trade group looks awfully familiar. It is a lot like the tactics that we have seen from the fossil fuel industry over climate change issues - and by the tobacco industry over smoking and cancer issues.
-
John Hartz at 04:25 AM on 30 March 2023At a glance - Is Antarctica losing or gaining ice?
Suggested supplemental reading:
Fact check: NASA Antarctic ice sheet data consistent with global warming by Kate S Petersen, Fact Check, USA Today, Mar 24, 2023
-
Bob Loblaw at 23:48 PM on 27 March 2023Gas stoves pose health risks. Are gas furnaces and other appliances safe to use?
And finally, in comment #13, David-acct refers to another article critical of PAF, and provides what he calls a "money quote".
What David-acct does not do is include other quotes from the same paper's Conclusions section.
The first quote I will provide talks about assumptions related to the use of PAFs:
With respect to interpretation of an AF as the proportion of disease risk that could be eliminated if the excess risk associated with exposure were to be eliminated, there may be valuable meaning under a specific set of assumptions. In addition to the assumptions commonly listed in textbooks, there is one more critical assumption: that we can envision a specific intervention that will cause the estimated reduction in risk in the exposed while changing no other risk factor distributions.
The second quote I will provide is the final paragraph of those conclusions (emphasis added):
This paper is not an argument for never computing a population AF. It is an argument for more clarity, justification, and complex thinking when using this measure. AFs are only a beginning of the discussion of the public health consequences of intervening to reduce the prevalence of risk exposures.
Once again, the paper does not support the argument that David-acct is trying to make. From his first post, he has been trying to dismiss the results of a study simply because it used PAF. None of the references he has provided represent a blanket condemnation of PAF that he wants to think they do. They recommend caution, which is an argument applicable to any statistical method - for example, over-stating the significance of a correlation (or lack thereof) that we have seen in certain comments here.
-
Bob Loblaw at 23:27 PM on 27 March 2023Gas stoves pose health risks. Are gas furnaces and other appliances safe to use?
To follow up on Michael Sweet's comment 15, pointing out that the study that David-acct has linked to is related to open fires, here is the relevant quote from the Interpretation section:
The use of open fires for cooking is associated with an increased risk of symptoms of asthma and of asthma diagnosis in children. Because a large percentage of the world population uses open fires for cooking, this method of cooking might be an important modifiable risk factor if the association is proven to be causal.
(The full paper is behind a paywall. Onlne availability at The Lancet is limited to this.)
Questions for David-acct:
- How may households in the U.S. use open fires for cooking?
- Are open fires used for cooking expected to be a significant contributor to asthma in the U.S.?
-
Bob Loblaw at 23:11 PM on 27 March 2023Gas stoves pose health risks. Are gas furnaces and other appliances safe to use?
David-acct:
Now you are tripling down on your erroneous analysis.
As I have pointed out, your lack of correlation is meaningless. Your methodology gets no correlation even when applied to a set of data that is completely explained by two variables, including the one that you claim has "no correlation". A bogus search for correlation - by ignoring confounding variables - is not evidence for anything.
And, as I have pointed out, PAF is not the measure that used to determine whether or not a single variable affects an outcome - it is an application of other results (the Odds Ratio, in this case) where gas stoves have been previously assessed against other possible causes of asthma.
Your continued focus on PAF is unfortunate.
Your 'by design?" quip in comment 14 is an accusation of dishonesty on the part of the authors of the study in question. That is a serious accusation.
Have you provided the wrong link for your "much newer, more comprehensive" study mentioned in comment 14? That link leads to a paper from 2013 - the same year as the metastudy that is the first reference in the paper mentioned in the original blog post. In fact, the paper that you linked to is listed in the references of the metastudy. How was this study "omitted" when it is part of the chain of references?
The authors also did a search for newer material, and assessed a number of papers, but none had any newer material. They state, in their Materials amd Methods section:
Full manuscripts (n = 27) were independently reviewed by co-authors; none reported new associations between gas stove use and childhood asthma specifically in North America or Europe.
As for the use of data from North America and some of Europe: the authors of the study referenced in the OP are explicit regarding this in their Materials and Methods section (emphasis added):
We combined effect sizes for North America and Europe given the similarities in housing characteristics and gas-stove usage patterns across these geographies.
What this means is that they are looking for results that can reasonably apply to the U.S. with minimum difficulty. Selecting data that comes from similar environments reduces the likelihood that there are confounding variables that are not controlled for. This is good scientific practise: search for relevant results that are directly applicable to your use case. Do not include results that have factors that are not present in the area that you are analyzing.
Frankly, you are clutching at straws to try to dismiss the results of this study. It is clear that you do not understand the methodology, you do not understand the statistics, and you do not understand the chain of supporting evidence referenced in the sequence of papers cited in the relevant studies. You keep missing essential details in the papers that cover the "criticisms" that you are making. The only parts you seem to be reading are the parts that you erroneously seem to think invalidate the study.
-
michael sweet at 22:35 PM on 27 March 2023Gas stoves pose health risks. Are gas furnaces and other appliances safe to use?
David-Acct,
The study you link is much older than the stuy Bob Loblaw linked. In fact, the study that Bob linked only reviewed studies that were pubished after the study you linked. Your statement "a much newer. more comprehensive and robust study" is incorrect. Bob's study also only used data from the USA and Europe while your link used worldwide data, mostly from open fires.
The study that Bob linked used data from 9 states. They are not the same states that you produced data for in post 7. You have not linked where you obtained the data you posted. Where did you get the data in post 7? I note that the study Bob linked used all the states where the most comprehensive data was available for. How were the states you selected chosen? Was a list of all the states reviewed and these picked out for some reason?
-
David-acct at 21:19 PM on 27 March 2023Gas stoves pose health risks. Are gas furnaces and other appliances safe to use?
I will also note that the gas stove study was a meta study which limited the studies used to only those in North america and some europe.
The selection omitted a much newer. more comprehensive and robust study. (by design?)
-
David-acct at 21:15 PM on 27 March 2023Gas stoves pose health risks. Are gas furnaces and other appliances safe to use?
Bob
This argument boils down to whether the PAF metholodogly is valid in this case. If the study was robust, then there would be some positive level of correlation. As I have shown above, there is near zero correlation.
As I previously noted , and as I linked above, PAF doesnt work when there are multiple cofounding variables. With Asthma there are far too many variables which prevents an analysis using PAF to be robust.
pubmed.ncbi.nlm.nih.gov/9584027/
Here is another article on the short comings of PAF with multiple variables.
https://www.ncbi.nlm.nih.gov/pmc/articles/PMC1832135/
The money quote in that article is the first sentence of the conclusion
"As discussed previously in this article and as stated by Kempthorne (14), attempts to partition causality when multiple forces act together to produce the outcome are meaningless."
Moderator Response:[BL] Second link linkified.
-
One Planet Only Forever at 09:36 AM on 27 March 2023It's not urgent
An important follow-up to my comment @30,
'Ethically', the current generation should build more than enough atmospheric carbon removal and storage systems to rapidly draw down the 'excess CO2 above 1.5 C impact' that will be the result of the lack of 'harm reduction' leadership in the current generation.
Any attempt to promote the belief that future generations will be able to afford the CO2 removal is 'worse than Green Washing'. It is like saying it is OK to benefit from harming other people because:
- They can afford to be harmed
- or They deserve to be harmed
- or, most likely, They can do very little in retaliation to the harm done to them. Future generations can do very little to past generations. About all they can do is correct any incorrect perceptions of Greatness.
Ending harm done is always urgently and ethically required, no matter what claims are made up regarding how deserving the beneficiaries are of the benefits they get from being harmful.
-
One Planet Only Forever at 09:11 AM on 27 March 2023It's not urgent
PollutionMonster,
In addition to what MA Rogers has mentioned, it is important to clarify the following:
Storage of Carbon Captured from the emissions of burned fossil fuels may help reduce the rate of harm done. But it is not the same as Storage of CO2 Captured from the atmosphere.
The now almost certain to be needed is:
Ending the human activities that result in increased CO2 in the atmosphere (has always needed to be done as rapidly as possible).
Plus
Removing excess CO2 to bring global warming impact back below 1.5 C (almost certain to be needed because of the lack of responsible leadership actions to govern/limit how much harm was done).
The capture and storage of CO2 from fossil fuel burning is not really a solution for the following reasons (and maybe more reasons):
- Not all of the emissions will be captured. That will require more CO2 removal from the atmosphere.
- Not all of the captured emissions will be effectively stored. That will require more CO2 removal from the atmosphere.
- There will be other ghg emissions from the extraction, processing, transport (even leaks of methane before it is burned). That will require more CO2 removal from the atmosphere.
Attempts to frame CCS related to fossil fuels, or other uses for ancient buried hydrocarbons like Blue Hydrogen production, as 'solutions to the problem of increased atmospheric CO2 levels beyond 1.5 C impact' are 'Green Washing'.
As a resident of Alberta I am very familiar with the Government (Alberta's and Canada's) Green Washing in their pursuit of popular support for maximum revenue by maximizing the benefits obtained from harmful uses of 'ancient hydrocarbons buried in Canada'.
-
One Planet Only Forever at 03:51 AM on 27 March 2023CO2 effect is saturated
Gootmud’s comment @680 and the responses have been informative and educational. Thank you Rob, Eclectic, MA Roger, and Bob. However, based on today’s reality, I think this Rebuttal should be updated.
The potential magnitude of global warming due to a doubling of CO2, and the related denial tactic of claiming the CO2 effect is ‘saturated’ or not a significant concern, is now only an academic matter. It was an important matter for leaders to be aware of 30 years ago when it was vigorously argued against by ‘people with interests that were contrary to this improving understanding’. But since warming beyond 1.0 C has already occurred, and warming beyond 1.5 C is already likely due to a lack of responsible leadership action to limit the harm done, it is no longer a relevant leadership considerations.
Note: Disappointing people who have developed undeserved perceptions of opportunity, prosperity, advancement or superiority based on harmful unsustainable activity and related beliefs ‘is not harmful’. Governing to limit harm done is essential to the advancement of civilization.
The Story of the Week “1.5 and 2°C: A Journey Through the Temperature Target That Haunts the World” in the “2022 SkS Weekly Climate Change & Global Warming News Roundup #50” makes it clear that decades ago the following was understandable:
- warming above 1.0 C risks significant harm (that is now proven by today’s reality).
- warming beyond 2.0 C is very risky (hopefully that will never be proven in a near future reality).
That understanding fits with the 1.5 C ‘long term maximum harmful impact objective’ paired with the need to limit the ‘temporary peak harmful impact level’ to significantly less than 2.0 C.
The IPCC FAQ Chapter 1 provides additional information regarding the targets. An important bit of information is that 1.0 C warming was reached in 2017. When the formal global leadership agreement was established in 2015 human impacts were almost certain to exceed 1.0 C. And the significant costs of the failure to limit the peak human impacts to 1.0 C are also now harder to deny.
The reality today is: No matter what someone wants to believe regarding the sensitivity of global average surface temperature to increasing CO2 the actual evidence makes that debate irrelevant. What is now undeniable by leadership is the need for the unprofitable safe removal of carbon from the atmosphere to bring the harmful impact level back down below 1.5C. And it is also undeniable that the people who benefited most from the harm done need to do the most to limit how much worse the problem is at the peak, pay to remove the excess carbon, and help everyone harmed by the impacts of what they benefited from.
Leaders no longer need to be guided by the science of the potential rate of warming due to a doubling of CO2 levels. That type of pursuit of understanding is also ‘hopefully’ very unlikely to be relevant to the future of humanity. Responsible leadership would prevent that magnitude of harm done from ever becoming a reality.
-
MA Rodger at 08:24 AM on 26 March 2023It's not urgent
PolutionMonster @28,
The "green wash" aspect to CCS comes from the oil industry seeing the injection of CO2 down oil wells as a useful 'voidage replacement' method for extracting more oil while the storage of CO2 keeps some of the criticism of fossil fuel extraction at arm's length. I'm not sure of the capacity in old FF wells. The carbon density of a well full of CO2 is going to be far far lower than one full of oil. Strangely, pumping CO2 down gas wells (where prsumably carbon-density for CO2 would be on a par with CH4) is mostly discussed in terms of preventing atmospheric CO2 release during gas extraction (which can contain a lot of CO2).
Yet CCS does obviously run beyond the "green wash" when the storage isn't an aging oil well and/or is used to draw down atmospheric CO2 rather than to stop CO2 emissions. Thus Bioenergy CCS or Direct Air CCS.And denialism in politics - the right-wing of UK politics has become far more mainstream due to Brexit. And I have found those who campaign for Brexit were almost to a man also strong climate change deniers. This was very noticable here abouts as we had a big battle over an off-shore wind farm opposed by the denialists and eventually stopped by the Tory government newly free of coalition partners. This was followed closely by the Brexit referendum and us 'remainers' were locally facing exactly the same opposition line-up as with the wind farm.
-
PollutionMonster at 06:46 AM on 26 March 2023It's not urgent
Thank you for the detailed response. I'm still reading all the links. I finished the guardian link.
I didn't know that carbon capture was considered green-washing. I started arguing with climate change deniers in 2016 and I was a pro-science libertarian, sort of like Michael Shermer. I got caught up in the new atheist movement as I saw it a pro-science movement. A call to arms to defend science.
The tribalism of the pro-science tribe versus the deniers. I guess what I am saying is my stance is more of "I must protect science" as opposed to I must save the environment.
I've been focusing on fossil fuel subsidies and taxing carbon.
"Globally, fossil fuel subsidies are were $5.9 trillion or 6.8 percent of GDP in 2020 and are expected to increase to 7.4 percent of GDP in 2025" imf
International monetary fund 5.9 trillion fossil fuel subsidies
The fact that we still have fossil fuel subsidies is abhorrent to my libertarian perspective. Also, carbon is a pollutant, without taxing carbon this is economic rent. Individual profits and socialized costs which breaks capitalism.
I didn't know that the deniers still had such political influence. There are a few hardcore deniers out there but I can usually win the audience, and the onlookers see the denier as a lunatic as you have said.
-
Bob Loblaw at 00:53 AM on 26 March 2023Gas stoves pose health risks. Are gas furnaces and other appliances safe to use?
Another note on David-acct's comment #9. He states:
"...though keep in mind the PAF analysis used in this study only takes in the single factor -gas stove usage.
This shows a misunderstanding of what PAF is and how it is used. Yes, it is looking at what would change if gas stoves were eliminated - a single factor - but the analysis of the effect of gas stoves on asthma is not represented by the PAF values. In comment #5, I showed the equation used in the study in question:
PAF = {p × (RR − 1 )} / {p × ( RR − 1) + 1}
and pointed out that RR is referred to in the paper as the Odds Ratio, with a value of 1.34. That is the number that tells us how gas stove use is related to other asthma causal factors. And the paper cited in the OP does not derive that Odds Ratio from their own data analysis, they do a meta-analysis of other papers that have specifically looked at asthma in more detail. If David-acct questions whether gas stoves affect asthma, he needs to look at those other papers cited in the one we are talking about here.
The Odds Ratio tells that when all other asthma factors are taken into account, adding gas stoves to the mix increases the likelihood of asthma by 34% (1.34 times the background levels without gas stoves.)
The PAF (equation above) just takes that gas stove effect and adjusts each state (or the nation) for actual gas stove usage. Obviously, eliminating gas stoves will have no effect on households that did not have a gas stove to begin with. If all houses had gas stoves, and we eliminated all, then the Odds Ratio of 1.34 would mean a reduction of 25% in asthma rates. (1/1.34 = 0.75). Fewer gas stoves? Less reduction through elimination of gas stoves.
-
Bob Loblaw at 00:34 AM on 26 March 2023Gas stoves pose health risks. Are gas furnaces and other appliances safe to use?
As a further examination of the ABBA music scenario I presented in comment #10, let's see if there is a statistical process that can discover the underlying relationships amongst the variables in the table I created.
Remember: David-acct has claimed in comment #9 that the data he presented in comment #7 indicates a "...complete lack of correlation of asthma rates and gas stove usage which renders the conclusion of that study very suspect. "
So, in comment #10 I created a similar data set, called it "ABBA Music" instead of asthma rates, and created an extra artificially-generated column ("Like ABBA music") that follows an exact model that explains all the variation in ABBA CD ownership. Basically, what I have done is created a model of the form:
Y = aX1 + bX2
where a and b are constants (with values of 0.1 and 0.5 respectively), X1 is gas stove use, and X2 is "Like Abba Music".
David-acct has said "Y is not correlated to X1", which is correct when you completely ignore that X2 is a factor. If we do a linear regression between Y and X1, we get a slope of -0.007, an intercept of 10.2, and an r2 of 0.03. But that analysis assumes that b = 0, which we know is incorrect. The regression result does not get the correct value of a = 0.1 with an intercept of 0.
Likewise, if we do a linear regression of Y vs. X2, we get a slope of 0.11, an intercept of 8.6, and an r2 of 0.30. A better fit, but still wrong. We should get a slope of 0.5 and an intercept of 0.
So, finally, we do multiple linear regression where we fit Y to both X1 and X2, and we find that a=0.1, b=0.5, the intercept is 0, and r2 = 1. This regression correctly identifies the effects of both X1 and X2.
Why does David-acct's analysis go wrong? In my synthetic ABBA music example, the values I used for "Like Abba music" are strongly (negatively) correlated with gas stove use: slope -0.21, intercept 20.3, and r2 = 0.84. David-acct's "no correlation" ignores confounding variables - other factors that vary from state to state and can affect asthma rates, and affect the validity of statistical testing.
And in my "synthetic" ABBA music example, the numbers I use for gas stove % are exactly the same as David'acct's values, and the numbers I use for ABBA CD ownserhip are the same as David-acct's adult asthma rates. If his analysis does not work for ABBA music, it will not work for asthma rates, either.
Moderator Response:[BL] Self-edit. The original comment text had "adjusted r2" values, not raw r2 values. Values corrected to raw r2 values, which are slightly higher (more positive).
-
MA Rodger at 18:59 PM on 25 March 2023It's not urgent
PollutionMonster @26,
The quoting of Schellnhuber in that Scientific American article is a bit of an add-on and somewhat out of context. The article is based on analysis dating back to 2018 here & here (so a little dated now) and is really concerned with the net negative emissions required after we reach the net zero emissions. These net negatives are not much discussed in the political arena, as though we can ignore them. The same is true of the "carbon budget" also addressed by the article. But the 'budget' and the 'negatives' are significant in tackling AGW. The climate scanario SSP1-1.9 (which prevents AGW exceeding +1.5ºC warming, roughly) requires we halve our emissions by 2030 (and indeed to have made serious progress toward that halving by now) as part of keeping-to the 'budget', and following that for all our emissions post-2007 to be removed by the 'negative' policy post net-zero. So keeping to SSP1-1.9 would mean the 'negative' totals something like 1,000 billion t(CO2) [so over 20 years-worth of today's emissions] although the majority of that (perhaps two-thirds) would be post-2100.
The Schellnhuber quote is lacking a bit of context but is presumably predicated on the view that we could lose control of AGW and kick off some extreme tipping points: Schellnhuber has co-authored work on such outcomes. Myself, I would be worried by allowing AGW to get significantly beyond +1.5ºC warming as the effect could easily destroy the world political order and bring about that sub-billion human world population through conflict.
Humanity does need to rough out a workable global plan (or set of plans) for keeping AGW to sensible levels, the first step in identifying how bad the situation actually is. Without such planning, your attempted triage is not going to work.
So what would a plan look like? The world is going to be short of energy sources in years to come as renewables will be required to power the economy as well as those 'negatives' which will be potentially bigger than SSP1-1.9 because we are not cutting our emissions and running out of 'budget'. We need to quickly replace FF with renewables, so build a few tens-of-thousand sq mile of sunny places with solar, connect it to the developed world's power grid as well as using it for hydrogen/ammonia production. And get ready to start sucking those 'negatives' out the atmosphere and pumping them into saline aquifers which have the capacity to take ample amounts of CO2. So a plan would rough out what all that would look like in terms of costs and resources.
Arguing with deniers is required to demonstrate they are the lunatic denialists. They do still have enough influence to slow and even stop mitigation measures. In UK they are now doing just that.
-
PollutionMonster at 15:38 PM on 25 March 2023It's not urgent
I am still not really sure how urgent global warming is. I read this article
"Hans Joachim Schellnhuber, director emeritus of the Potsdam Institute for Climate Impact Research in Germany, told reporters that the cascading effects could lead to a world capable of supporting just one billion human beings, down from 7.5 billion today." Scientific America
World capable of supporting one billion
The reason I ask is there is a lot of causes out there as well as my own personal problems. I am trying basically triage. When I get time I try to feed several causes as well as meet my own needs.
Other noteworthy causes, pro-vaccination, anti-racism, let alone charities like the ASPCA. I haven't even managed to donate blood, I get a physical reaction sometimes. Often authors will make the case that their cause is the most urgent and dire.
Is climate change so dire that we should drop everything else? I mean on some level maybe I should just search for a better paying job and buy an electric car to replace my gasoline car. As opposed to arguing with deniers. Thank you in advance.
-
John Mason at 14:38 PM on 25 March 2023At a glance - What evidence is there for the hockey stick?
In all fairness to me, Nigel, this was an early piece and I did not take the contents of the pre-existing "green box" into account sufficiently! I'll sort it.
-
Bob Loblaw at 12:03 PM on 25 March 2023Gas stoves pose health risks. Are gas furnaces and other appliances safe to use?
David -acct: I figured you would double-down on your misunderstanding.
The lack of correlation in the data you provided does not mean what you think it means. Let me show an example, using a made-up set of values and a fictitious cause-effect relationship. The advantage of this is that I can generate values from known mathematical relationships, then apply your statistical test, and see what happens.
We will start with your per-state values of gas stove use. We will then assume that the world works as follows:
- For some strange reason, every tenth gas stove purchase came with a free ABBA CD, so that 10% of the households that own gas stoves also own an ABBA CD that came from the stove purchase.
- But gas stove owners also might have bought ABBA CDs on their own. It turns out that a survey asked people if they liked ABBA music in each of those states, and if they had bought an ABBA CD to fill that desire. It turns out that in every state, 50% of the people that liked ABBA music had bought a CD. (The other 50% either listen to it on the radio, stream it, have MP3s, etc., or like it but don't listen to it on their own.)
- So, when you take a count of the number of ABBA CDs in houses with gas stoves, the total number of ABBA CDs comes from two sources - the gas stove purchase, and people that bought them on their own.
So, let's look at what the data table from this would look like:
State gas stove % Like ABBA music Total ABBA CD ownership maine 7 19.8 10.6 new york 62 6.6 9.5 Michigan 45 13 11 Missouri 27 13.2 9.3 Rhode Island 36 17 12.1 mississippi 17 14.4 8.9 georgia 35 11 9 pennsylvania 37 13 10.2 DC 62 8.4 10.4 Conn 27 15.8 10.6 California 70 4.6 9.3 nevada 60 7 9.5 Illinois 67 3.6 8.5 Alabama 18 14.4 9 Now remember, we made this data up - at least, I made up the numbers for the "like ABBA music part" - so we know the exact relationships: gas stove ownership causes 10% of those owners to own an ABBA CD, and people that like ABBA music have a 50% chance of owning an ABBA CD.
The final column is an exact match for your adult asthma rates. When we apply your correlation test, the correlation between gas stove use and ABBA CD ownership will be the same as your asthma rates - in spite of the fact that the data were generated using a model where there is a perfect relationship between owning a gas stove and an increased likelihood of owning an ABBA CD.
In your analysis, you have no idea how "other factors" vary from state to state, and you have no idea what the relationships are between those factors and asthma rates, so you cannot determine from your data whether gas stoves have an effect or not. You are missing the "Like ABBA music" column and how it affects total ABBA CD ownership, and you are drawing a very, very wrong conclusion about the effect of gas stove use.
You never bothered to read enough of the original paper to understand where they got their Odds Ratio of 1.34, did you?
-
David-acct at 11:19 AM on 25 March 2023Gas stoves pose health risks. Are gas furnaces and other appliances safe to use?
Bob - that is not the claim that I made.
It was the study that made the claim that approx 12% of asthma cases where caused by gas stoves.
I only pointed out the complete lack of correlation of asthma rates and gas stove usage which renders the conclusion of that study very suspect.
Bob - its true that there are many factors that contribute to asthma - though keep in mind the PAF analysis used in this study only takes in the single factor -gas stove usage. As I detailed above, the correlation is non - existant. Further, the lack of correlation raises the question as to whether paf analysis is even appropriate for searching for causality of asthma and gas stove usage.
-
Bob Loblaw at 11:04 AM on 25 March 2023Gas stoves pose health risks. Are gas furnaces and other appliances safe to use?
David-acct:
You just made a classic mistake again - assuming that gas stoves are the only cause of asthma.
Many other factors can cause asthma - for example, there are may other factors that influence air quality, and many other factors that influence health conditions that can correlate with asthma.
You need to properly account for all those other factors before you can start to say that you have data that reflects only the effect of gas stoves.
I think it is you that is making simple errors - errors in statistical modelling.
-
Rob Honeycutt at 10:58 AM on 25 March 2023CO2 effect is saturated
Gootmud... The "CO2 saturation" claim is a red herring used by climate deniers to try and instill doubt about the science. Don't get stuck on whether the claims are technically accurate. Fundamentally, people rejecting climate science are mostly politically or ideologically motivated and are using this topic as a cudgule to further their goals.
The "saturation" of CO2 is a nuanced element of the science that is well understood and does not change the accepted position that human emissions of CO2 are precipitously warming the earth. I was offering the animated graphic I posted to help you understand why this is the case.
You can't get around the basic fact that energy in = energy out, and when you add more greenhouse gases to the atmosphere the surface must warm. Functionally, the effect is occurring up higher in the atmosphere where CO2 is not saturated. When you add more CO2, the point where that occurs rises and, again, the surface sees a corresponding warming (per my graphic).


