Climate Science Glossary

Term Lookup

Enter a term in the search box to find its definition.

Settings

Use the controls in the far right panel to increase or decrease the number of terms automatically displayed (or to completely turn that feature off).

Term Lookup

Settings


All IPCC definitions taken from Climate Change 2007: The Physical Science Basis. Working Group I Contribution to the Fourth Assessment Report of the Intergovernmental Panel on Climate Change, Annex I, Glossary, pp. 941-954. Cambridge University Press.

Home Arguments Software Resources Comments The Consensus Project Translations About Support

Bluesky Facebook LinkedIn Mastodon MeWe

Twitter YouTube RSS Posts RSS Comments Email Subscribe


Climate's changed before
It's the sun
It's not bad
There is no consensus
It's cooling
Models are unreliable
Temp record is unreliable
Animals and plants can adapt
It hasn't warmed since 1998
Antarctica is gaining ice
View All Arguments...


Username
Password
New? Register here
Forgot your password?

Latest Posts

Archives

Temperatures Continue Up the Escalator

Posted on 8 January 2013 by dana1981

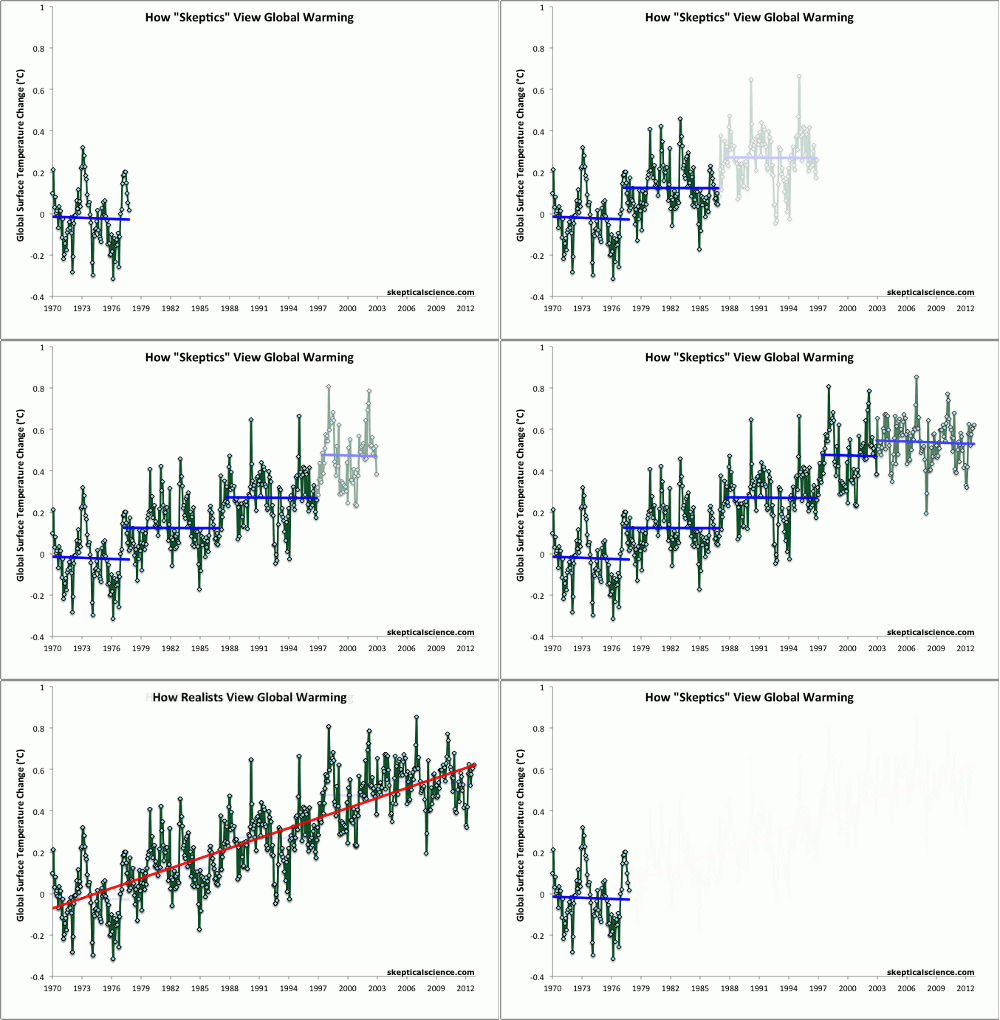
The Escalator has been one of Skeptical Science's most popular features since its inception just over one year ago.  Over the past year, it has been used in many climate myth debunkings, mainstream media stories, and most recently was even used by Senator Sheldon Whitehouse on the floor of the US Senate (the full transcript of the Senator's excellent speech can be viewed here).

The Escalator was also featured in the PBS documentary Climate of Doubt.  Both of these videos are hosted on the SkS YouTube channel.

And The Escalator was also featured in the rebuttals to the 2012 Golden Horseshoe Award (formerly the BS Award).

Bob Tisdale recently suggested some sort of Escalator-related impropriety because when he attempted to re-create the graphic, the slopes he found for the 'steps' were different than in the SkS version.  The reason for this is quite simple, the surface temperature dataset analysis methodologies are periodically revised, and Tisdale was using newer versions than were used in the previous Escalator graphics.

Below is an updated version of The Escalator using the most recent surface temperature datasets as of late December 2012, updated to include the monthly data through November 2012.  The timeframes for each 'step' are listed in the figure caption, and each step is the linear trend between those points.

Escalator

Average of NASA GISS, NOAA NCDC, and HadCRUT4 monthly global surface temperature anomalies from January 1970 through November 2012 (green) with linear trends applied to the timeframes Jan '70 - Oct '77, Apr '77 - Dec '86, Sep '87 - Nov '96, Jun '97 - Dec '02, and Nov '02 - Nov '12.

The global surface temperature trend from January 1970 through November 2012 (the red line) is 0.16°C per decade.

The Escalator page now also has links to images of the first and last frames, as well as the 'steps' and long-term trend combined in a single image.

Our hope is that the popularity of the Escalator will decline as a result of climate contrarians abandoning the absurd myth that global warming has stopped.  Then again, John Cook thought that Skeptical Science would be obsolete by now due to global warming denial becoming an untenable belief, so we suspect The Escalator will continue to be a useful myth debunking tool for some time to come, particularly since climate contrarians seem to prefer nitpicking the graphic to learning from it.

0 0

Printable Version  |  Link to this page

Comments

Comments 1 to 49:

  1. I have pointed numerous contrarians to the escalator, in other fora. Never do they seem to learn from it. The most common response has been a variation of "Skeptical Science is a warmist religious site, where argument is not allowed". Data know no religion, they just are what they are. The laws of physics are not Papal Bulls. Science is not faith: in fact, it is the opposite to faith. Sigh. This is faith that the high priests of denialism should ponder:
    Hosea 4:6 King James Version (KJV) 6 My people are destroyed for lack of knowledge: because thou hast rejected knowledge, I will also reject thee, that thou shalt be no priest to me
    0 0
  2. The problem for the movement to promote the hypothesis of catastrophic global warming is that the last step is the longest step. When will this last step break upward?
    0 0
  3. 1. AGW is referred to as "settled fact" by the US National Academy of Science (Pp. 44-45; free download after free registration). It is a robust theory, not an hypothesis. So try again. 2. It is your established wont to file a 1-off statement at odds with the science and/or the thread on which you place it. And to then not respond to the follow-up comments by others. Perhaps we should just ignore this current comment as the incipient ideological pap it purports to be, no?
    0 0
  4. The main value of Klapper's contribution is as a perfect example of the utter failure to comprehend the point of the graph that Doug is talking about. I don't think there is a way of presenting the facts that can convince such people; they merely serve as an illustration of how blinded you need to be to hold "skeptical" beliefs for anyone who immediately understands what the graph means. Personally, I also quite like showing how the recent temperatures fit well within the expected range of the earlier trend, like Tamino's gif, and I think John Nielsen-Gammon's method is an incredibly powerful way of illustrating why "the last step is the longest step":
    0 0
  5. Klapper perhaps you would care to wait until the last step has become sufficiently long that it provides statistically significant evidence of a discrepancy between the models and the observations, rather than fixate on periods to short to draw any useful conclusions? ... or even just statistically significant evidence that the underlying rate of warming has dropped?
    0 0
  6. Given the fact that there will always be noise obscuring the warming signal, Klapper and his type could simply move onto the next 'step' of the escalator and argue in 2020 that there has been no warming since 2014 and so on. Using this 'logic' one could continue arguing 'no warming since x' till alligators bask in a palm fringed arctic.
    0 0
  7. What Klapper fails to notice (one of several things, really) is that the Earth has continued to warm, and that warmth is going into the oceans. The Escalator is clearly labeled as "Global Surface Temperature Anomalies". Would it be possible to create an escalator that also took ocean heat content into account? Or could SkS always show the Escalator along with a graph of ocean heat so that we won't have to be subjected to comments along the lines of Klappers?
    0 0
  8. I've long stated to climate "skeptics" on the internet that, they might have something if global temps started to fall below the 2-sigma range of the trend. If that were happening then there would be some hard work to do to figure out why rapidly increasing CO2 levels was not translating into increased warming. BUT... That's not the issue. We are not outside the 2-sigma range and therefore we are still within the bounds of what is expected for GHG driven warming.
    0 0
  9. BWTrainer @7 - I did try to create a heat content escalator, but there's less noise in the heat content data, so it's hard to find any 'steps' longer than 3 years. Which is of course why denialists focus on the noisier surface temperature data.
    0 0
  10. In addition to what's been pointed, Klapper might be a little lazy. One can easily find longer periods of no warming or even slight cooling by carefully picking the end points. For instance, 1982-2002 shows no warming (I may be wrong by a smidge in the years, as this is pure eyeballing). It is hardly believable that some go for that tired nonsensical meme. Fake skepticism working its hardest...
    0 0
  11. In a way, the fact that the deniers seem to be putting all their eggs in the "16 years of no warming" basket could be a really good thing. We know, without any doubt, that surface temps are going to jump at some point to keep pace with the long term trend. Basic physics dictates it. It's just a matter of when the jump occurs. When that happens, it's game over for denial.
    0 0
  12. Meanwhile for you guys living down under in the great brown land of Oz, things are heating up and going up in flames. The French newspaper "Le Monde" has an article in the online edition reporting that the BoM had to add a new color to their temp maps because of the abundance of forecast temps above 50 deg Celsius. They mentioned a forecast 54 deg Celsius temp in the center of the country. http://bigbrowser.blog.lemonde.fr/2013/01/08/hors-limite-il-fait-si-chaud-en-australie-que-la-meteo-a-ajoute-une-nouvelle-couleur-a-ses-cartes/ Can you let us know if that materializes John? Not cooling too fast down there it seems...
    0 0
  13. And I thought the Texas summers of 10 years ago were bad...
    0 0
  14. A friend of mine, a biologist who lives near Perth, reported that one of the weather stations he has used in the past, about 4 hours east of him, reported 52C yesterday. Oi! This is why I *never* complain about a rare 39C day in Colorado, never mind it's a dry heat...;)
    0 0
  15. #11 (Rob): One could hope so, but remember that they did the same thing during the 2008 La Nina. Then we had 2010, but as long as the science side doesn't make a point of pointing it out, the anti-science side gets away with it time and time again. BTW, UAH lower troposphere temps is in record territory and way above 2010, (of course Spencer had to write a v5.5 to lower the warming) so a good chance of 2013 seeing a new record, but I would not be surprised if we saw a triple dip La Nina.
    0 0
  16. Phillipe, don't forget about the deadly cold snaps in India, China, and North Korea.
    0 0
  17. Suggestion for another escalator: sea level rise. Remember all the noise in the anti-science community last year, when sea level dropped somewhat from 2010 due to all that water being dumped on land (due to the La Nina).
    0 0
  18. In reference to Singer in the second video above: what happened to his so called "unstoppable global warming every 1500 years". Will the deniers ever make up their minds? Two years ago they claimed that we would cool drastically in the coming years due to the weak sun cycle, but now, they tell us that the heat is due to the strong solar activity. Why do they get away with this flip-flopping? If this got pointed out to the average Joe, the denialist community would suffer a serious blow, but it does not happen, so they keep on flip-flopping. Maybe CNN will, as they (at least Amanpour)have repeatedly pointed out/corrected visiting (real) scientist that the "other side" are deniers, not skeptics, as the often too polite scientist tend to call them. Hopefully more of the press will follow that exemple. Looks like it is happening, and the deniers don't like it one bit, thus their increasing desperation. They got spoiled when they used to have near total control of the press from late 2009 to early 2012.
    0 0
  19. Esop... I think the difference this time around will be that, people are now seeing more evidence this is happening, particularly in terms of extreme heat events. If (when) those heat events get worse, then a very large portion of the world's population is going to understand this is real and extremely serious.
    0 0
  20. Even with the great reduction in Arctic ice at it's minimum on Sept15, the Arctic is still mostly covered by ice for most of the year with the twin effects of reflecting solar radiation back into space and melting ice "keeping the cocktail cool". I wonder what the escalator will look like when the Arctic Ocean is ice free in, say, the beginning of July and the Arctic ocean can really start to accumulate some heat. Great that we have the escalator graph as a base line to compare with what is coming.
    0 0
  21. Esop @17 - you mean like this?
    0 0
  22. If the denial movement takes the last sixteen years of surface temperature data as proof of no measurable warming. Then they would have to admit this hypothesis was wrong four times in the forty years prior. Currently their delusion has just gone on for a bit longer this time. “Insanity is doing the same thing, over and over again, but expecting different results.” ― Albert Einstein
    0 0
  23. Concerning variability: interesting graph of temperature and nino/nina + volcanoes: Source: http://data.giss.nasa.gov/gistemp/graphs_v3
    0 0
  24. I don't Terranova. The difference is this: the weather events in India, China and Nort Korea are unusual, reaching or slightly breaking records established a number of years ago. What Australia is currently experiencing is beyond unusual; it's the bloody mother of all heatwaves, something of a magnitude that has never been recorded before. Just as I dislike to comment on sea ice before the September minimum, I won't elanorate beyond what's already obvious at this point. Let the Australian summer play itself out and then we'll tally heat and fire numbers.
    0 0
  25. #4 JasonB Regarding your ENSO effect graph, If you believe that 2013 will be ENSO neutral (the black points), the projection would be an anomaly record in the GISS dataset right? Of course there is a lot of variability but that would be the expection I think. We will know soon enough. On that topic The lastest Met Office long range forecast predicts 2013 will likely not be a record, maybe an anomaly of .35 against the 1971 to 2000 baseline (according to their published graph). If true this forecast will make the last step in the escalator even longer.
    0 0
  26. #10 Philippe Do you have a typo in your post? 1982 to 2002 is nowhere close to being an escalator "step" (showing no warming).
    0 0
  27. #22 Bert I've done a rolling 15 year linear regression on the HadCRUT4 dataset. The trend ending in 2012 is the slowest warming since the trend ending in 1980. The most recent 15 years is also slower warming than all trends calculated between about 1915 and 1950.
    0 0
  28. Klapper, I'm not really sure what your point is. Yes, we're in the midst of a period when virtually every natural surface temperature influence is acting in the cooling direction, and that is temporarily offsetting a lot of human-caused warming. And?
    0 0
  29. Krapper @ 25 If you are going to make claims, please provide some supporting links. The Met Office forecast is for a record in 2013.
    2013 is expected to be between 0.43 °C and 0.71 °C warmer than the long-term (1961-1990) global average of 14.0 °C, with a best estimate of around 0.57 °C, according to the Met Office annual global temperature forecast.
    See Hot Topic NZ for more details.
    0 0
  30. Klapper @ 27. Two questions: 1) How many of those 15-year regressions were statistically significant? 2) when you tested for statistical significance, did you do it for both an expected value of zero, and an expected value of the long-term warming trend?
    0 0
  31. Why 15 years, KLapper? You should have picked between 6 and 12 years. Those linears are all negative. Of course if you add but two years, you get almost double the 15-year linear. And why not use GISTemp, which covers the poles? I wonder what it all means.
    0 0
  32. Noting all the while that statistical insignificance isn't equal to general insignificance. After all, a trend of .083C per decade is still 20x the rate of Paleocene-Eocene Thermal Maximum warming.
    0 0
  33. Klapper O.K., try the trend in GISTEMP from 1979 to 1998, which the SkS trend calculator gives as 0.110 ±0.113 °C/decade (2σ), so there you have a period of about 19 years without a statistically significant warming trend. That shows that there is nothing that unusual about the current "hiatus". Now how about addressing the point of whether any of your analysis provides statistically significant evidence of the modelled trends being inconsistent with the observations, or whether there is statistically significant evidence of a change in the underlying rate of warming.
    0 0
  34. That's amazing Dikran, I hadn't noticed that you could get such a long stretch before, and it leads right up to the supposed "pause"! 1979 - 1998: 0.110 ± 0.113 °C/decade (2σ) 1979 - 2012: 0.158 ± 0.048 °C/decade (2σ) So in the 19 years prior to the point when global warming supposedly stopped, the trend was not statistically significant but had a most likely value of 0.110 °C/decade; after it supposedly stopped, the trend increased to 0.158 °C/decade and became very statistically significant. Hmm... Of course, the longer trend lies within the uncertainty interval of the shorter trend, so this isn't evidence that it's changed, merely a warning to those who would make the leap from "trend is not statistically significant" to "trend is 0", which is very different.
    0 0
  35. #21 (Dana): Yep, that is the one. Should add 2012 data.
    0 0
  36. @JasonB note that the SkS trend calculator properly accounts for the autocorrelation, so it is easier to find long periods with no statistically significant trend. For example, GISTEMP gives a statistically insignificant trend from 1996 to present using this method. The jump from "trend is not statistically significant" to the "trend is zero" is indeed invalid. If a trend is statistically significant, it just means that the observed trend would be highly unlikely IF the underlying trend was zero. So if it is insignificant, it just means that it would not be highly unlikely to observe the measured trend IF the underlying trend were actually zero. Note the conditionality, it only allows you to make statements about what you might or might not expect to see IF the underlying rate of warming was zero. Now you could make the subjective judgement (which is not compatible with the ususal frequentist hypothesis testing framework) that if the measured trend is not highly unlikely if the underlying trend were actually zero is equivalent to saying that the measured trend is evidence that it is possible that the underlying trend is actually zero. However, even then, the lack of a statistically significant trend only means that you can't rule out the possibility that the underlying trend is zero, which is hardly a ringing endorsement of the claim being made by the skeptics.
    0 0
  37. "Skeptics" generally say they expect cooling to start soon. So they should be more than happy to take evens for a bet about whether the current decade will be hotter than the previous one. But they aren't. So they don't really believe the warming will stop. They just pretend not to know what is causing it.
    0 0
  38. #28 Dana1981 My point is that the flattening in temperature growth is real. The Met Office prediction to the end of 2017 just recently published shows more sluggish growth. You make the point that all natural factors are working against warming right now. It is true that the average MEI is negative since 2000 or so which would suppress temperature growth (average about -0.1). It was also more strongly negative from 1950 to 1975 or so (-0.3). However, it was strongly positive from 1975 to 2000 (+0.4). Consider the possibility that if warming is being now suppressed by ENSO, it was being aided by ENSO in the period 1975 to 2000, so that some part of that warming is not due to GHGs. The problem for the AOCGCM models is that if there is a natural cycle in ENSO, they don't know about it. Therefore they are "tuned" to replicate the warming from 1975 to 2000 via feedbacks as if it is solely due to GHGs. If that is not true they are possibly overpredicting the warming rate going forward. I think my other point in posting here is to show your community that skeptics are not the simpleton thinkers they are made out to be on this forum. There should be room for alternative interpretations without generating the "fake skeptic/denier" type of name calling.
    0 0
  39. John @ 37... That's what I'm continually pointing out to skeptics. Where is the statistically significant cooling trend? Don't give me this "flat temps" stuff. Where is the actual cooling? Even the "mid-century cooling" trend from 1940 to 1970 is not statistically significant: GISTEMP -0.015 ±0.051 °C/decade (2σ).
    0 0
  40. Klapper... At risk of running off topic here, I would suggest that the reason those terms get used here frequently is because we are dealing with a wide range of people rejecting the scientific consensus on anthropogenic global warming. We address people who flat out reject the greenhouse effect. We address people who think CO2 is not a well mixed gas in the atmosphere. We address people saying that all the temperature records are doctored (except when they find something in the data that supports their preferred position). I could go on and on. There is skepticism inherent in the scientific process. SkS works hard to address the places where people are claiming to be "skeptical" but are, in fact, only working to reject the overwhelming scientific evidence. Those are fake skeptics, and in more extreme cases, deniers. (I can't think of any other way to accurately characterize someone who flat out rejects the radiative properties of CO2 other than to say they are in denial.)
    0 0
  41. #30 Bob Loblaw #32 DSL #33 Dikran ....statistical significance..... I didn't argue the latest 15 year trend was statistically significant (not for SAT anyway), however as this warming pause gets longer it may become so soon.
    0 0
    Moderator Response: [DB] At this point, per Dikran's and Philippe's summary comments below, this issue is now closed. Barring statistical significance testing by you for support, subsequent such claims by you will be moderated out due to "sloganeering".
  42. Klapper Whether you are aware of it or not, you are making exactly that claim when you say "My point is that the flattening in temperature growth is real". If you want to claim that the flattening is real (rather than being merely an artefact of the noise), you need to show that the observed trend is statistically inconsistent with the underlying rate of warming having remained the same, and the difference being down to noise. You have not done so, so you should not be making the claim.
    0 0
  43. This is a case of DNFTT. For fun we could also pick the 15 years periods with very high warming, there are quite a few. The same endless "conversation" happened with R.P. Sr. on the same subject, and he evaded every pointed question on significance. The way to treat these data are well known and when you do that, you obtain what the escalator shows. It's quite simple. Klapper's distraction is a pile of BS, just like R.P. Sr.'s argument. The issues of statistical significance and cherry picking of end points have been analyzed to death. Klapper's nonsense has been adressed adequately. Until he has something interesting to say, he should be ignored.
    0 0
  44. Klapper (at various points): "I didn't argue the latest 15 year trend was statistically significant" ...and therefore you are admitting that you have no justification for claiming that it is "real". "they [AOCGCMs] are "tuned" to replicate the warming from 1975 to 2000 via feedbacks as if it is solely due to GHGs" ...balderdash. Climate modelling does a very serious job in trying to include known significant forcings. What is your source for this claim? Whatever it is, you need to find better sources. "I think my other point in posting here is to show your community that skeptics are not the simpleton thinkers they are made out to be on this forum." ...you are not doing a very good job at this, either.
    0 0
    Moderator Response: [DB] Unless Klapper has new evidence passing statistical significance testing, this matter is now closed, as it detracts from the OP of this thread. Thanks to all participants for your efforts.
  45. While the discussion with Klapper has been entertaining (not), it is an incredibly clear demonstration of the very denial meme that the Escalator graph illustrates. A trend (particularly of a cherry-picked short term) isn't significant, isn't proven, isn't "real", unless there is enough data to separate either the longer term warming trend or the null hypothesis from the noise. Claims to the contrary indicate (IMO) ignoring statistics in favor of beloved talking points. And yet 'skeptics' repeat this myth, over and over again ad nauseum, claiming significance where it doesn't exist. The Escalator graphic is a fantastic, readily comprehensible debunking of the myth, and SkS is to be complimented for it.
    0 0
  46. I do agree that ENSO amplified surface warming in the '90s and dampened surface warming in the '00s. That's why we look at long-term trends rather than these short-term 'steps' which contain a lot of noise. As KR @45 notes, this discussion is a great demonstration of the Escalator.
    0 0
  47. Note also that we've got some excellent posts on this very subject that will be posted in the next day or so. Stay tuned.
    0 0
  48. Klapper @38, a person who is not a "simpleton thinker" does not stop their analysis when they have a convenient sound bite in support of their position. Thus, when they notice, for example, that the switch from generally negative ENSO conditions in the late sixties and early seventies to generally positive ENSO conditions may have contributed to the positive trend over that period (it did), they not only note that fact but find somebody who has quantified the effect; or if they have the skills, quantify it themselves. Doing so, they would find Lean and Rind 2012 and see that the ENSO contribution was minimal compared to the anthropogenic contribution to the rise in temperatures after 1975: (Note in particular the 1955-2005 contributions.) The problem is that while ENSO's contribution to global temperatures is large relative to the change in temperature due to AGW over short periods (say 16 years) it is small relative to the contribution over extended periods.
    0 0
  49. Hi Esop in # 18 above....Could you steer me toward the Fred Singer "Unstoppable Warming Every 1500 Years" thing? I will be giving a presentation a few months from now at a place where they will probably throw that one by Singer at me as a question.
    0 0

You need to be logged in to post a comment. Login via the left margin or if you're new, register here.


The Consensus Project Website

THE ESCALATOR

(free to republish)


© Copyright 2024 John Cook
Home | Translations | About Us | Privacy | Contact Us