


 Arguments


Rose and Curry Double Down on Global Warming Denial
Posted on 23 October 2012 by dana1981
David Rose and Judith Curry have doubled down on literal global warming denial, as they continue to deny that the planet is warming. On 13 October 2012, Rose first published an article in the British newspaper the Mail on Sunday claiming that global warming stopped 16 years ago. As we subsequently demonstrated, the article was riddled with errors, its main problem being in a false equivalence between rising global surface temperatures and global warming. In reality a very small fraction of overall global warming goes into heating surface air temperatures, whereas over 90% goes into heating the oceans. As we noted, Nuccitelli et al. (2012) had pre-bunked Rose's article by showing just days earlier that the overall heating of the planet has not slowed (Figure 1).
 Figure 1: Land, atmosphere, and ice heating (red), 0-700 meter ocean heat content increase (light blue), 700-2,000 meter OHC increase (dark blue). From Nuccitelli et al. (2012).
Rather than acknowledge and correct their mistakes, Rose and Curry coordinated on a follow-up Mail on Sunday article published on 20 October 2012 (which Curry calls "well done") which repeated much of their previous misinformation and added a few new misconceptions for good measure.
Denying Climate Physics
The misconception that global warming has stopped is based on a lack of understanding of the physics of the global climate system. When the Earth has an energy imbalance (more incoming than outgoing energy) as is currently the case (due to the increased greenhouse effect), the planet must warm in order to restore an overall energy balance. Short-term effects can only stave off that warming for a short period of time. Thus we know from basic physics that the current slowed rate of global surface warming cannot last indefinitely.
In this context, Rose quotes Curry making an argument that strains credulity:
"If we are currently in a plateau and possibly headed for cooling, then sometime in the middle of the century we would likely see another period with a large warming trend."
Given the large and growing global energy imbalance, it is simply not remotely plausible that the natural variability in the climate system could offset the inevitable global surface warming (let alone cause cooling) for another three decades. As discussed below, even with virtually every major natural temperature influence aligning in the cooling direction over the past decade, surface temperatures have still warmed.
Physics will not be denied.
Denying Global Surface Warming via Cherrypicking
Rose's new article essentially doubles down on his original assertion that global surface temperatures have not warmed in 16 years, which he tries to defend with a new quote from Judith Curry:
"Nothing in the Met Office’s statement . . . effectively refutes Mr Rose’s argument that there has been no increase in the global average surface temperature for the past 16 years."
Curry's assertion is easily disproven by once again examining the Met Office statement:
"The linear trend from August 1997 (in the middle of an exceptionally strong El Nino) to August 2012 (coming at the tail end of a double-dip La Nina) is about 0.03°C/decade, amounting to a temperature increase of 0.05°C over that period, but equally we could calculate the linear trend from 1999, during the subsequent La Nina, and show a more substantial warming."
While 0.05°C is a small increase, and not statistically significant, the Met Office has nevertheless shown that average global surface temperatures most likely increased over the 15 (not 16) year period from August 1997 to August 2012. Additionally, as statistician Tamino at the Open Mind blog put it, choosing mid-1997 as a starting point for this analyis is "not just cherry-picking, it’s championship cherry-picking."
"If [Rose] could prove, statistically, that the previous warming trend stopped (or even slowed) around that time, then choosing mid-1997 to start an analysis would be legitimate. But he can’t. Because it didn’t. And then of course there’s the pesky fact that he didn’t even try."
Tamino examines what the surface temperature data would have looked like had the 1975 to 1997 global surface temperature trend continued at the same rate from 1997 to 2012 (Figure 2).
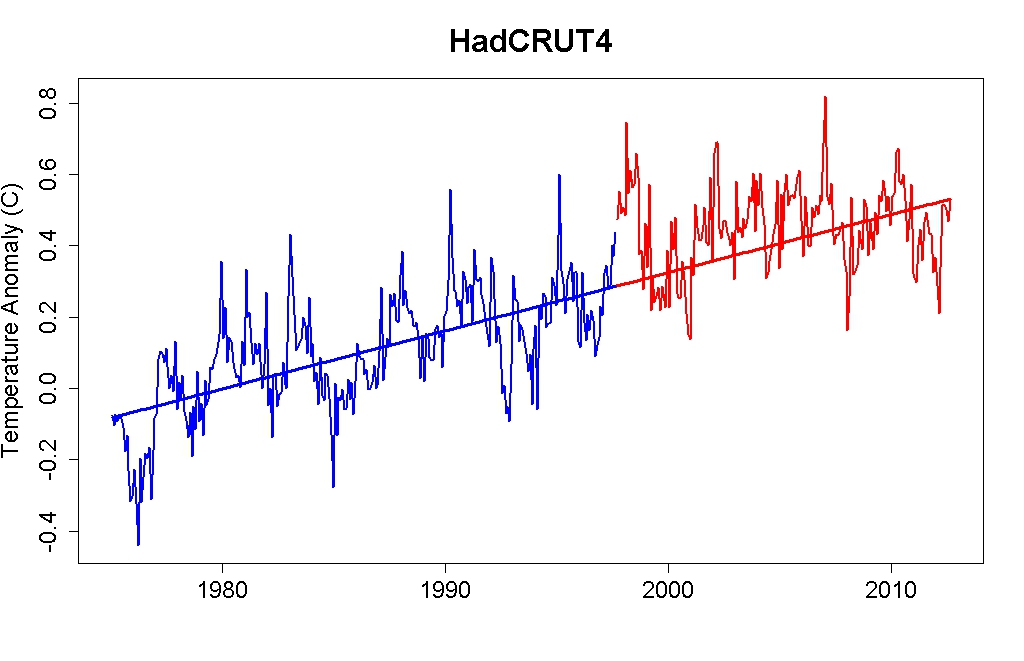
Figure 2: HadCRUT4 global surface temperature data from 1975 to mid-1997 fitted with a linear trend (blue), and from mid-1997 to mid-2012 with an extention of the same 1975 to 1997 trend (red).
What this figure shows is that in 1997-1998 there was a very strong El Niño event which caused a large short-term jump in global surface temperatures, which makes it possible to cherrypick start and end points to find whatever short-term trend one would like. However, the long-term global surface warming trend has remained fairly steady.
It is true that over the past decade the rate of global surface warming has slowed. As we noted in our response to Rose's previous article, this is precisely what we would expect to occur during a decade when aerosol emissions (which cause cooling by blocking sunlight) have risen, solar activity has been low, there has been a preponderance of La Niña events (which also cause short-term surface cooling), and heat has accumulated in the deep oceans. However, the human-caused global surface warming signal is still peeking out from beneath these short-term cooling influences. Unfortunately this is another fact which Curry and Rose deny in their new article.
Identifying the Human-Caused Global Surface Warming Trend
In a study last year, Foster and Rahmstorf (2011) attempted to measure the human-caused global surface warming signal by statistically removing the short-term influences of the El Niño Southern Oscillation (ENSO), changes in incoming solar radiation, and changes in volcanic activity. Figure 3 shows the data before and after their analysis.

Figure 3: Five temperature datasets (with a 12-month running average) before and after the statistical filtering of ENSO, solar activity, and volcanic activity by Foster and Rahmstorf (2011).
Thus Foster and Rahmstorf (2011) showed that beneath these short-term variations, the human-caused global surface warming signal has remained very steady. However, Judith Curry apparently objects to this type of analysis. According to Rose's new article,
"Prof Curry said that stripping out these phenomena made ‘no physical sense’. She added that natural phenomena and the CO2 greenhouse effect interact with each other, and cannot meaningfully be separated. It’s not just that the ‘cold mode’ has partly caused the plateau.
According to Prof Curry and others, the previous warm Pacific cycle and other natural factors, such as a high solar output, accounted for some of the warming seen before 1997..."
Frankly this is a rather bizarre and self-contradictory argument. Curry first says that the temperature influences of ENSO and CO2 cannot be separated (which is incorrect - that is exactly what the Foster and Rahmstorf analysis did), and then she confidently claims that ENSO caused some of the pre-1997 warming. Which is it - can natural and human factors be separated or not?
The answer is that Curry's second statement is mostly correct. There were more El Niño events than La Niñas in the 1990s, and vice-versa in the 2000s (however, it is not true that solar activity was particularly high prior to 1997). There was also some global brightening in the 1990s and global dimming in the 2000s due to changes in human aerosol emissions and global cloud cover.
In short, factors other than human greenhouse gas emissions amplified the observed surface warming in the 1990s and dampened it in the 2000s. Foster and Rahmstorf showed that when we filter these influences out, the underlying human-caused surface warming trend has been very steady. We just happen to be in the midst of a period when virtually all natural effects are acting in the cooling direction. Despite all of the cooling effects discussed above, average surface temperatures have continued to rise slowly, which is a testament to the strength of the human-caused surface warming trend.
Denying Ocean Warming
In his new article, Rose does finally acknowledge the warming of the oceans illustrated in Figure 1, but only long enough to deny it.
"Other scientists say that heat has somehow been absorbed by the waters deep in the oceans. However, the evidence for this is contested, and there are no historical records with which to compare recent deepwater readings."
The ocean heat content data used by Nuccitelli et al. (2012) in Figure 1 originate from Levitus et al. (2012). It is certainly true that ocean heat content measurements in the past are sparser than measurements today, but Rose is incorrect to claim that there are no historical records. Past ocean heat content measurements were obtained from bathythermographs - instruments which have a temperature sensor and are thrown overboard from ships to record pressure and temperature changes as they drop through the water. Levitus et al. showed the uncertainty range in the ocean heat content data over time (vertical red lines in Figure 4).

Figure 4: Time series for the World Ocean of ocean heat content (1022 J) for the 0-2000m (red) and 700-2000m (black) layers based on running pentadal (five-year) analyses. Reference period is 1955-2006. Each pentadal estimate is plotted at the midpoint of the 5-year period. The vertical bars represent +/- 2 times the standard error of the mean (S.E.) about the pentadal estimate for the 0-2000m estimates and the grey-shaded area represent +/- 2*S.E. about the pentadal estimate for the 700-2000m estimates. The blue bar chart at the bottom represents the percentage of one-degree squares (globally) that have at least four pentadal one-degree square anomaly values used in their computation at 700m depth. Blue line is the same as for the bar chart but for 2000m depth. From Levitus et al. (2012)
As Figure 4 shows, there is of course more uncertainty in the past ocean heat content measurements than the more recent data, but the rapid increase in ocean heat content is nevertheless very clear and much larger than the margin of error. The oceans and planet as a whole have warmed an immense amount, with the equivalent energy of 2 Hiroshima atomic bomb detonations accumulating in the world's oceans every second since 1961, and 3 detonations per second over the past decade. This is the immense global warming that Rose and Curry are denying.
Misunderstanding Climate Models
Curry and Rose continue to misunderstand climate model projections in their latest article.
"The 2007 Fourth Assessment Report of the UN Inter-governmental Panel on Climate Change (IPCC) said: ‘For the next two decades, a warming of about 0.2 degrees Celsius per decade is projected for a range of emission scenarios’ – a prediction it said was solid because this rate of increase was already being observed.
But while CO2 levels have continued to rise since 1997, warming has paused. This leads Prof Curry to say the IPCC’s models are ‘incomplete’, because they do not adequately account for natural factors..."
As we noted in our respose to Rose's previous article, the 0.2°C per decade surface warming projection from the IPCC is the average of all of their model simulations (a.k.a. the multi-model mean), which is why the IPCC used language like "about 0.2°C". The model runs in which natural effects had a short-term warming influence over the next decade or two simulated more than 0.2°C per decade surface warming, while the model runs in which natural effects had a short-term cooling influence simulated less than 0.2°C per decade surface warming.
We currently cannot predict oceanic cycles like ENSO very far in advance; thus, some model simulations contain a short-term warming influence from these sorts of natural cycles, and others contain an associated short-term cooling influence. When the model runs are all averaged together, those natural warming and cooling effects average out. Thus the 0.2°C per decade multi-model mean projection does not include ENSO effects.
If there are more El Niño events over a given decade, as in the 1990s, the surface warming will probably be larger than the expected 0.2°C, and if there are more La Niñas, as in the 2000s, the surface warming will probably be less than 0.2°C. In both cases that is precisely what we observed, and Rose is therefore wrong to suggest that climate models are unreliable based on the slower surface warming over the past decade. Quite obviously there is no such thing as a perfect model, but global climate models are very useful tools which have made some accurate predictions thus far.
Future Global Warming
Rose also misrepresents the IPCC and underestimates future global surface warming.
"For the world to be two degrees warmer in 2100 than it is now – as the IPCC has predicted – warming would not only have to restart but also proceed much faster than it has before."
In reality the IPCC produces a range of global surface warming projections based on a number of different emissions scenarios. The amount of warming between now and 2100 ranges anywhere from about 1°C to 6°C (grey bars in the right margin of Figure 5).

Figure 5: Global surface temperature projections for IPCC Scenarios. Shading denotes the ±1 standard deviation range of individual model annual averages. The orange line is constant CO2 concentrations at year 2000 values. The grey bars at right indicate the best estimate (solid line within each bar) and the likely range. (Source: IPCC).
Limiting global surface warming over the next 90 years to 2°C, which would blow past the internationally-accepted 'danger limit', would require humans to follow one of the IPCC scenarios in which we significantly reduce our greenhouse gas emissions. A continued business-as-usual path (roughly Scenario A2) will result in 3 to 4°C warming between now and 2100. The only way we can avoid accelerating global warming is to take major steps to reduce human greenhouse gas emissions.
Current vs. Medieval Warmth
Rose also briefly mentions two recent studies which he purports show that the Medieval Warm Period (MWP) was warmer than today. This is a misrepresenation of both studies, neither of which are global or even full northern hemisphere temperature reconstructions, and which do not include the rapid surface warming over the past ~40 years shown in Figures 2 and 3 above.
Rose is also undermining his own argument that future global warming is of little concern, because if the MWP were particularly hot, it would mean that the climate is very variable and sensitive to changes in the global energy imbalance. Future global warming will only be small if the climate has a low sensitivity to changes like increasing solar activity or atmospheric greenhouse gas levels. By arguing for a hot MWP, Rose is scoring an own goal - he is arguing with himself.
Summary of Rose and Curry Denial
To sum up, rather than admit the errors they made in their first Mail on Sunday article, Rose and Curry have doubled down on their previous mistakes and added a few new ones.
- They continue to ignore that the 90+% of global warming that has gone into heating the oceans has not slowed or "paused", as most recently illustrated in Nuccitelli et al. (2012).
- They fail to understand the fundamental physics of the climate system - that when there is a global energy imbalance, warming is an inevitable response, and natural variations in the climate system can only offset that warming for so long.
- They continue to cherrypick convenient dates in their surface temperature data analysis.
- They claim that natural temperature influences like ENSO are responsible for some of the global surface warming in the 1990s (which is true), but deny that they are responsible for the slowed rate of surface warming in the 2000s (which is also true).
- They deny the existence of historical ocean heat content measurements.
- They misunderstand and thus misrepresent global climate model simulations.
- As a result of these errors, they wrongly downplay future global warming.
- Rose also scores an own goal by essentially arguing for large future warming by claiming the MWP was hot, which would suggest the climate is sensitive to changes in the Earth's energy imbalance.
Overall Rose and Curry would do well to learn from the many critiques of their erroneous analyses rather than doubling down on their errors and continuing to propagate misinformation in the process.


Last link in article is broken, I believe this is the correct one: https://www.carbonbrief.org/this-weeks-top-six-rebuttals-to-david-roses-warming-has-stopped-claim