Climate Science Glossary

Term Lookup

Enter a term in the search box to find its definition.

Settings

Use the controls in the far right panel to increase or decrease the number of terms automatically displayed (or to completely turn that feature off).

Term Lookup

Settings


All IPCC definitions taken from Climate Change 2007: The Physical Science Basis. Working Group I Contribution to the Fourth Assessment Report of the Intergovernmental Panel on Climate Change, Annex I, Glossary, pp. 941-954. Cambridge University Press.

Home Arguments Software Resources Comments The Consensus Project Translations About Support

Bluesky Facebook LinkedIn Mastodon MeWe

Twitter YouTube RSS Posts RSS Comments Email Subscribe


Climate's changed before
It's the sun
It's not bad
There is no consensus
It's cooling
Models are unreliable
Temp record is unreliable
Animals and plants can adapt
It hasn't warmed since 1998
Antarctica is gaining ice
View All Arguments...


Username
Password
New? Register here
Forgot your password?

Latest Posts

Archives

Common graphical tricks and the Medieval Warm Period

Posted on 29 April 2010 by MarkR

The Hockey Stick is a climate celebrity and skeptics have their own graphs that ‘show’ it is wrong. One of the most common is from the 1990 IPCC report, showing the Medieval Warm Period or MWP.
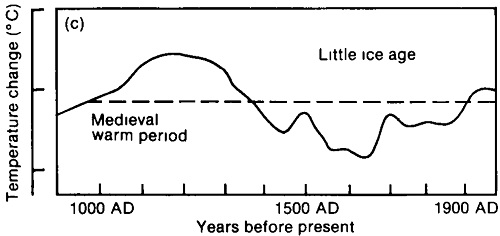

Figure 1 – IPCC First Assessment Report estimate of temperature changes in Europe from 900AD onwards.

This is how it appeared in Durkin’s The Great Global Warming Swindle:
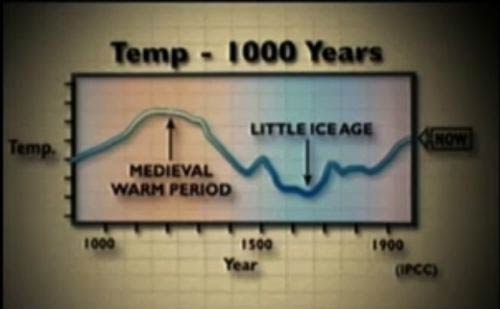
Medieval Warm Period from Great Global Warming Swindle
Figure 2 – Shot of the same IPCC graph slightly modified to be shown in The Great Global Warming Swindle

The conclusions of most recent studies are that the MWP was on average cooler than today, but The Great Global Warming Swindle, blogs and industry think tanks say otherwise, often based on graphs like this. It appears to be modified from Lamb 1965:
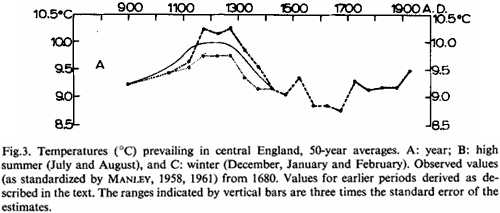
Central England Temperature 

The data is for central England and from 1680 it uses the 50 year average of the HadCET thermometer record. Thankfully, the HadCET record has carried on since that graph finishes (around 1920), so we can find where ‘NOW’ really is. In Figure 4 we have HadCET with 10 year averages (dotted line) and 50 year averages (solid line). We continue the 50yr line and find that it’s now about 0.35C warmer than Lamb’s last point. However, global warming only really kicked off around 1980, so we’ve still got 20 years of no global warming in the 50yr average and it seems pretty fair to take a look at something that would catch suspected global warming – like the 10 year average. This has risen by just over 1 °C since Lamb’s last measurement.
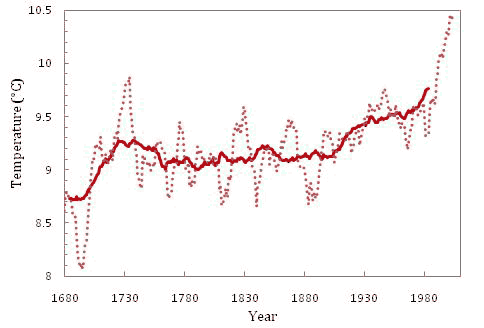
HadCET data since 1680 with 10 year and 50 year running mean
Figure 4 – HadCET data since 1680 reported as a 10 year running mean (dotted line) and as a 50 year running mean (solid line)

So when you see that graph with ‘NOW’ marked on the right hand side, they are telling you that the temperature now is the 50 year average centred on the 1920s. As someone living in the 2000s, you probably think that’s a bit silly. The temperatures of the 2000s would be the upper ‘NOW?’ on figure. The lower ‘NOW?’ is the latest 50yr average.

HadCET temperature compared to current temperature
Figure 5 – Where are we now? The lower box and line is the latest 50 year average in HadCET to be consistent with the rest of the graph. This, however, misses much of the period thought to be associated with global warming. The the latest 10 year average captures this and is just off the chart.

The Great Global Warming Swindle and every other skeptical source that shows you this graph and claims it shows that the MWP was warmer than today is not giving you the full picture. They are showing you evidence that central England was warmer around 1200AD than it was around 1920. They are showing you that the last decade was warmer than any 50 year period on the graph including the MWP.

Many similar graphs are loved by skeptical sites, but this is a useful demonstration because it contains all 3 of the common ‘tricks to hide the incline’ of global warming. Firstly they change the temperature scale and/or hide the values. Next they pick a single region, and finally they either cut off or ignore instrumental evidence showing recent warming.

There appears to be plenty of evidence for some places being warmer than today in the MWP, and whilst most studies say that globally it wasn’t warmer it seems that scientists still want more data to be sure (and if it was warmer, that might suggest higher climate sensitivity). The important thing is being able to properly interpret the evidence that arrives – which involves spotting the misleading half-truths by the likes of Martin Durkin.

0 0

Printable Version  |  Link to this page

Comments

Prev  1  2  

Comments 51 to 60 out of 60:

  1. Mike, > may I ask you how many times a politician has to tell you they saved the planet from global economic collapse for you to believe them? If they have hundreds of rigorous scientific studies and empirical data to back their claim, then once will suffice. > Repetition of the same assertions which are not believed do not and should not increase belief in those assertions. Scientific studies are not assertions, they are examinations of empirical reality using the most objective and effective technique available to humanity: the scientific method. Ironically, a lot of "skeptic" arguments are nothing more than a repetition of assertions, your post being a great example. If you have some specific complaints or questions about the science, please review the list of skeptic arguments on this site, and place your comments under the appropriate post (if you are truly interested in the answers, you should probably read the post as well). > science is inherently sceptical and requires those making assertions to prove what the say; it does not require the sceptic to disprove it! Hence the multitude scientific studies that overwhelmingly support AGW.
    0 0
  2. #48 Mike "It is not the number of reports that matter, it is the quality and impartiality of those reports and so long as we continue to read reports that are clearly biased in that they fail to acknowledge simple things like urban heating, the poor siting of sensors or simple statistical facts like the cooling this century or that if there were warming it would have considerable benefits by reducing the number of cold related deaths in Norther latitudes." Each of these points has not only been "acknowledged," but addressed. Repeatedly. On urban heating, see Are surface records reliable?. On the cooling this century, see Is global warming still happening?. On cold-related deaths, see here.
    0 0
  3. 45.Jeff Freymueller You can put me straight on this as I haven't followed the history but my understanding is that the attack on the Hockey Stick was originally a scientific one. McIntyre and others have questioned the validity of either the statistics and/or the appropriateness of the series used. From my understanding this critisism is completely rejected by Mann and other pro-warmers, the fact that these critisisms do not seem to shape IPCC is worrying. 47.Marcel Bökstedt Sorry for my lack of accuracy but you'll have to explain to me how "mostly above the 1901–1995 climatology" is substantively different to "as warm as now"? Of the 6 SH proxies used by Mann 2009 to prove the whole of the SH did not participate in medievel warming 3 are located in the tropics and 2 of them are sediment record. Using your criteria we are down to 3 proxies in the SH (Tasmania, New Zealand and Southern Africa) which prove there was no global MWP! The IPCC uses the Hockey Stick by to say that the present climate conditions are unique compared to the rest of the last 2 millenia, and that this must be due to anthropogenics CO2. My argument would be that there are sufficient proxies that put the present conditions at the top end of the range of natural variation.
    0 0
  4. #53 HumanityRules, we might disagree whether McIntyre a politically motivated or not, but even if you think he is not, there have been plenty of attacks that clearly are. For example, several years ago Rep. Joe Barton sent out letters demanding all sorts of material from Mann's employer, and the new and very radical right-winger Attorney General of Virginia has just done the same (Mann used to work at the U. of Virginia). Then there are all the blogosphere attacks on top of that. But you asked about McIntyre's criticism. The first I had heard of this whole issue was in 2005 when McIntyre and McKitrick had a paper published in Geophysical Research Letters that suggested an artificial hockey stick-like shape could be introduced by a feature of the Principal Component Analysis that Mann et al. used. But there were two comments published on the paper (I thought I remembered a third, but I can't find it). M&M had replies to the comments but I found the replies to be weak, and I think the comments were on the mark. The comments both showed that while Mann et al were technically in error in their application of PCA, the error actually had little impact on the results. In fact, the analysis was later redone with the error corrected, and this was shown to be true -- the error had little impact. I found freely downloadable PDFs of the comments, links below (not sure about the replies). Von Storch and Zorita used climate models to generate a synthetic set of proxy data that they analyzed with the original and corrected method. The difference was not significant. Huybers showed that the reason M&M found a significant artificial hockey stick effect was that M&M themselves made a statistical error. Their Monte Carlo simulation were not adjusted to match the variance of the instrumental record. This led them to significantly overestimate the reduction of error statistic, and led to an exaggerated artificial hockey stick effect relative to the actual Mann et al. method. When Huybers corrected this error by M&M, the M&M code gave results very similar to Mann et al. Bottom line: yes, there was an error in the original 1998 paper, but it made almost no difference to the result. McIntyre claimed it made a big difference, but only because his own approach was in error and exaggerated the effect. The error has long since beeen corrected. There has also been a vigorous scientific debate about that 1998 paper, and in the whole field, and of course today the work being done has advanced quite a ways since then (improved methods, more data). But the result is still standing.
    0 0
  5. HumanityRules> Even if I'm not completely sure what they do mean with the expression, I assume that "mostly warmer than the 1901-1995 climatology" means something like "warmer than the average temperature in the period 1901-1995". But because of global warming it is now warmer than the 20 century average, and the diagrams of the paper do suggest that the temperature in the middle ages might have been lower than the temperature today.
    0 0
  6. SNRatio wrote 30 April "With ca 0.15 degC warming/decade, it will just take a few decades for us to leave MWP territory altogether." Dr Jones admitted in a recent BBC interview that there has been a slight cooling since 2002 and statically not significant warming since 1995 (I seem to recall). So we are on a current temperature downturn and the sun is still quiet. Is it actually possible that we might return to Maunder minimum terrritory instead? As an interested retired businessman I read both sides of the arguments and frankly I do not think that AGW supporters or sceptics really know what will happen next to global temperatures. I must admit I tend to lean towards the views held by such individuals as Dr Roy Spencer and Professor Lindzen that there may be a week warming signal caused by CO2 but natural variations in climate have the ability to overpower such a signal. For those believing that CO2 has this strong influence on global temperatures it is worth while reading the recent interview with Dr. Fred Goldbereg in People's Daily. http://english.people.com.cn/90001/90777/90853/6959757.html Frankly there seems to be a long way to go before the climate science community know enough to exhort us to pull up the wallet and deliver billions of dollars to "saving the World". Just think of the AGW understanding of the behaviour of clouds and the lack of modelling of this behaviour in current climate models.
    0 0
  7. alphaomega, the breadth of your comments makes me think you would benefit from and enjoy reading the overview by cce titled The Global Warming Debate. I suggest you read that before diving into the details that are in the following links. alphaomega wrote the following italicized and quoted things. For each, I've responded by linking to the appropriate post here on the Skeptical Science site. alphaomega, if you want to discuss any of those topics, those threads are the appropriate places to do so. Not on this thread, where your comments likely will be deleted for being off topic. "Dr Jones admitted in a recent BBC interview that there has been a slight cooling since 2002 and statically not significant warming since 1995." See Phil Jones says no global warming since 1995. Also see It’s cooling. "So we are on a current temperature downturn and the sun is still quiet. Is it actually possible that we might return to Maunder minimum terrritory instead?" See We’re heading into an ice age. "I do not think that AGW supporters or sceptics really know what will happen next to global temperatures." See Models are unreliable. "There may be a week warming signal caused by CO2 but natural variations in climate have the ability to overpower such a signal." See Models are unreliable. Also see CO2 is not the only driver of climate. And then CO2 effect is weak. "It is worth while reading the recent interview with Dr. Fred Goldbereg." (This one is not a post on Skeptical Science.) Goldberg is not a climatologist. His expertise is in welding.
    0 0
  8. Just as an aside --- the Hockey Stick is the Maginot Line of climate science. Those attacking it and those defending it are both wasting their attention. It's the last war, folks. It's over. It's long ago. Look at what's really happening now in the real world. The people interested in wasting your time are very happy to sit on their assets in the dark typing madly into their computers refuting and rebutting and rebaloneying. Because why? Because they want you sitting at your computers replying to them. It's crap. It's nonsense. The world's changing fast outside. They don't want you to do anything. They want you to sit at your computer typing. Can you tell I'm about to go do fieldwork? Got a little soil restoration project I bought more than 20 years ago, that needs about 200 years of attention to put the skin back on the mountainside (loggers, goats, fires, loggers, fires, motorcycles, offroad 4wders -- everything people do strips soil off the mountains). Patience helps it grow back. Humble suggestion: go compost something and dig it into the yard. Look around. They don't want you to leave your computer.
    0 0
  9. End of Lambs T-t graph: mentioned to be around 1920. I got another value of 1905. Does anybody know the sources of the two values?
    0 0
  10. Mark, Great post, it would be nice to include the deception used on page 34 of the (perhaps soon to be withdrawn) Wegman Report. Reference http://rabett.blogspot.com/2010/10/dummys-guide-to-strange-scholarship-in_17.html
    0 0

Prev  1  2  

You need to be logged in to post a comment. Login via the left margin or if you're new, register here.


The Consensus Project Website

THE ESCALATOR

(free to republish)


© Copyright 2024 John Cook
Home | Translations | About Us | Privacy | Contact Us