


 Arguments


Climate Bet for Charity, 2013 Update
Posted on 27 November 2013 by Rob Honeycutt
A couple of years ago I happened upon a German "climate contrarian" website called NoTricksZone run by Pierre Gosselin. While reading through one particular post I made an off-hand comment that I'd never found a skeptic who would put their money where their mouth is related to climate.
Well, Pierre took that as a challenge and we got together to create a gentleman's climate bet with proceeds going to a charity of the winner's choice. (Correction: As Tom points out in the commens the terms state, "...the charity organisation is yet to be chosen, but will (1) be one that both sides agree on, (2) help children in dire need (3) have low overhead and (4) be international.") That was back in early 2011. It became the Climate Bet for Charity, subtext: "Will the next 2011-2020 decade be warmer than the previous 2001 – 2010 decade?"
To date, climate realists have put up a total of $5200 and the climate skeptics have put up $2000. So, already, my original claim is holding true, that skeptics are generally not willing to put their money where their mouths are. (Yes, bets are meant to include a bit of taunting. I'm perfectly willing to keep with that time honored tradition.)
A Third Party Tracking
The other day I was surprised to find a third party had created a chart to track the progress of the bet, and even further surprised that they were gloating over the current decade running cooler than the last.
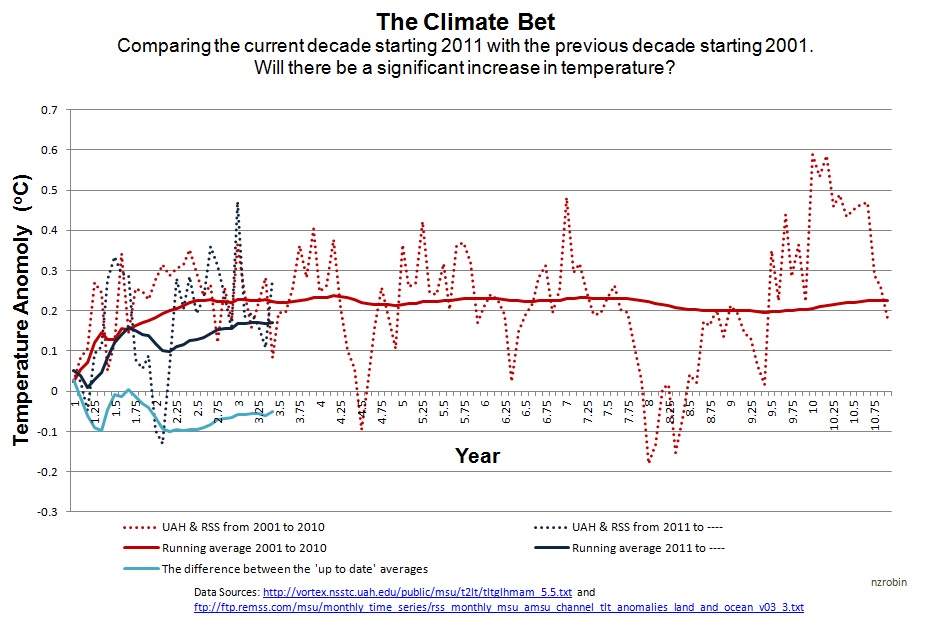
Fig 1 - Graph created by "KiwiThinker"
I had a hard time making out exactly what they were tracking here at first. Initially it looked like they were merely tracking the monthly average of the past decade relative to the current decade, which is not what the bet is. And I made several erroneous comments to that effect.
I pulled up the UAH and RSS lower tropospheric anomalies through WoodForTrees.org and did the calculations myself. Sure enough, the average of UAH and RSS for the 2001-2010 decade comes out at 0.226C. The current 2011-present decade is running at 0.173C. That's 0.053C below the last decade, based on, yes, three years of data. So, they actually do have this much correct.
Convenient Start Point
When I dug deeper into the data I found this interesting tidbit. The monthly figure for Dec 2010 is 0.179C and the monthly figure for Jan 2011 is 0.052. So, right when we start their graph we have a large month-to-month temperature drop. That means all our initial running average data points are going to be heavily influenced.
As a test, I created by own graph. One data set I pulled the start point back 4 months to demonstrate the influence of the start point. This is not to suggest we change the start point, it's just to show that the start point is going to be misleading. In fact, since we're averaging so few data points in the early phase of the of the chart, it's going to be mostly just noise. It doesn't tell us anything meaningful at all.
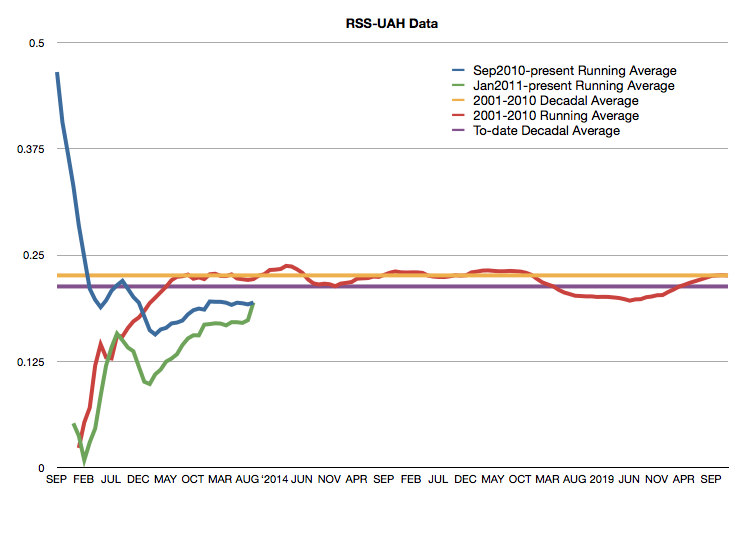
Fig 2 - Reworking the climate bet chart.
The blue line in this chart shows us what happens if we move the start point back just 4 months relative to the green line, which is the start of the actual bet. The red line is equally meaningless since it is also relying on only a small amount of data and is going to be highly influenced by the general month-to-month noise in surface temperature data. Each of these three are cumulative running averages. As such, since they rely on less data, everything to the far left of the chart is noise. As we move toward the right end of the chart we start to see the actual signal.
Probably the best way to watch the progress of this bet would be to compare the 2001-2010 decadal average to the "to-date" decadal running average (currently Oct 2004 2003 to Sept 2013). I've added this in as the purple line, where the difference is only 0.013C.
Challenges Ahead
When we originally initiated this bet I was of the opinion that the satellite data was probably the most reliable data to use. Since then I've learned a few things about how the satellite data is compiled and the challenges that are involved.
For one, satellites are not thermometers. They're measuring a proxy of temperature by way of upwelling radiances collected by microwave sounding units (Uddstrom 1987). That data has to then go through significant processing to infer temperature. Even the two groups currently putting out satellite temperature data have data that disagrees, even though the data is coming from the same sources. And ironically, "skeptic" researcher, Roy Spencer's UAH data is current showing a higher rate of warming than RSS. Eventually that divergence has to be accounted for with an adjustment from one group of the other. Hopefully that will get resolved in a way that won't complicate the results of our bet.
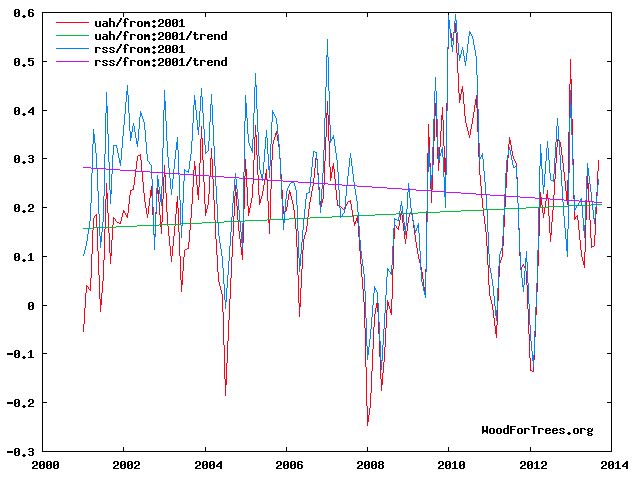
Fig 3 - Divergence between RSS and UAH data
SkS has an excellent primer on satellite temperature measurements here that I highly recommend. Again, the bet is set, so I wouldn't think to suggest changing the terms. I'm now of the personal opinion that GISS is likely the most accurate data set being that it has the greatest coverage for the Arctic, where we're seeing the greatest warming. A warming pattern that is, incidentally, consistent with AGW theory.
A Double Down Probably Not In The Cards
Since the "skeptics" seem so confident in their position I was thinking this would be great opportunity to double down on this bet, but that's when I realized, even if they doubled down they still wouldn't have put up as much as the realists already have in. All those $10 skeptics would have to pony up a whole $40 bucks to quadruple their bets to force the realists to double their bet.
I'm, frankly, not at all concerned whether the climate realist side will win this bet. The bet is based on a full decadal average rather than where any given year falls. My own best guess is, barring a major low latitude volcanic event before 2020, there is a >95% chance that this decade will end up being warmer than the last. Physics is on our side. You just can't add 2.3Watts/m2 of man-made radiative forcing (source) to the climate system and believe the planet is not going to warm.
I've come to liken the "skeptic" position as suggesting we pop the turkey into the oven to keep it cool until Thanksgiving day.
- - - - - - - - - -
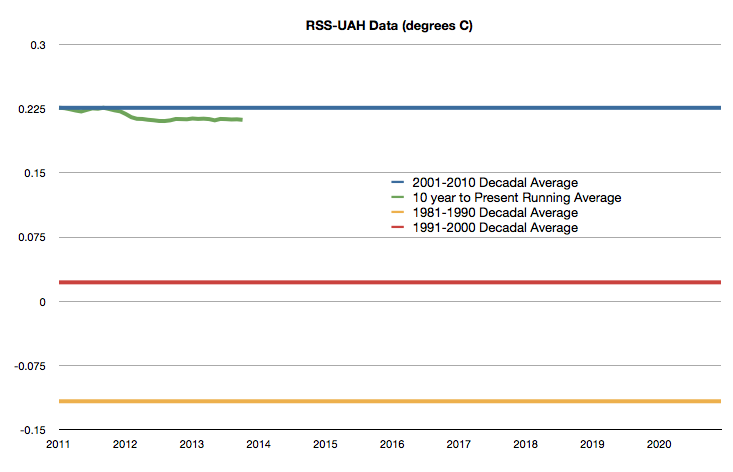
Just to clean things up a little, here is how I would suggest is the most accurate way to track the bet. The 2001-2010 decadal average is set in stone. That doesn't change, so I've just established it as the bar that determines the over or under outcome. The green line is the 10 year to present moving average temperature. If that green line is above the blue line come December 2020, then the climate realists win. If the green line is below the blue line, the "skeptics" win.
Note that the decade of 1991-2000 was 0.139C warmer than 1981-1990, and the decade of 2001-2010 was 0.204C warmer than 1991-2000.
The chart below is current as of September 2013.


jhnplmr, your own calculations show only a 3 W/M^2 decrease of insolation in that one tiny region from the year 1950 to the year 3950--only .7%. You are confusing the readers of your comments, and I think yourself, by flipping between references to such small short-term changes and large (e.g., 43 W/M^2) long-term changes (over the past 10,000 years).
You also are causing confusion by referencing glaciations and then disclaiming that you are making claims about glaciations. Glaciations do not happen merely because of the change in insolation in that small region of the world, but because of a host of feedbacks, the conditions for which have been altered by human-created higher levels of greenhouse gases. The next glaciation is not going to happen for many tens of thousands of years, which you seem to have acknowledged. So you'll improve your argument by dropping references to glaciations.
As Rob Honeycutt suggested, you should get context for that size of insolation decrease. Even that tiny geographical region's outsized decrease is nearly inconsequential in the context of the total forcings and feedbacks, as Rob Honeycutt was trying to get you to understand by pointing you to Kiehl and Evans. For a summary you might try the SkS post by Trenberth.
For more context, note the neglible consequences of an insolation decrease of 1 W/M^2 over the entire globe--the consequence of another Maunder Minimum.
O/T
How did you add the pointer-magnifier? That was slick: no user clickety-fiddlery required, it was shows up where and only where needed.
otoh, maybe best to let plagiarizing denier sites figure it out for themselves ;-)
This discussion should be moved to "An ice-age is coming" Most of this is well covered ground. I should also point out that the last time earth was at 450ppm, we still had Milankovitch forcings but we didnt have ice ages.
[TD] Agreed. That means everybody.
#47 Michael Sweet
"The link you have posted is not very helpful since it is raw data"
Surely it is not impossible for an intelligent person such as yourself to convert that raw data to a graph as I did? The original raw data is much more useful than derived readings from a graph.
"It is clear from your postings that you have misread your link and think 2,000,000 years is 20,000 years"
How can you comment on a graph you haven't seen and are apparently unable to plot for yourself? BTW, I didn't misread the data and didn't confuse 2 million years with 20 thousand years. Please maintain some semblance of rationality if you want to be taken seriously.
#44 Rob Honeycutt
"I think HK has just proven my point about making elemental errors and looking foolish."
I see that you descended to personal abuse. Firstly I did not make "elemental errors" and the figures were correct to less than 1%. I had to make a small correction to the two sets of data I used otherwise I would have had a discontinuity in the graph. The sets of data were Orbit91 and bein11.dat. They gave slightly different levels for Jul 65N solar insolation for the present day (year 0 on the graph). The small correction does not affect the maximum and minimum points so my assertion that the next minimum occurs in 2000 years time is correct.
"It's incumbent upon you to more completely do your research before making fantastical claims."
My claims are not "fantastical", they are based on many sets of published data and the resultant graphs compiled from that data.
I might point out that when I posted my first comment I was directed by the moderators to read an article *We're heading into an ice age". This indicates a basic misunderstanding of our present situation. We are in an ice age at the present time and have been for the last 2.6 million years. An ice age is defined as a cool period with ice forming at the poles. As we still have ice at the poles by that definition we are still in an ice age so we can't be "heading into one". We are in a brief interglacial period within that ice age which has been artificially extended by man-made global warming.
[TD] If you had bothered to read the first three paragraphs of the SkS post I pointed you to, you would have realized that in lay language "ice age" is a synonym for "glacial period," and the title of that post was a response to a myth that in lay language almost always uses the term "ice age." The SkS post makes that clear. If you are going to participate in discussions on Skeptical Science, you need to make a reasonable effort to read, not just type. It's fine if you don't understand something, but not fine to fail to try.
You have now made clear that this conversation does indeed belong on that other thread. Please post there, everybody.
#51 Tom Dayton
"your own calculations show only a 3 W/M^2 decrease of insolation in that one tiny region from the year 1950 to the year 3950--only .7%."
I might say 0.7% of what? Do you think it helpful to suddenly introduce 1950 into the discussion? I based my year zero on the graph on 1950 as it made it easier to transfer the data to the spreadsheet. You seem to want to consider a nebulous point between 1BC and 1AD as year zero. Let us call the present day 1950 and call it year zero it will save a lot of confusion. The solar minimum will occur in 2000 years time, 3950AD using your scale.
By my figures the present solar insolation in Jul 65N is 426.76W/m2, it will fall to 423.61W/m2 in 2000 years time, a fall of 3.15W/m2. You say this is a fall of 0.7%, I repeat 0.7% of what?
"You are confusing the readers of your comments, and I think yourself, by flipping between references to such small short-term changes and large (e.g., 43 W/M^2) long-term changes (over the past 10,000 years)"
I may be confusing the readers of my comments but I am not confusing myself. I introduced the large fall in insolation from the peak 10,000 years ago to contrast it with the rise in man-made forcing since 1750. That fall in insolation caused a fall in the Vostok ice core temperatures for some 4000 years and then the mean temperatures started to rise. They reached the present mean level after another 2000 years and have remained relatively constant ever since. I put this rise down to man-made warming due to early agricultural and clearing of forests. I looked upon this rise as beneficial as it has offset the undoubted fall in global temperatures which would have occurred otherwise.
"You also are causing confusion by referencing glaciations and then disclaiming that you are making claims about glaciations"
I am trying to clear up the confusion about where we stand at the present time. We are in an ice age and have been for the last 2.6 million years. Ice ages are subdivided into long cold glacial periods and brief warm interglacial periods. We are in a warm interglacial at the moment. It has lasted much longer than usual due to the activities of man. I consider this beneficial as I wouldn't want us to experience a period of global cooling which would have resulted otherwise. The people on this board seem to want the temperatures to remain constant indefinitely, they don't want us to climb out of the ice age and return to "normal temperatures" but also don't want us to slide into another glacial period. An ice age is a period of constant climate change with ice sheets advancing from the poles and then retreating. It is asking a lot to insist on perching on the cusp of a brief interglacial indefinitely. We haven't got the energy resources to achieve this goal.
"So you'll improve your argument by dropping references to glaciations."
No I won't, these references are essential to my arguments. They illustrate where we are and what we are trying to achieve.
"Even that tiny geographical region's outsized decrease is nearly inconsequential in the context of the total forcings and feedbacks, as Rob Honeycutt was trying to get you to understand"
By tiny region you mean Jul 65N insolation? If so, a glance at a graph showing Vostok temperatures and Jul 65N solar insolation will show a very strong correlation between the two. I suggest you plot the graphs, as I have, and look for yourself.
jhnplmr, I have replied to you on an appropriate thread: "Are we heading into a new Ice Age?"
"Moderator Response:[TD] If you had bothered to read the first three paragraphs of the SkS post I pointed you to, you would have realized that in lay language "ice age" is a synonym for "glacial period"
The problem with using "ice age" instead of "glacial period" is what do you call a succession of glacial periods interspersed with interglacial periods? I call it an ice age, like the one we have been in for the last 2.6 million years. I think it is important to realise that we are in an ice age and that we are trying to maintain an impossible position perched on the edge of an interglacial cusp.
BTW, I do realise that most people do call a glacial period an ice age, I used to myself until I learnt better! I will try to keep up with your recommended reading in future and try to stop annoying you and your fellow board members, unless the temptation gets too hard to resist!
Can someone just clarify two things for me please? I've skimmed through the comments but didn't see these questions addressed; apologies if they already have been.
Firstly, the UAH data set in use at Wood for Trees is v5.5; the latest set is v5.6. This may make minimal difference, but obviously the most recent set is the producer's 'gold standard'.
Secondly, are the different base periods in use by RSS and UAH accounted for? I see that Fig. 3 above hasn't been off-set. It might not make any difference to the overall result, but the actual figures wouldn't be right if they aren't aligned to the same anomaly reference period.
Averaging monthly data from UAH v5.6 and RSS (offset by -0.10 to bring all the data into the 1981-2010 base period), I get an anomaly average of 0.178 for the decade Jan 2001 to Dec 2010; and an anomaly average of 0.133 for the decade started Jan 2011 (to October 2013) .
jhnplmr @58:
(Source)
Fairly clearly "ice age" is used in popular language to mean either "a geological epoch with ice caps at one or both poles" and "a period of greater than average glaciation within an iceage, ie, a glacial". Yes, it can be confusing. No it is not scientific language, but then very little is.
Using scientific language when it differs from popular language only results in confusion. In popular presentations, you need to either use scientific language, but explain how it relates to popular language; or use popular language, but explain how it relates to scientific language. Neither of these choices is automatically better, and if you are explaining things to people who are unlikely to follow up in the scientific literature, the later is probably preferable.
And in answer to your specific question, you simply call it the Quaternary glaciation.
#60 Tom Curtis
"And in answer to your specific question, you simply call it the Quaternary glaciation"
If you mean the question "The problem with using "ice age" instead of "glacial period" is what do you call a succession of glacial periods interspersed with interglacial periods? " then "Quaternary glaciation" is not the answer. That is merely the name of the current ice age. There have been at least five major ice ages in the Earth's past (the Huronian, Cryogenian, Andean-Saharan, Karoo Ice Age and the Quaternary glaciation). The general name is "ice age".
[PW] This is the *last* warning: Take any more ice age discussion to the appropriate thread. This is a thread concerning the bet for charity. Other comments here on Ice Age topics will be removed.
Nature doesn’t play to the Julian calendar, you get different results depending on the start point you use, which is of course why deniers try use 1998 as the start of claimed cooling.
Use 2011-2020 and you start with a cooler year, but then NOAA has always used the decadal period as the zero years to the 9th i.e. 2000 to 2009 or 1990 to 1999.
On this long standing measure the 90's where the warmest decade, they were replaced by the 00's, and with 2010 (warmest year on record) we are off to a strong start for the next, yes 2011 was cooler, but compare it to it's equivalent of a decade ago (NASA figures) 2001 (0.52c) above the mean, 2011 (0.54c) or using the NOAA reference point, 2000 (0.4c), 2010 (0.66c), 2003 (0.59c) and 2013?, still in play but looking set to be in the top 6-7 warmest years in the modern record.
2011/12 where affected by a double La-Nina, that is a seasonal effect, that will pass, 2013 recovered strongly and if that continues and we move from neutral ENSO to an El Nino, then 2014 will be very warm.
The other factor is the PDO, it has been in negative phase since 2005, it would seem highly likely it will shift before the end of the decade, when it does we will see a spike in temperatures over at least years, depending on the length of the current event and if it lasts only about a decade or is a longer event like the one observed in the 1940’s of course even that event had a reversal in the late 1950’s, but then the current event seems to have had a much reduced influence, we have not seen the dips into cold weather seen in previous events in fact 2005 & 2010 are the warmest years we have seen (even with a negative PDO) and 2008 (which deniers made so much about) is in fact warmer than 1995, which back in the day, was the warmest year in the modern record.
I'd say your bet is pretty safe.
Antarcticice... Thanks. That's pretty much what I've believed all along.
In fact, that deniers have been claiming "flat" or "no warming" actually gave me more confidence in the bet. The rate of surface warming is clearly going to change from decade to decade. We're clearly continuing to increase the ratiative properties of the atmosphere. The rate is not going to go negative, it has to flip back and catch up to the long term trend at some point. I'm with you. I think that's going to happen before the end of this decade.